Drilling Time Statistical Analysis and Benchmarking for Drilled Wells of Zubair Field
Activities of drilling wells are widely continued and increased all over the world either to develop the mature reservoirs or to discover new reserves. The majority of these wells experience numerous issues during drilling operations, resulting in financial losses and wasted time. This is referred to as non-productive time (NPT). Due to these difficulties, all of these concerns present a challenge to not only the drilling engineer or designer but also the company as well. All parties want also to keep the continuous improvement of their operations. Therefore, this paper aims to analyze most of the drilling issues appeared during drilling Zubair wells which are located in the Eastern Iraq. Furthermore, drilling time statistical study is done to differentiate between the various causes of Zubair wells' problems. A rate of penetration (ROP) benchmarking study is also done so as to determine the drilling performance relative to the best well. A comparison is performed to know the best well performance.
Al Gburi H, Halafawi M*, Al Gburi H and Avram L
Petroleum-Gas University of Ploiești, Romania *Corresponding author: Mohamed Halafawi, Petroleum-Gas University of Ploiești, Romania, Tel: 0040799641954, Email: halafawi@upg-ploiesti.ro
Introduction
Planners and engineers of drilling activities and operations are usually tasked with evaluating the cost and efficiency of their drilling and well-services operations. These assessments can be used to determine areas for improvement, as well as operations or activities that are performing well or poorly, and to compare the performance with those of different operators or contractors. Analyses can also be used to compare and evaluate the efficacy of different well-building procedures and technologies. These types of analyses can be performed by the operator using electronic data collected on the rig site and connected to corporate reporting systems or data storage. Everything discussed above is referred to as „performance benchmarking” [1, 2, 3, 4, 5]. As a result, when it comes to determining drilling performance, this analysis is extremely useful.
Therefore, our work objective is to study the recent wells drilled in Zubair field. The drilling operations and their times are analyzed specifically the NPT that has a great impact on the drilling performance. A comparison between Zubair wells has also done in order to study the drilling operations, problems and behavior of executant crew. Furthermore, a benchmarking approach is proposed based on Rate of Penetration (ROP) so as to show the performance of each well relative to the best well of the best performance. However, the proposed benchmarking approach in this study focuses on ROP occurrences. Variations in flat time periods are not taken into consideration. In a time versus depth curve, a flat time period is the length of time spent on operations during which the well’s depth does not increase.
Literature Review Survey and Background
Looking over the literature, it appears that drilling performance benchmarking is depended on data collected from rig locations with little or no processing of the raw data. For the oil and gas industry, an alternate drilling performance comparison approach is required since the present methods for comparing drilling performance are primarily centered on displaying time versus depth plots and analyzing whether any improvements have occurred in the most recent well (s). Drilling time vs. depth graphs are made up of two types of data points: specifically, the flat and drilling time elements. When evolving a massive field, the operational procedures for the flat time component are routine, and they will take absolutely the same time for the same type of activity in successive wells drilled in the same oil or gas field. Based on all preceding ROP histories, the current research study suggests determining which well had the best overall ROP performance (Table 1).
| Author | Year | Research Studies |
|---|---|---|
| Ikoku [6] | 1978 | Forecasting drilling time and manpower requirements for future drilling operations by proposing a learning-curve technique. |
| Bourgoyne, et al. [7] | 1986 | Doing the examination of drilling performance data based on changes in bit behavior as a consequence of surface measurements |
| Brett and Millheim [8] | 1986 | Illustrating that the sole tool utilized to compare the drilling success (or failure) of a series of wells is the traditional depth versus days plot. According to their findings, data gathered from drilling performance curve analysis can show a company’s technological and operational competence to drill quickly in a specific location. |
| Walker and Coumans [9] | 1988 | The use of computers to handle and store drilling data makes analyzing drilling performance easier. |
| McCammon, et al. [10] | 1993 | Using Benchmarking to leverage the data collected for ongoing improvement of the drilling process rather than developing parameters from the collected data. |
| Bernt [11] | 1996 | Talking about the availability of data in past and now, and their importance to improve the drillability evaluation. |
| Devereux [3] | 1998 | Presenting two ways of performance optimization regarding avoiding hole problems and good drilling practices. |
| Mitchell [12] | 2007 | Referring to drilling dynamics measurements as a method of monitoring drilling performance, including downhole signals to improve drilling efficiency while reducing non- productive time. |
| Amar [13] | 2007 | Presenting that drilling analysis is not as common as it could be, and operator companies are eager to shorten the rig time on the well so as to align incentive schemes with their objectives. |
| La Greca Veiga, et al. [14] | 2008 | Showing that current drilling performance monitoring technologies require a uniform framework for drilling data processing. They advocated organizing current information into a drilling analysis methodology, which would meet the needs of the emerging specialty of drilling analysis. |
| Kaiser [15] | 2009 | Modelling time and cost for drilling an offshore well. |
| Mensa-Wilmot, et al. [16] | 2009 | Describing Benchmarking as an examination of drilling performance from a historical perspective in order to determine what worked successfully. |
| Rushmore [17] | 2011 | Selecting the best well In a class where operators can regionally and globally organize their well construction and abandonment performance benchmarking. |
| Armenta, et al. [18] | 2013 | Doing recent studies on oil field performance improvements in Middle East region based on drilling time against depth curves. |
| Benyeogor, et al. [19] | 2016 | Making Benchmarking for drilling performance based on cost, time, and oil or gas well output. |
| Basbar, et al. [20] | 2016 | Showing that the total NPT presented in the drilling well report demonstrates subjectivity because the definition of NPT varies by drilling supervisor and/or operations engineer. |
| Eren and Kok [21] | 2018 | Introducing ROP indexing methodology as a new benchmarking technique for determining the drilling performance. |
| Halafawi and Avram [1] | 2019 | Doing statistical performance analysis using wellbore and downhole equipment in an horizontal well went through 5 targets |
| Ivan, et al. [2] | 2022 | Performing NPT statistical and Benchmarking study for HPHT well to determine the drilling performance compared with the best well locally and globally. |
Table 1: Literature survey of drilling performance history.
Zubair Field Description
In southern Iraq, it is located the Zubair field which is an onshore oil reservoir field. Figure 1 shows a map of the reservoir domes and a structure contour map indicating the producing zones: the 3rd and 4th pay zones, as well as their drilled wells.
![Figure 1: Structural map for reservoir pay zones and reference wells location [22].](/fulltextimages/8665/fig_1.png)
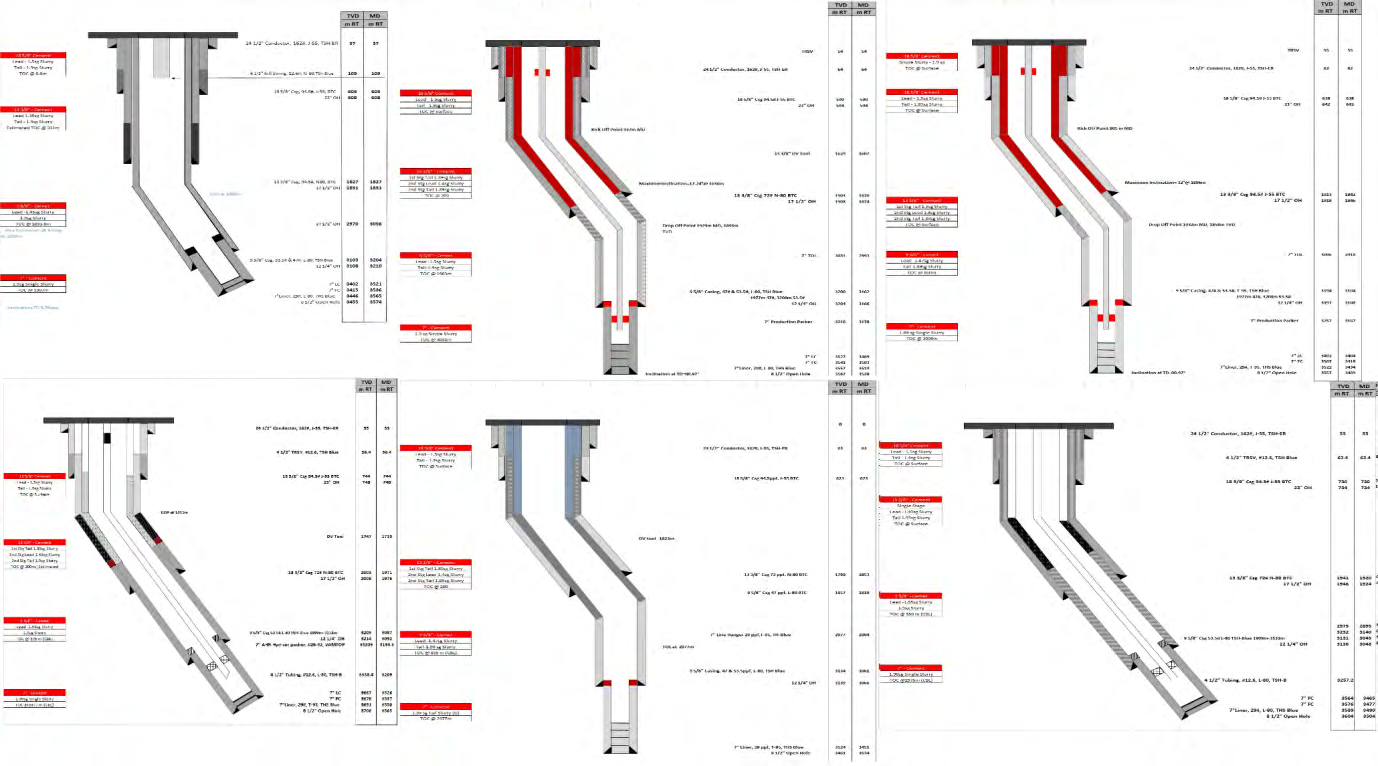
![Figure 2: Geological column for Zubair field [22].](/fulltextimages/8665/fig_2.png)
Figure 2 shows geological column for Zubair field with various hole sections, casing setting points and diameters. The reference wells for production expectations for well ZB-398 Dir (proposed) in the 3rd pay zone reservoir are oil producers ZB- 283, ZB-325, ZB-078, ZB-116, and water injectors ZB-278 and ZB-210. The reference well for production expectations for ZB- 385 Dir (new) in the 4th pay zone reservoir, however, is ZB-200. The company’s future ambitions include growing production and expanding into other industries. The current plans, on the other hand, are a development strategy. Three development wells are planned to be drilled in order to improve oil output from the Zubair field reservoir’s third pay zone. The 3rd pay zone currently has 14 wells producing. ZB-390, ZB-391, and ZB- 398 are the three wells that will be drilled.
Wells’ data Analysis
There are many wells drilled in Zubair field since it was discovered. However, the data of the recent 7 wells are available:ZB-288, ZB-290, ZB-295, ZB-311, ZB-349, ZB-367 and ZB-398. Table 2 and Figure 3 show the analysis of these wells.
| Well Name/ Item | ZB-288 | ZB-290 | ZB-295 | ZB-311 | ZB-349 | ZB-367 | ZB-398 |
|---|---|---|---|---|---|---|---|
| Location | AQ-39 Dir | N/A | AN-34 | AP-36 | Dir. (AG-18 Dir) | Dir. (AI-15-3 Dir) | Dir. (AJ-22_3) |
| Well Classification | Oil Producer / Directional | S-Shape Oil Producer | Deviated Oil Producer (S-Shape) | Oil Producer / Directional | Oil Producer / Deviated | Oil Producer / Deviated | Oil Producer / Deviated |
| Expected Total Depth | 3455 m TVD RT / 3581 MD m RT | 3515m TVD RT /3559m MD RT | 3427m TVDSS / 3453m TVD RT /3542m MD RT | 3438m TVDSS /3466m TVD RT / 3555m MD RT | 3542 m TVDSS / 3529 m TVD RT / 3709 m MD RT | 3515 m TVDSS / 3525 m TVD RT / 3635 m MD RT | 3481 m TVDSS /3494 m TVD RT / 3662 m MD RT |
| Closest DGS | Zubair DGS 1900 m | Zubair DGS 1500 m | Zubair Mishrif DGS 1500 m | Zubair Mishrif DGS | Hammar- Mishrif | Hammar Mishrif DGS | Hammar Mishrif DGS |
| GL – MSL | 18.052 m | 21.29 m | 13.67 m | 17.59m | 2.36 m | 1.02 m | 2.12 m |
| RT Elevation (GL) | 10.500 m | 11.66 m | 11.66 m | 10.5m | 10.5 m | 9.10 m | 10.50 m |
| RT Elevation (MSL) | 28.552 m | 32.95 m | 25.33 m | 28.09m | 12.86 m | 10.12 m | 12.62 m |
| Well Targets Identification | |||||||
| Lithology of the targets | Sandstone | Sandstone | Sandstone | Sandstone | Sandstone | Sandstone | Sandstone |
| Targets Formation | 3rd & 4th Pay | 3rd & 4th Pay | 3rd & 4th Pay | 3rd & 4th Pay | 3rd Pay & 4th Pay | 3rd Pay & 4th Pay | 3rd Pay & 4th Pay |
| Targets Depth | 3rd Pay 3182 m TVD RT / 3284 m MD RT | 3rd Pay- 3234m TVD RT / 3278m MD RT | 3rd Pay 3160m TVD SS 3186m TVD RT / 3275m MD RT | 3rd Pay -3152m TVD SS / 3180m TVD RT / 3269m MD RT | 3rd Pay -3263 m TVD SS / 3276 m TVD RT / 3421 m MD RT | 3rd Pay –3232 m TVD SS / 3242 m TVD RT / 3337 m MD RT | 3rd Pay -3188 m TVD SS / 3200 m TVD RT / 3334 m MD RT |
| 4th Pay 3349 m TVD RT / 3465 m MD RT | 4th Pay 3317m TVD SS / 3342m TVD RT / 3432m MD RT | 4th Pay -3314m TVD SS / 3342m TVD RT / 3430m MD RT | 4th Pay -3415 m TVD SS / 3428 m TVD RT / 3585 m MD RT | 4th Pay -3345 m TVD SS / 3358 m TVD RT / 3509 m MD RT | |||
| Tolerance Radius | - | 50 m | 50 m | 50 m | 50 m | 50 m | 50 m |
Reservoir Pressures and Drilling Time Estimates
3rd Pay: 3280 psi @ 3261 m TVDSS in H level and 3590psi @3261 m TVDss in L level based on the offset wells ZB-255 recorded. 4th Pay: 4800- 4900 psi @ 3460 m TVDss based on offset wells ZB-230 RFT.
3rd Pay reservoir: 3175-3325 psi @ 3261 m TVDSS based on the offset wells ZB-254 RFT recorded. 4th Pay reservoir: 4700 psi @ 3461 m TVDSS based on the offset wells ZB-260 RFT recorded.
3rd Pay reservoir: Per Layer “H” layer 3,150 psi @ 3261m TVDSS, “L” layer: 3,350 psi@ 3261m TVDSS. All layers average: 3,100 – 3,200 psi @3261 mTVDss. 4th Pay reservoir: 5,000 psi @ 3,460 m TVDss.
Upper Mishrif: 2200 – 2800 psi @ 2316 mTVDss. Middle Mishrif: 3300 – 3500 psi @ 2316 mTVDss. Lower Mishrif: 3300 – 3500 psi @ 2316 mTVDss. 3rd Pay: 3400 – 3500 psi @ 3261 mTVDss. 4th pay: 4850 - 5050 psi @ 3261 mTVDss
- 3rd Pay: 3277 psi and 3595 psi @ 3261 m TVDSS in
- H and L level respectively, based on RFT recorded in well ZB230.
- 4th Pay: 4140 psi @ 3460 m
- TVDSS base on WT+PLT recorded in well ZB-139T
- Estimated
- Reservoir
- Pressure of
- Targets
- Drilling Time est.
- 82.5 Days
- 75.81Days
- 62.70 Days
- 62.1 Days
- 54.4 Days
- 55 Days
- 43.00 Days
Table 3: Zubair wells analysis.
Drilling Time Analysis of Zubair Wells
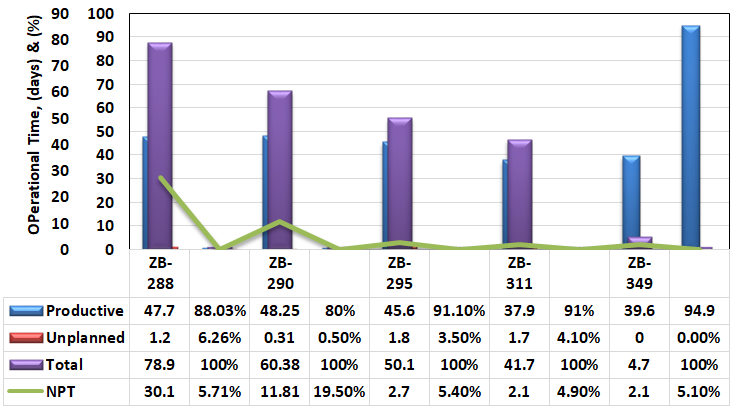
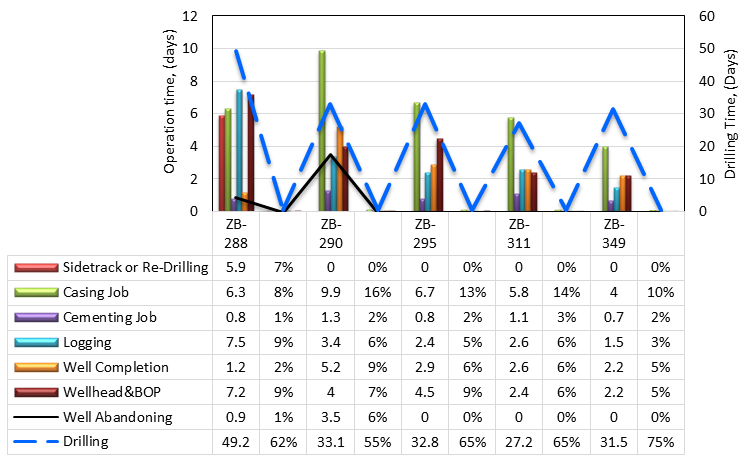
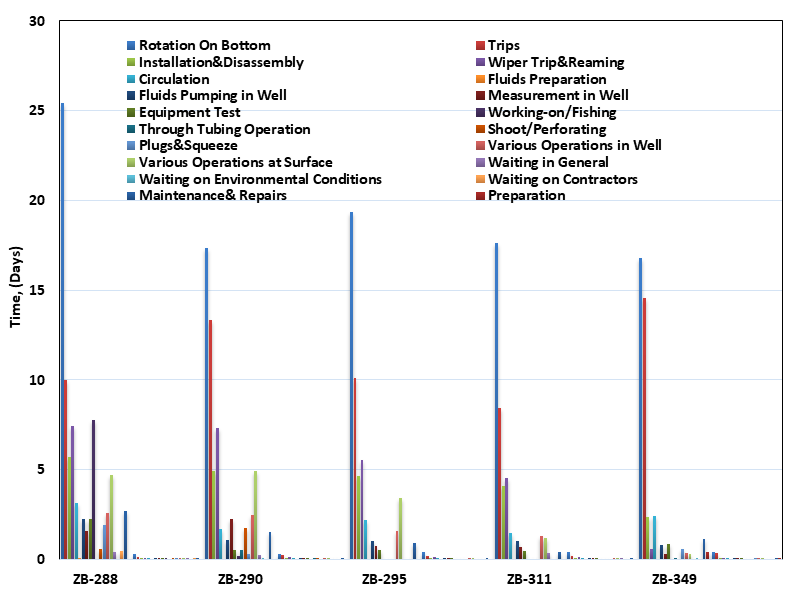
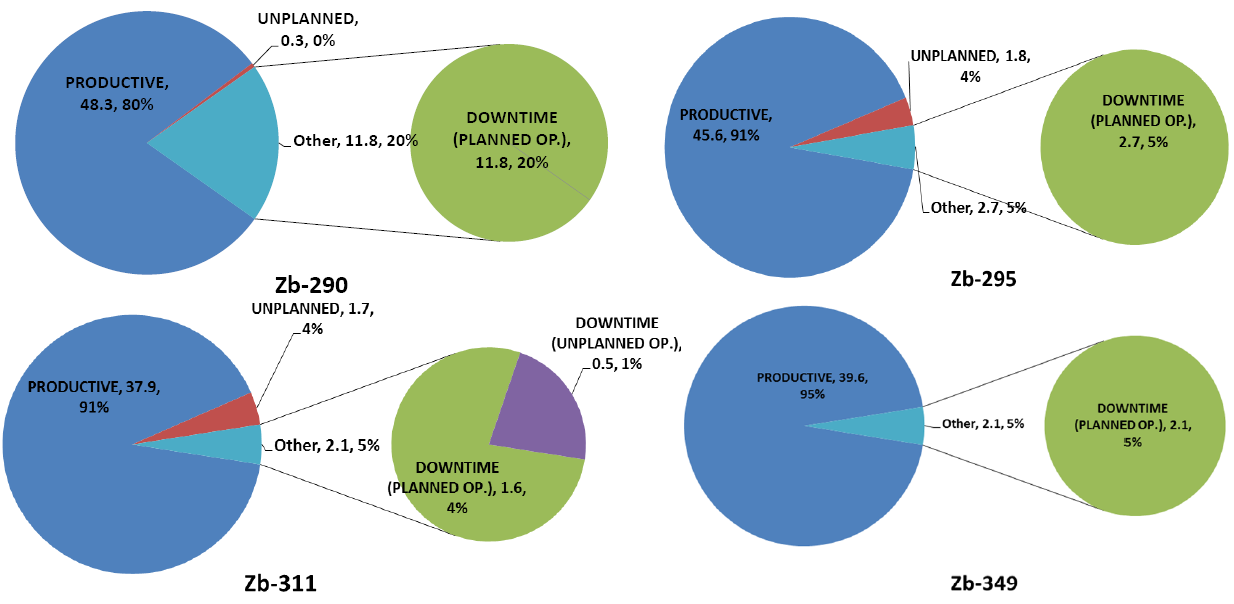
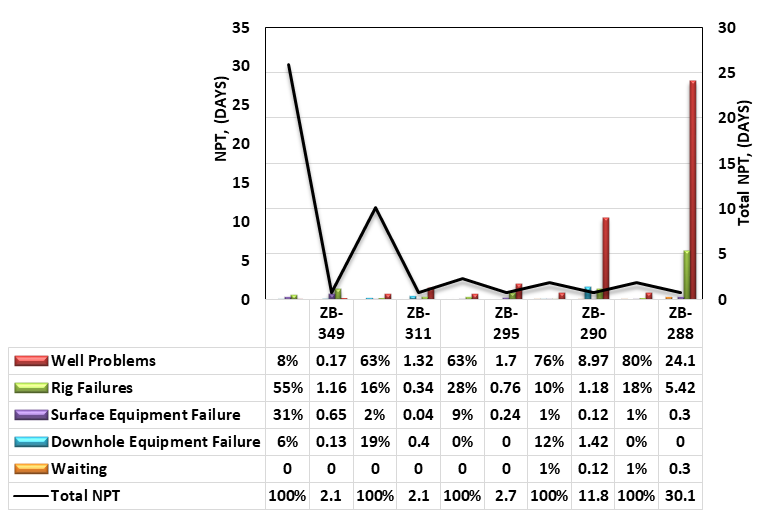
Drilling time is an important factor during exploring any hydrocarbon field because it is considered as a direct indicator for the amount of money spent. This time may be productive or non-productive (NP). In case of NPT, the company wastes so much money without achievements. Therefore, we are analyzing the drilling time and its distribution in this section. Figures 4-10 show the distribution of actual time relative to estimated one, productive and non-productive time relative to the total one during operations, time distribution based on various drilling operations, total time breakdown distribution by activity, total time breakdown by Typology, and the total NPT. In a bar curve, a flat time period is the length of time spent on operations during which the well’s depth does not change. It clear that the drilling time is decreased for wells followed ZB-288 because the time needed to drill 12 1/4” section was high (Figure 4).
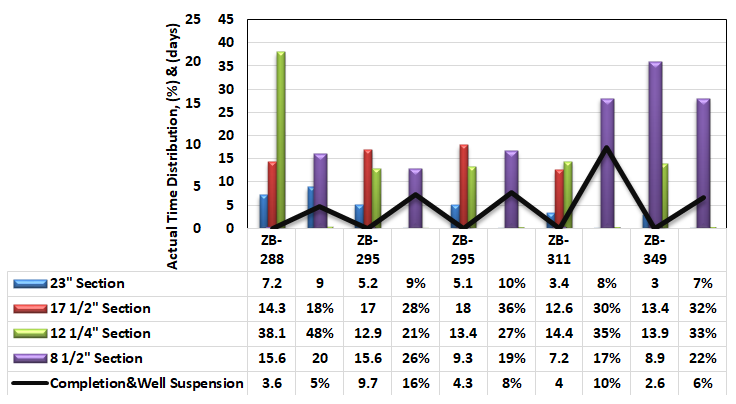
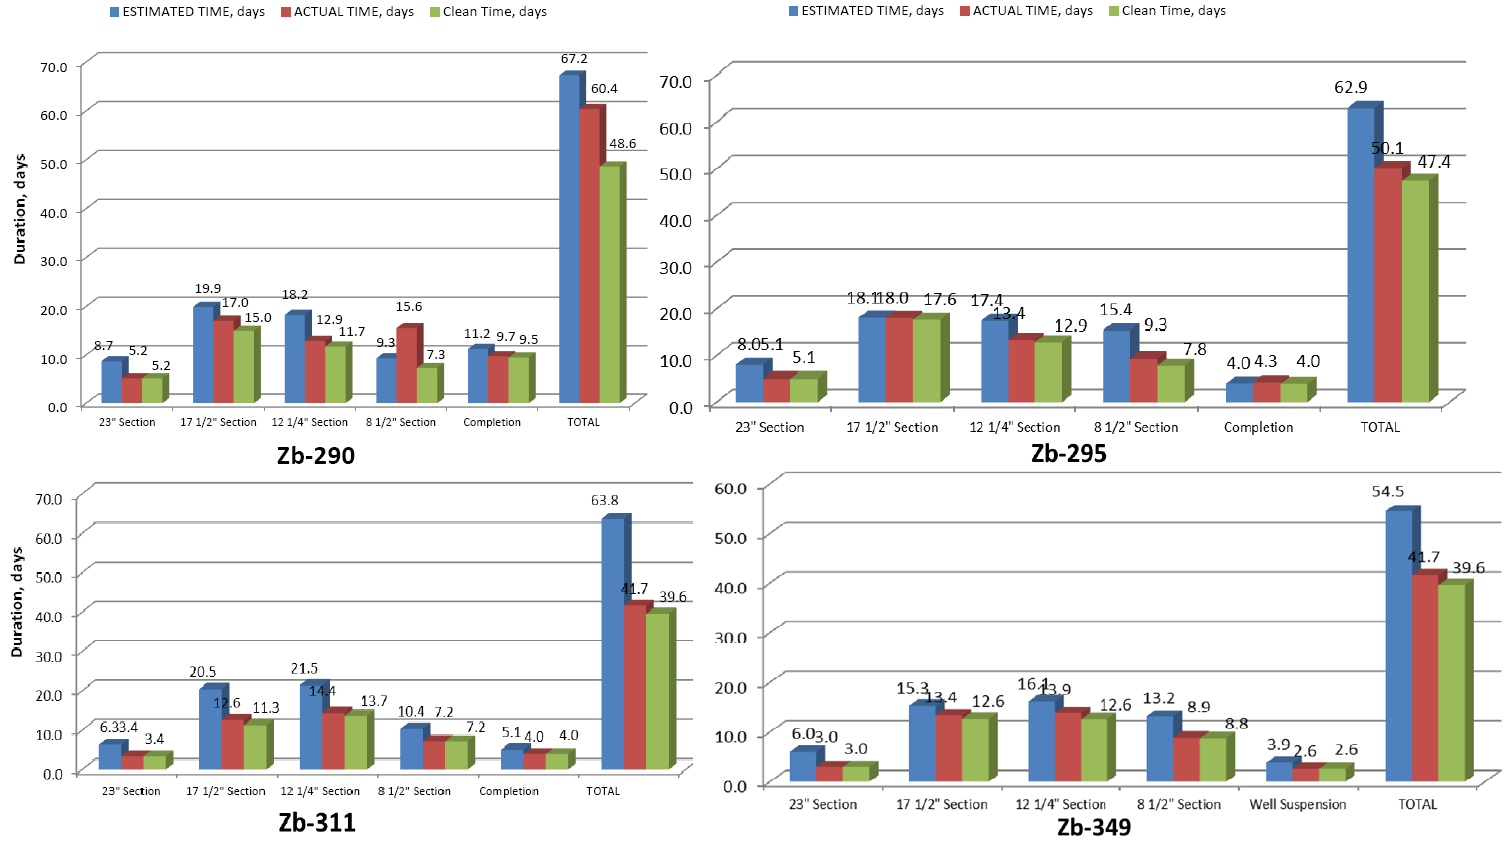
This is due to the higher NPT spent to solve the problems appeared in ZB-288, thus this led to avoid these problems such as wellbore problems and rig repairs in the following wells (Figures 5, 6 and 10). However, the same figures show that the necessary time for drilling 8 1/2” hole is increased due to various completion objectives regarding pay zones and production strategies. Furthermore, the actual drilling and productive times are obviously reduced compared with the estimated ones (Figure 5 and 6). Also, the total NPT is reduced for the well following ZB-288 (Figure 6). Regarding the drilling operations and activities, all operation times are remarkably reduced such as drilling, cementing, logging, completion, …etc. By making topology for planned and unplanned times for Zubair wells, it is appeared that there are some unplanned and other times shown in Figure 9 which appeared during comparing 4 wells of the Zubair field. This is due to the un-anticipated problems, repairs, maintenance or logistics; thus the total NPT is increased as shown in Figure 10.
ROP Benchmarking and calculations
ROP Benchmarking methodology depends on the offset wells’ recorded data coming from the daily reports of all drilling operations. These reports contain huge amount of data and information for each activity or operation done during drilling a certain well. The proposed methodology uses Equations 1 through 4 provided by Eren and Kok [21]. The ROP performance is calculated by Equation 1 through which a non-physical variable “ROPIndex” is then defined for deeper drilling sections and calculated from Equation 2 based on ∆Depth.
$$ R O P = \frac {\Delta D e p t h}{\Delta T i m e} (1) $$
$$ R O P _ {I n d e x D 1 - D 2} = \Delta D e p t h _ {D 1 - D 2} x R O P _ {D 1 - D 2} \tag {2} $$ The following equation is used to compute the summation of ROPIndex magnitudes:
$$ \sum R O P _ {I n d e x} = \sum_ {1} ^ {T D} R O P _ {I n d e x D 1 - T D} \tag {3} $$ TD
1 1 Index Index ROP Depth ROP Total Well Depth − = ∑ (4)
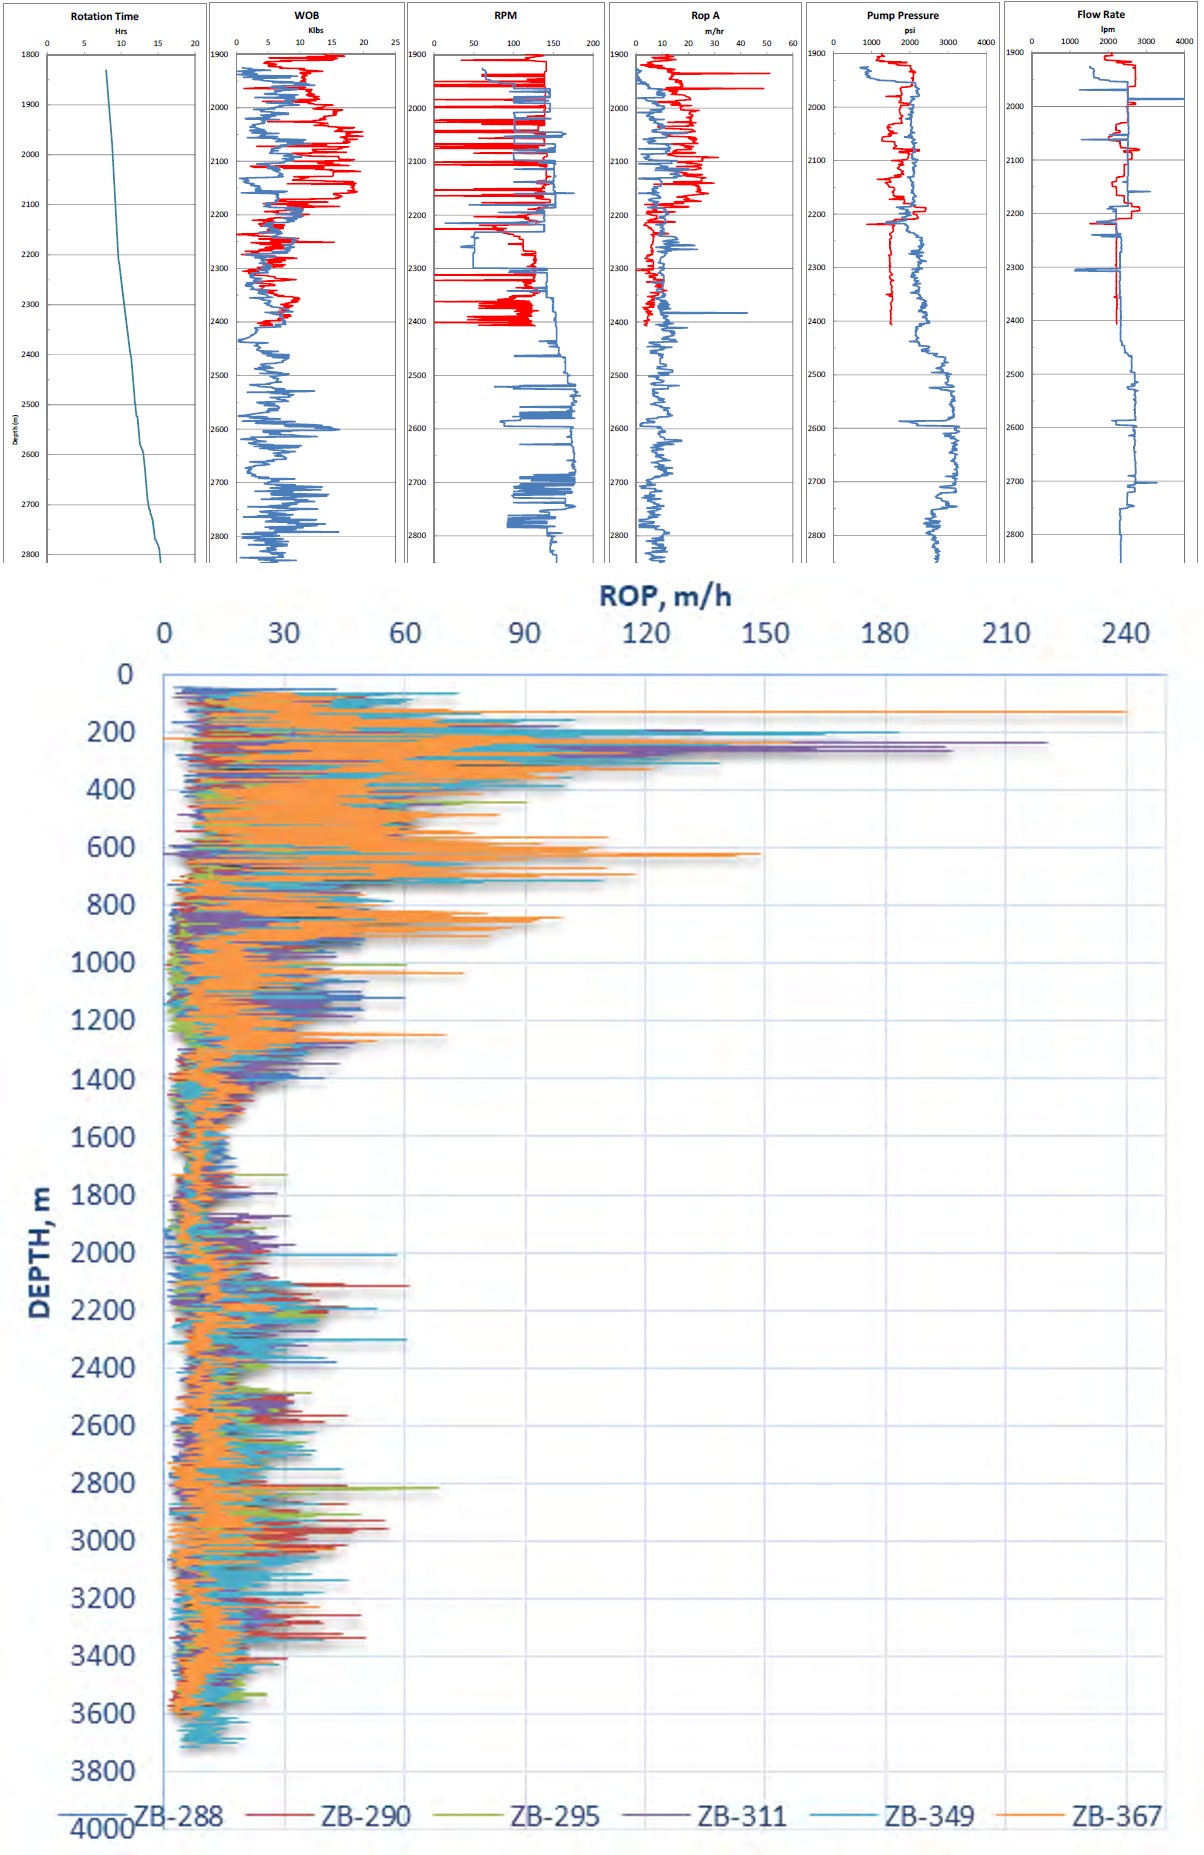
Our methodology and calculations are based on field data collected from the drilling reports and MWD/LWD logs. Example chart shown in Figure 11 illustrates the data used measured during calculations for well ZB-288.
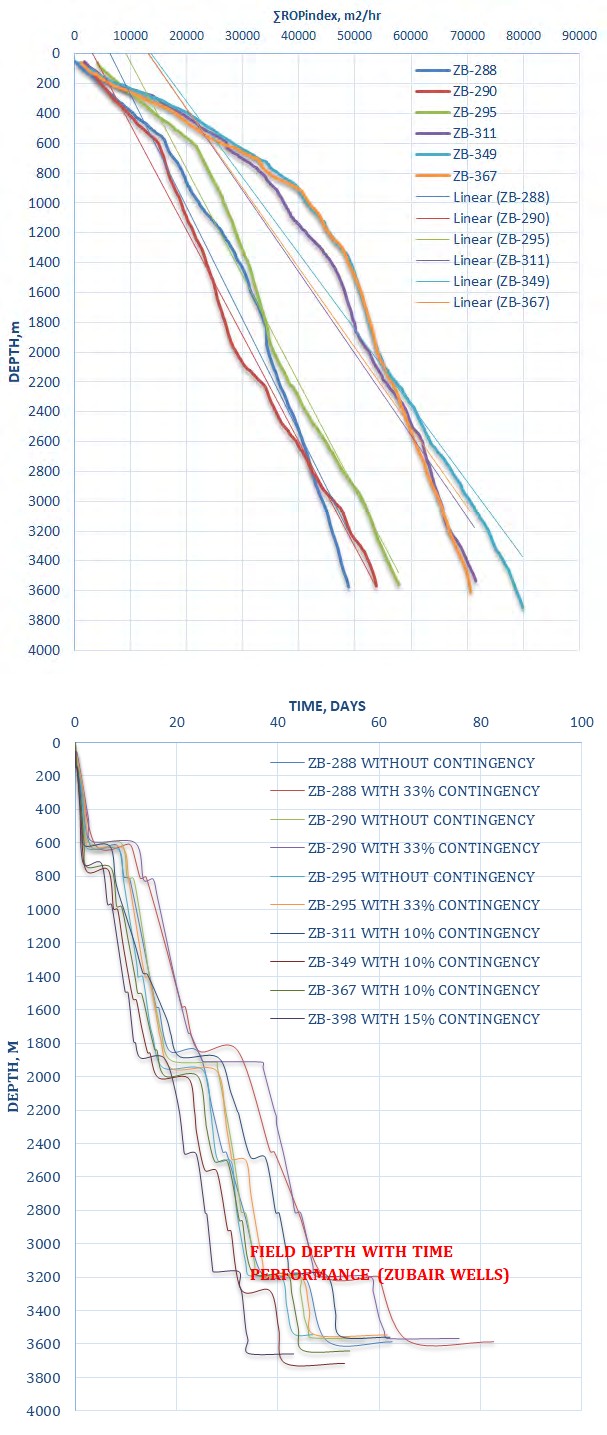
Results’ charts for Zubair wells are shown in Figure 12 to demonstrate differences in drilling efficiency benchmarking between the traditional time versus depth and ROP Indexing methodologies. Obviously, wells that has had a significant quantity of NPT yet has been drilled efficiently in terms of ROP are not the best wells. The “Field ROP Index” graph (Figures 12a & 12b) shows the ∑ROPIndex vs Depth for the same wells, whereas the second Figure 8.b shows the traditional time vs depth data for the same wells. When looking at the time vs depth curves, it can be seen that well ZB-398 has a better over the available Zubair wells. However, when looking at the “Field ROP Index” the graphic shows that well ZB-349 outperformed Zubair wells in terms of the ROP Index. The rig owner/operator should analyze why ZB-398 did not appear to be the best well although it has the lowest drilling time, since the reason resides in the operational steps that were caused by the non-drilling progress activity. The new benchmarking displays which well performed best in ROP and which well did not. However, a look to the time study would reveal the situation of ZB-398 regarding NPT, well problems, rig repairs and another issues that affected thus on the drilling performance from the ROP point of view. Additionally, the best ROP performances are achieved by the operator through drilling wells ZB-288, ZB-290 and ZB-295 although they had a higher drilling time. This indicates the early wells of Zubair have majorly been drilled with a better ROP than those recently drilled. The proposed methodology uses daily report data as an input to generate benchmarking data in order to determine the ROP performance of an ongoing well. The NPT events are removed using this technology, masking the performance of a relatively efficient well. The crew in charge of the well’s efficiency can tell which quartile the well is in and whether or not the learning curve has been met. Because the daily report information is required as an input, the ROP Indexing approach is simple to apply. This methodology can be used to contract drilling missions in the future. The operating companies can set incentives for a well’s ROP Index trend and provide a lump-sum payment for the rest of the well.
Conclusions and Recommendations
Zubair wells have a number of issues that arise during and after drilling activities. The goal of this research is to analyze and study the majority of these issues regarding the activity time. Furthermore, a benchmarking study was conducted to compare between wells based on ROP approach proposed. As a result of our findings and discussions, the following conclusions have been drawn:
- The performance of the drilled wells in Zubair field has successfully been determined based on benchmarking approach, time analysis and comparison.
- Drilling time analysis is an important tool for identifying the majority of drilling and operational issues.
- Benchmarking is key-element for determining well drilling performance.
- Rig repairs and well problems account for the majority of lost drilling time.
- In compared to wells drilled, the early zubair wells in our study show a better performance regarding ROP approach than those recently drilled although they took longer time during drilling and completion operations.
- Both time-depth chart and ROP methodology are necessary for knowing the actual drilling performance.
- It is recommended to use a cost study with the previous used methods so as to obtain the total and more accurate drilling performance.
- It is also recommended to do the benchmarking study regionally and globally in order to compare Zubair wells performance with those drilled locally and worldwide by another operators as done by Ivan, et. el. [2].
- Total NPT should be lowered and all offset issues should be resolved in order to achieve best well performance.
Highlights
- Zubair field is one of the biggest oil fields in Iraq, thus any developing techniques or methods are highly necessary so as to achieve the greatest benefits.
- A good literature survey shows how the drilling performance is hierarchy evaluated and determined.
- ROP Benchmarking is an important indicator for knowing the real well performance.
- A comparison study is a key-element for knowing the drilling progress and developments.
- All drilling issues and hole problems can be identified by studying the various times of drilling operations such as NPT, rotating time, operation time, waiting time, drilling time,……etc.
- The best well performance does not means that it only has the least drilling days, but it should have the highest ROP as well.
- A cost analysis study is highly recommended to show the whole image of Benchmarking.
Nomenclature and Abbreviations
D: Depth, m or ft, i.e. D1 and D2 are referring to depths at points 1 and 2 respectively where D2>D1.
Dir: Direction
GL: Ground Level.
HPHT: High Pressure High Temperature
MD: Measured Depth, ft or m.
MSL: Main Sea Level.
MWD/LWD logs: Measurement While Drilling/ Logging While Drilling Logs.
NPT: Non-Productive Time, h or days RFT: Repeat Formation Tester
ROP: Rate of Penetration, m/h
ROPIndex: Rate of Penetration Index, m2/h RPM: Rotation with Revolution Per Minute.
RT: Rotary Table.
SS: SubSea.
TD: Total Depth, ft or m.
TVD: True Vertical Depth, ft or m.
WOB: Weight On Bit, klbs
ZB: Zubair i.e ZB-390, ZB-391, and ZB-398 refer to Zubair wells number 390, 391, and 398 respectively,…..etc.
∆Depth: Change in depth.
References
-
Halafawi M, Avram L (2019) Wellbore, BHA, Motor/ Rotary Steerable, and Bits Statistical Performance Analyses for Drilling Horizontal Wells. Petroleum-Gas University of Ploiesti Bulletin, Technical Series 71(2).
-
Ivan R, Halafawi M, Avram L (2022) NPT statistical analysis and benchmarking for HPHT wells. IJIET 21(3): 44-51.
-
Devereux S (1998) Practical Well Planning and Drilling Manual. PennWell Publishing Company, Tulsa, USA.
-
Lake L, Robert FM (2006) Petroleum Engineering Handbook. Volume II, Drilling Engineering, SPE.
-
Robert FM, Stefan ZM (2011) Fundamentals of Drilling Engineering. SPE Book Series, Richardson, TX, USA.
-
Ikoku CU (1978) Application of learning curve models to oil and gas well drilling. SPE7119-MS, Proceedings of the SPE California Regional Meeting, San Francisco, California, USA.
-
Bourgoyne AT, Millheim KK, Chenevert ME, Young FS (1986) Applied Drilling Engineering. Volume 1, SPE Book Series, Richardson, TX, USA.
-
Brett JF, Millheim KK (1986) The drilling performance curve: a yardstick for judging drilling performance. SPE- 15362-MS, Proceedings of the SPE Annual Technical Conference and Exhibition, New Orleans, Louisiana, USA.
-
Walker S, Coumans H (1988) Drilling related performance. SPE-17563-MS, Proceedings of the International Meeting on Petroleum Engineering, Tianjin, China.
-
McCammon KC, MacKinlay WM, Yoder DL (1993) The development and implementation of a drilling database: a case study. SPE-26257-MS, Proceedings of the Petroleum Computer Conference, New Orleans, Louisiana, USA.
-
Bernt SA (1996) Modern Well Design. 2nd(Edn.), Rogaland University Center, Stavanger, Norway.
-
Mitchell RF (2007) Petroleum Engineering Handbook. Vol. II. Drilling Engineering. Richardson, TX.
-
Amar R (2007) Drilling performance management system. PTC-11099-MS, Proceedings of the International Petroleum Technology Conference, Dubai, UAE.
-
Lagreca AJ, Damski C, Peden JM, Nakagawa EY (2008) The role of knowledge, tools, and systems for drilling analysis. SPE Drill & Compl 23 (04): 330-337.
-
Kaiser MJ (2009) Modeling the time and cost to drill an offshore well. Energy 34(9): 1097-1112.
-
Mensa-Wilmot G, Southland SG, Mays PA, Dumrongthai P (2009) Performance drilling-definition, benchmarking, performance qualifiers, efficiency and value. SPE119826- MS, Proceedings of the SPE/IADC Drilling Conference and Exhibition, Amsterdam, Netherlands.
-
Rushmore P (2011) Anatomy of the “best in class well”; how operators have organized the benchmarking of their well construction and abandonment performance. SPE140172-MS, Proceedings of the SPE/IADC Drilling Conference and Exhibition, Amsterdam, Netherlands.
-
Armenta M, Cuthbert AJ, Ramsawak S, Pointing M, Tinkhof R (2013) Improving drilling performance at majnoon field. SPE-166685-MS, Proceedings of the SPE/ IADC Middle East Drilling Technology Conference & Exhibition, Dubai, UAE.
-
Benyeogor O, Majekodunmi A, Ivan A, Charles I, Eze N (2016) Changing the dynamics of performance management - the micro KPI concept. SPE-184246-MS, Proceedings of the SPE Nigeria Annual International Conference and Exhibition, Lagos, Nigeria.
-
Basbar AEA, Ahmed AK, Abdulbaqi AK (2016) Reducing NPT of rigs operation through competency improvement: a lean manufacturing approach. SPE- 180066-MS, Proceedings of the SPE Bergen One Day Seminar, Grieghallen, Bergen, Norway.
-
Eren T, Kok MV (2018) A new drilling performance benchmarking: ROP indexing methodology. Journal of Petroleum Science and Engineering, 163: 387-398.
-
El Gburi H, Halafawi M, Avram L (2020) Offset-well data improve Zubair wellbore stability. Oil and Gas Journal 118(1).
- Nigeria’s Vulnerability in the Face of Global Energy Policy
- A Simulation Study of Investigation of Optimum Oil Production Performance by Applying Various Gas Injection Methods in Oil Reservoir
- Characterization of Permo-Triassic Reservoirs through Thermal Maturity Assessment of Westphalian Source Rocks in the Cheshire Basin
- Influence of Microwax on the Rheological and Thermal Behaviour of a Wax Crude Oil
- Real-Time Monitoring and Performance Optimization of Steam Injection in Heavy Oil Reservoirs Using Fiber Optic Sensing and Integrated Predictive Simulation Models
- Rapid On-Site Determination of the Total Petroleum Hydrocarbon Content of Soils by Handheld Fourier Transform Near-Infrared Spectroscopy: Development of a Global, Site- and Scanner- Independent Calibration Model