A New Chemical Inhibitor to Mitigate Swelling of Sodium and Calcium Bentonite during Drilling Process
Clay swelling during drilling operations is one of the challenges faced in the oil industry. While both oil-based and syntheticbased muds have been successful at reducing clay swelling, the environmental concerns of oil-based muds and the high cost of synthetic-based muds limit their usage. Commercial water-based inhibitors like sodium chloride (NaCl), potassium chloride (KCl), cesium formate (CHCsO2), ammonium chloride (NH4Cl), and tetramethylammonium chloride (C4H12NCl-) are commonly used. However, some inhibitors have limitations, such as the toxicity of KCl, which according to the Environmental Protection Agency, cannot be used at concentrations higher than 5%. Other limitations include their impact on the rheology of drilling mud, cost (CHCsO2, C4H12NCl-), and their limited behaviour at high temperatures and pressures (NaCl). In this study, novel clay inhibitors for water-based drilling muds were characterized. A capillary suction timer (CST), a filtration time test, energy dispersive spectroscopy (EDS), and a scanning electron microscope (SEM) were used for the experiments. Testing was conducted on Na and Ca bentonite mixed with water-based drilling mud (WBDM) and commercial inhibitors, as well as novel inhibitors at 3%, 4%, and 5% concentrations.
Abbreviations
EDS: Energy Dispersion Spectroscopy; FTIR: Fourier Transform Infrared Spectroscopy; OBDM: Oil Based Drilling Mud; PV: Plastic Viscosity; RIR: Reference Intensity Ratio; SBDM: Synthetic Based Drilling Mud; SEM: Scanning Electronic Microscope; WBDM: Water Based Drilling Mud; WPPF: Whole Profile Pattern Fitting; XRD: X-Ray Diffraction Studies; YP: Yield Point.
Introduction
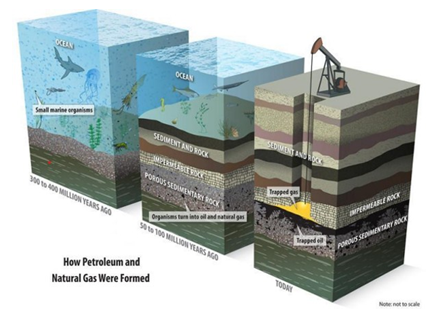
The petroleum industry has been the bedrock that has sustained the economies of numerous countries across the globe. The industry is the primary source of energy in the world today, and continues to create employment opportunities for millions of people [1]. With the continuous rise in energy consumption, the industry is driven to develop cutting-edge technologies that enable more efficient recovery of oil and gas from reservoirs [2]. Hydrocarbons are formed over a long period of time, under high pressures and high temperatures, from organic matter (particularly marine or swamp plants and animals that existed millions of years ago) in buried sedimentary rocks thousands of meters below the Earth’s surface [3, 4] as shown in Figure 1.
One of the essential materials utilized during the drilling of wells is the drilling fluid, which is also referred to as the lifeblood of the drilling process. The drilling fluid plays a pivotal role in determining the success or failure of the drilling operation [5]. The drilling fluids are used to perform various functions such as lubricate drill bits, manage hydro pressure, reduce fluid loss, transmit sensor reading, remove rock cutting, and inhibit swelling of reactive clay-based in reservoir formation [6, 7, 8, 9]. The three most common types of drilling fluids used in the petroleum industry are water- based drilling muds (WBDMs), oil-based drilling muds (OBDMs), and synthetic-based drilling fluids (SBDF) [5]. Some of the advantages OBDFs are: excellent inhibition, high-temperature stability, and remarkable lubricity, making them suitable for drilling through water-swellable clay formations [5, 10]. However, their use is restricted due to negative environmental impact (pollution) and high costs [9, 11].
SBDFs are an environmentally friendly alternative to OBDMs, particularly beneficial for deep-water and deviated hole drilling [12]. However, their environmental implications are not well understood, and very more costly compared to WBDM [2]. The most desirable type of drilling fluid used currently is water-based drilling fluids (WBDFs). Some of the advantages of WBDFs are that these are environmentally favorable, cost-effective, user-friendly, and have efficient rheological and drilling performance [13, 14], but have limitations such as instabilities when exposed to high temperatures, and swelling during and after drilling operations remains a major issue [2, 15]. The interaction of water-based muds and clays in the reservoir if not well understood and monitored during the drilling process can be detrimental to wellbore stability [15, 16]. In preparing the water-based fluid, one major component used is bentonite. Bentonite acts as a viscosities to increase the viscosity of the drilling fluids, enabling the suspension of cuttings in the mud during drilling operations [17]. Bentonite, also known as montmorillonite, contains a higher amount of minerals from the smectite group. When these minerals come into contact with water, their volume increases, causing swelling [18]. Bentonite exists in various types, depending on the dominant elements in their structure, such as calcium (Ca), potassium (K), aluminum (Al), or sodium (Na) [19].
Among the various types of bentonite, sodium bentonite (Na-bentonite) is predominantly used in the preparation of drilling fluids due to its desirable properties. Na-bentonite exhibits good dispersion stability, high swelling capacity, and outstanding rheological characteristics, making it well-suited for drilling fluid applications. In contrast, calcium bentonite (Ca-bentonite), although more abundant and cost-effective, suffers from low rheological properties and forms unstable suspensions with a high settling rate [6, 20]. However, the addition of other minerals, such as iron oxide (Fe2O3) and sodium carbonate (Na2CO3), to Ca-bentonite can enhance its rheological properties, enabling its use as a suspending agent in drilling fluid formulations [21]. The swelling of sodium bentonite when interacts with water can be minimized using chemical inhibitors (inorganic and organic). The inhibitors prevent water molecules from adsorbing onto clay minerals, thereby reducing their hydration [22]. A common type of conventional clay inhibitors used is inorganic salts which include Sodium Chloride (NaCl), Potassium Chloride (KCl), Calcium Chloride (CaCl2), Ammonium Chloride (NH4Cl), and divalent brine electrolyte solutions [23].
A thorough explanation of the physics of these inhibitors interactions with clay platelets was given by Weaver, et al. [24]. An octahedral layer of oxides and hydroxyls sur- rounding aluminium is sandwiched between two tetrahedral layers of oxides surrounding silicon in each platelet of montmorillonite. Because each platelet’s outer surface has a net negative charge, cationic stabilizers can be positioned in between the platelets. The stabilizer is very resistant to ion exchange because it is poly-ionic and binds to several locations on platelets. This prevents the clay from absorbing water and forces the platelets into a more stable shape. In recent years, the industry has witnessed the emergence of several types of non-conventional clay inhibitors [25]. These inhibitors are primarily derived from organic and inorganic sources, including ionic liquids (cations and anions) [26] surfactants (chemical and bio-based extracts) [6, 27], and nanomaterials [28]. While these commonly used commercial clay inhibitors offer potential benefits, they also present various drawbacks, as illustrated in Table 1.
| Clay Inhibitors | Disadvantages |
|---|---|
| Sodium Phosphate | Expensive |
| Ammonium Chloride | Temporary stabilization effect and difficulties in handling |
| Cesium Formate | Expensive |
| Potassium Chloride | Can cause formation damage and environmentally hazardous |
| Calcium Hydroxide | Chemical incompatibility with many formation waters |
| Sodium Chloride | Breakdown in HTHP environments and can cause fines migration |
| Tetramethylammonium Chloride | Expensive |
Table 1: Disadvantages of clay inhibitors used in the petroleum industry.
This paper presents an experimental analysis aimed at evaluating the effectiveness of commercially available clay swelling inhibitors. The inhibitors will undergo comprehensive testing, including linear swelling meter, capillary suction timer (CST), filtration time test, and dispersion test analyses. The study will compare the performance of the commercial inhibitors against a novel inhibitor developed. The commercial inhibitors evaluated in this study are designated as F1CHN-70, F2CHN-70, F3CHN-70, F4CHN-70, and INCH. To ensure a comprehensive evaluation, each inhibitor will be tested at three different concentration levels: 3%, 4%, and 5%. This approach will enable the researchers to study the concentration-dependent effects and determine the optimal concentration required for effective clay swelling inhibition under various conditions. The findings will contribute to the ongoing efforts in developing more effective and efficient clay swelling inhibition strategies, ultimately leading to improved drilling operations, reduced operational costs, and minimized environmental impacts.
Methodology
Bentonite Characterization
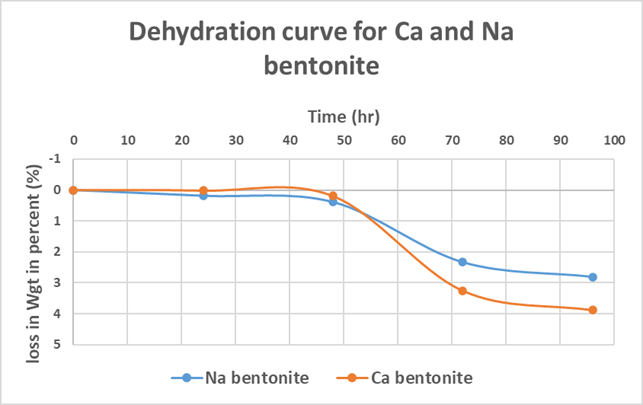
A Wyoming Na-bentonite and Ca-bentonite were acquired from a drilling fluids laboratory for experimental investigations. Dehydration curves were plotted for the Ca- bentonite and Na-bentonite samples to study the extent of water loss by the calcium and sodium bentonite samples as a function of increasing temperature. Firstly, the samples were weighed and subjected to drying in an oven for 24 hours at 50°C. Subsequently, the temperature was incrementally increased to 100°C, 150°C, 200°C, and 250°C, with the samples being held at each temperature for 24 hours, and the corresponding change in weight was recorded. To confirm the complete removal of water from the samples, Fourier- transform infrared spectroscopy (FTIR) analysis was conducted. The percentage of water loss at each temperature interval was calculated using the following formula:
*100% Ww Wd Ww −
Ww: Wet weight of bentonite Wd: Dry weight of bentonite after 24 hours The dehydration curves were then constructed by plotting the percentage of water loss against the time dried, enabling a comprehensive analysis of the dehydration behaviour of the Ca-bentonite and Na-bentonite samples.
X-Ray Diffraction Studies (XRD)
Mineralogical characterization of bulk samples was preceded by crushing representative samples to a homogeneous fine powder using a ball mill. The prepared samples were then loaded into the XRD machine and the mineralogical data were generated using the Rigaku MiniFlex 600 X-ray diffractometer instrument as shown in Figure 2.
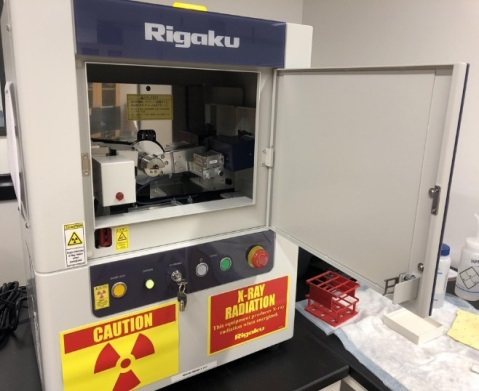
Scans were run over the range of 5°-85° with a scanning rate of 5° per minute. Phase identification and pattern matching of the diffraction patterns were completed using PDXL proprietary software by Rigaku and the International Center for Diffraction Data (ICDD) database. Whole Profile Pattern Fitting (WPPF) refinement calculations were applied using the same software to determine the optimal structural parameters of the phases present and to quantify mineral proportions.
Fourier Transform Infrared (FTIR) Spectroscopy
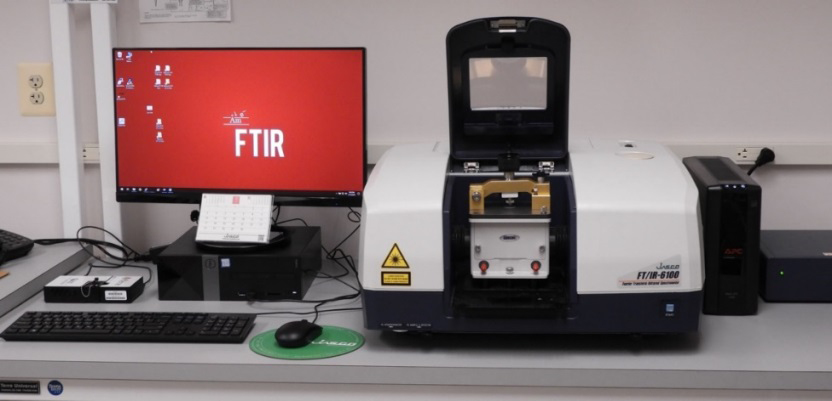
Fourier-transform infrared (FTIR) spectroscopy (Figure 3) was used in this study to perform dehydration analysis of Ca-bentonite and Na-bentonite samples. FTIR spectroscopy measures the absorption of infrared radiation by materials within the infrared range. The molecular composition and structure of a material determine its ability to absorb infrared light at specific wavelengths, creating a unique spectral fingerprint. In FTIR analysis, infrared radiation is passed through the sample, with some radiation being absorbed and the remainder transmitted. The resulting signal at the detector is a spectrum representing the molecular fingerprint of the sample. This signal is decoded using a mathematical technique called Fourier transformation, which creates a spectral mapping processed by a computer. The generated spectrum is then compared against a reference library for material identification. FTIR spectroscopy can be used for quantitative analysis of materials when a standard curve of known concentrations of the component of interest is available. This powerful technique enables the characterization of materials based on their unique spectral signatures, providing valuable insights into their molecular composition and structure.
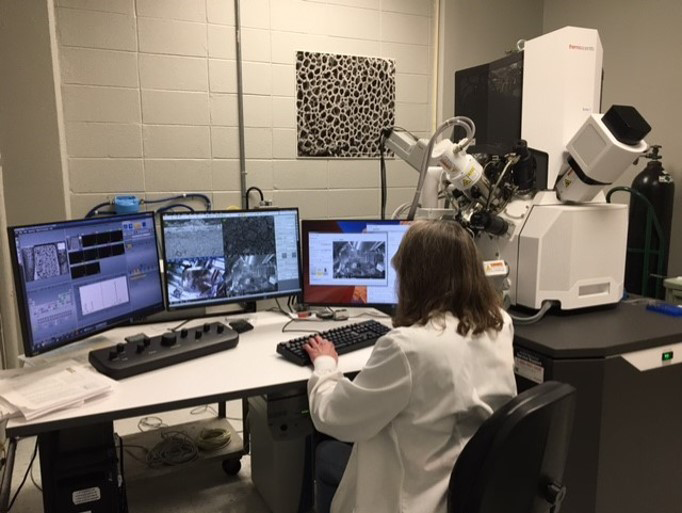
Scanning Electronic Microscope (SEM) and Energy Dispersive Spectroscopy (EDS)
The characterization of pores and embedded minerals in clay samples have been greatly aided by scanning electron microscopy (SEM) examination. SEM images are commonly used to determine the orientation, compaction, and texture of various clay surfaces. The majority of clay inhibition SEM examination findings analyses the phenomena of clay blockage and thin layer creation. Inhibitors enclose the pores, restricting the flow of drilling fluids into the pores, as in the case of water-based drilling fluids (WBDFs) and polymeric inhibition. An energy dispersive spectroscopy was conducted on the Ca and Na bentonite to check the elemental composition of the bentonites used for the experiment. The results from the EDS will show the quantitative amount of each of the minerals composed in the Ca and Na bentonite. The results from the EDS can be used to know the percentage of the smectite minerals composed in the bentonites (Figure 4).
Drilling Fluid
Water-based drilling fluid was prepared by X (name withheld for confidentiality reason). The drilling fluid did not contain any clay inhibitor or bentonite. The properties and components of the drilling fluid are listed in Table 2.
| Formulation | Mix 1 | ||
|---|---|---|---|
| Density | 1.04 | ||
| Barazan Dplus (US-LFT) | 2 lb/bbl | ||
| Broussard Tap Water (US- LFT) | 0.986 lb/bbl | ||
| Density | Mix#1 | ||
| Temperature , C | 22.5 | ||
| Temperature , F | 72.5 | ||
| Density [SG] | 1.03 | ||
| Density [ppg] | 8.58 | ||
| Rheology | |||
| Temperature , C | 21.1 | 48.9 | 65.6 |
| Temperature , F | 70 | 120 | 150 |
| 600 rpm | 42 | 38 | 36 |
| 300 rpm | 35 | 32 | 31 |
| 200 rpm | 31 | 30 | 28 |
| 100 rpm | 27 | 26 | 24 |
| 6 rpm | 18 | 16 | 14 |
| 3 rpm | 16 | 15 | 13 |
| 10 s Gel [lb/100ft2] | 19 | 17 | 15 |
| 10 min Gel [lb/100ft2] | 22 | 21 | 18 |
| 30 min Gel [lb/100ft2] | 23 | 21 | 18 |
| PV [cp] | 7 | 6 | 5 |
| YP [lb/100ft2] | 28 | 26 | 26 |
| YP [Pa] | 13.4 | 12.5 | 12.5 |
| LSRYP [lb/100ft2] | 14 | 14 | 12 |
| PH | Mix #1- Ageing #1 | ||
| pH | 8.06 | ||
| Temperature, C | 72.5 | ||
| Temperature, F | 22.5 |
Table 2: The components of the drilling fluid prepared by Halliburton, Broussard, USA.
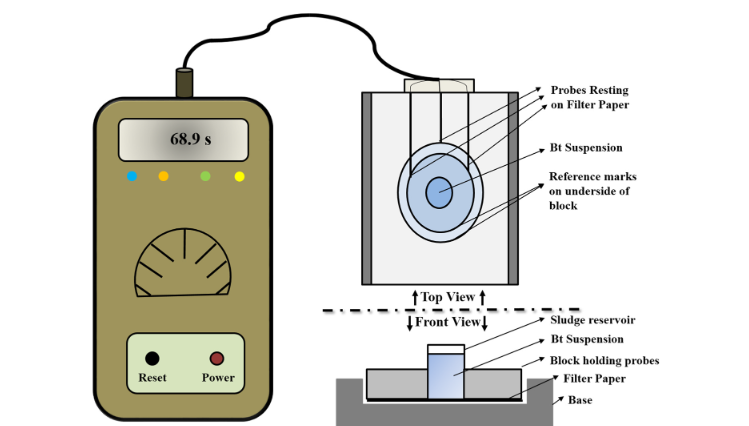
Capillary Suction Timer (CST)
The capillary suction timer (CST) tests offer a simple and rapid approach for obtaining relative information regarding the clay inhibition properties of additives. Numerous researchers have described the theory, practice, and limitations of CST tests. When evaluating various shale inhibitors, the capillary suction test (CST) is widely utilized. The CST analysis for this study was conducted using equipment as shown in Figure 5, which measures the time taken for a clay slurry to flow through a filter medium. The test procedure involves placing a 5 ml clay dispersion containing a specific inhibitor inside a cylinder. A timer and two electrodes positioned at 0.5 and 1 cm are connected to the cylinder containing a filter paper of predetermined thickness. The electrodes record the time it takes for the clay slurry to flow through the free water from one end to the other Muhammed, et al. [25]. An effective clay inhibitor will prevent the clay material from swelling, resulting in a higher proportion of free water, a more permeable filter cake, and a shorter CST time. Less effective clay stabilizers will lead to clay swelling, which absorbs free water, creating a relatively impermeable filter cake and a longer CST time interval. Adherence to standardized sample preparation and test protocols can produce consistent findings in the evaluation of numerous clay stabilizers. However, it is important to note that the CST method sometimes tends to overestimate the sensitivity of test materials or formations to treatment fluids, which can be considered a limitation of this technique.
Filtration Time Test
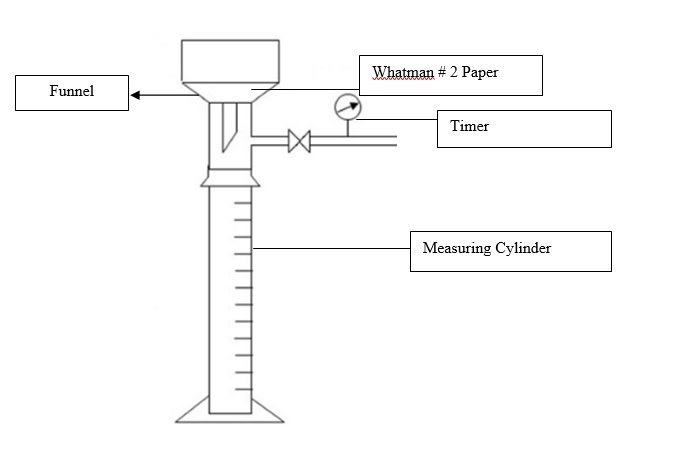
A filtration time test experiment was conducted for the Na and Ca bentonite 5%, 4%, and 3% concentrate of the commercial inhibitors and novel inhibitors. The amount of filtrates that filters through the Whatman #2 paper shows if the clay inhibitor is inhibiting the clay from swelling (Figure 6). The procedure for the experimentation is below:
- 50 ml of water is measured and mixed with 2.5 g of Ca and Na bentonite. Percentage 3% (1.575 grams), 4% (2.1 gram) and 5% (2.625 grams) concentration to be used.
- Put the water into a beaker and slowly add the inhibitor while the mixture is being stirred on a magnetic stirring machine allowing the Na or Ca bentonite to be completely hydrated.
- Add the clay inhibitor to the mixture slowly and allow the mixture to mix for about 15 minutes to ensure the bentonite is completely hydrated.
- Set up the Filtration time test apparatus as shown in Figure 6 and slowly pour the mixture into Whatman #2 filter paper. Measure the amount of liquid that has been filtered through the filter paper after 2.5, 5 , 10, 15, 20, 25, and 30 minutes.
- The experiment is also conducted following the procedure above without the addition of inhibitors to serve as a baseline for the experimentation.
Results and Discussion
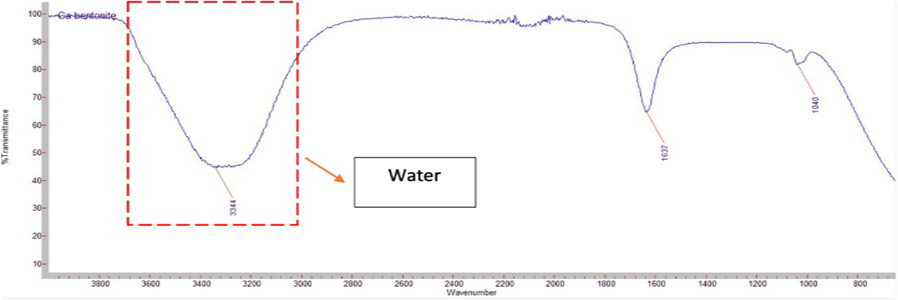
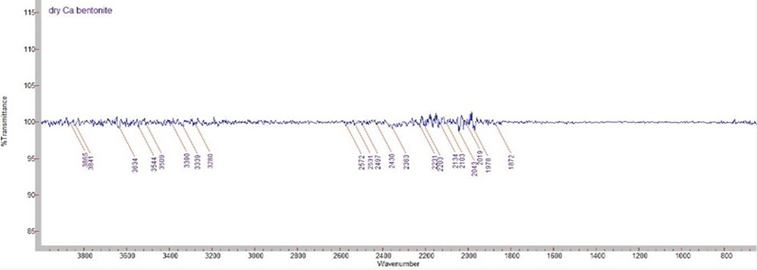
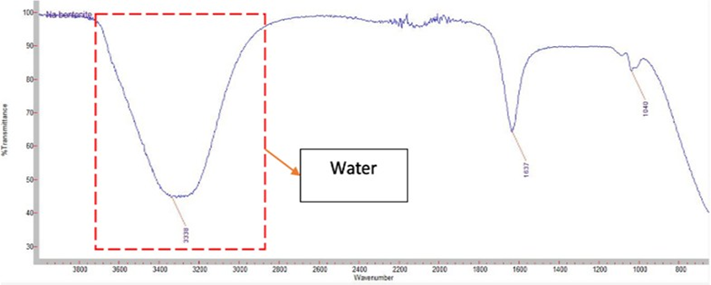
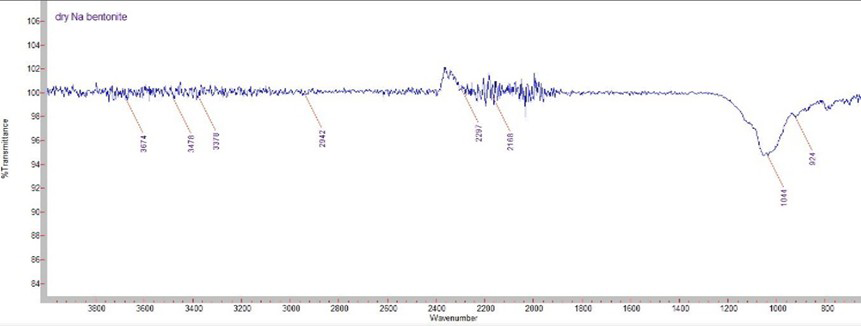
To ensure that the bentonites samples that were used in the experimentation was completely dry a Fourier Transform Infrared (FTIR) spectroscopy was used to conduct testing on the bentonite samples before and after drying. The results shows that while both Na and Ca bentonites lost a small amount of water after 24 hours of drying at 50 C as shown in Figure 7, the samples lost a greater amount of water when heated to 150 C for 24 hours and to 250 C for 24 hours. The purpose of this experimentation was to know the temperature to dry the bentonites to ensure that the bentonites are completely without damaging the mineralogical properties of the bentonites. The presence of water in the bentonite samples can also affect the results of some experimentation such as CST and filtration time tests. After drying, infrared radiation tests (FTIR) were performed on the dried bentonite samples to confirm that the bentonite samples used in the experiment (filtration. Time test and CST) were dry.
The results from the Ca and Na bentonite before drying shows a presence of water in the samples (Figures 8-11). The transmittance percentage of 3700 to 2900 shows the presence of water in the sample. If there is a high amount of water in the bentonite sample used in the experimentation it can affect the results of the CST and filtration time test. On the other hand, if the samples are too dry, it affects the linear swelling meter test through osmosis. Using the Aqua- lab drew activity meter the water activity of the type 2 shale sample used for the dispersion test was measured.
X-Ray Diffraction Studies (XRD)
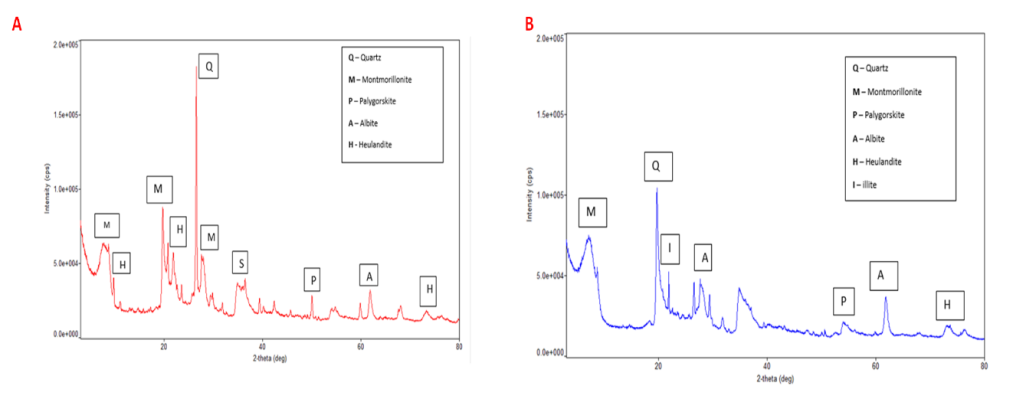
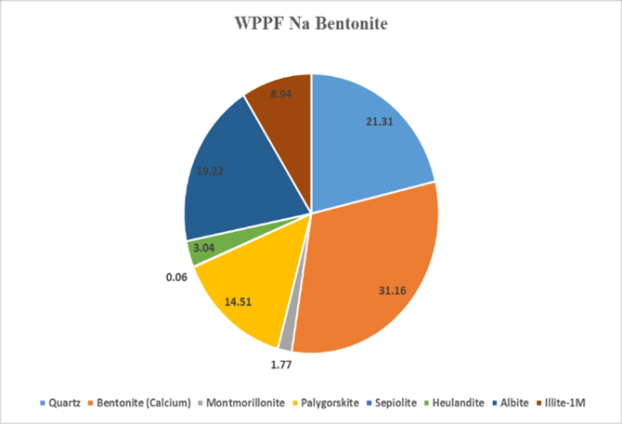
The X-ray diffraction (XRD) results showed that Na-
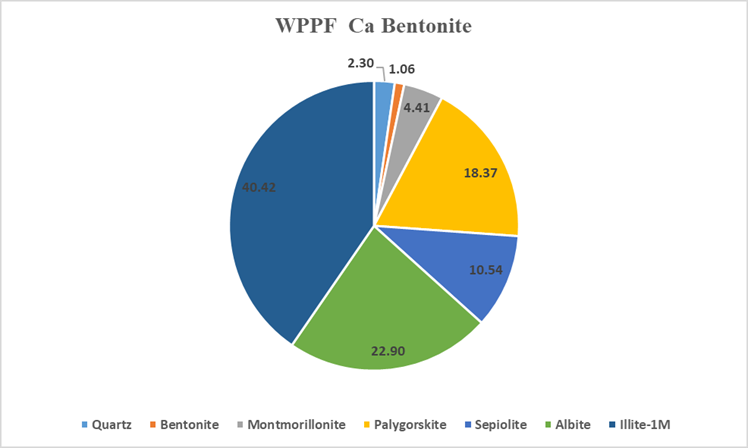
bentonite primarily consisted of quartz and montmorillonite as major constituent minerals (Figures 12,13). Additionally, the presence of smectite minerals such as heulandite, sepiolite, and palygorskite contributes to the swelling properties of the clay. These phyllosilicate minerals undergo cationic exchanges in their structure when they interact with water [29]. Sepiolite and Palygorskite are minerals that form as alternatives to smectite under mild conditions. In montmorillonite, a negatively charged octahedral layer of silica, aluminum, and oxygen is sandwiched between two tetrahedral layers (TOT sheet), with positive counter cations occupying the interlayer space. As water enters this interlayer space, the cations become hydrated, causing the clay to swell [30]. The XRD analysis showed similarities between Ca-bentonite and Na-bentonite. The primary difference in composition was the higher quartz content and lower smectite mineral content (sepiolite, heulandite, palygorskite) in Ca-bentonite. As explained by Gao, et al. [31], smectite minerals are responsible for clay swelling, and their higher abundance in clay enhances this property. Furthermore, Ca-bentonite exhibited a high presence of illite minerals (Figure 14).
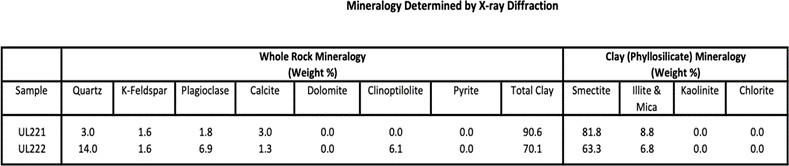
Further SEM analysis was conducted at Core Lab, where UL 221 represents Ca-bentonite and UL22 represents Na- bentonite. The results indicated that Ca-bentonite had a smectite (Palygorskite, Sepiolite, Albite, and Montmorillonite) content of 81.8%, while Na-bentonite showed a content of 63.3%, as illustrated in Figure 15. These findings were consistent with the XRD characterization performed in the University of Louisiana at Lafayette laboratories, showing minimal discrepancies between the two analyses.
Energy Dispersive Spectroscopy (EDS)
To determine the elemental composition of the bentonites (Ca and Na), samples were coated with layers of carbon, and energy-dispersive spectrometry was performed.
Results from Table 3 show high peaks for Silicon and Oxygen, with atomic percentages of 59.18 and 19.89, respectively. These two elements are common in phyllosilicate minerals and form the tetrahedral structure of clay (Figure 16).
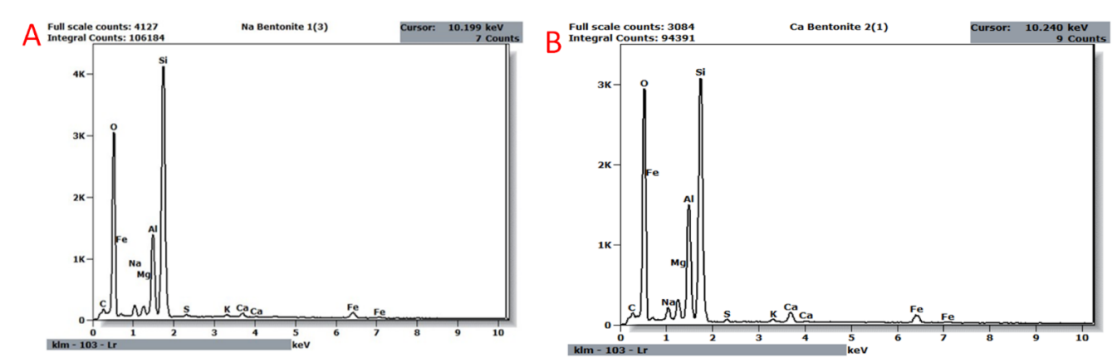
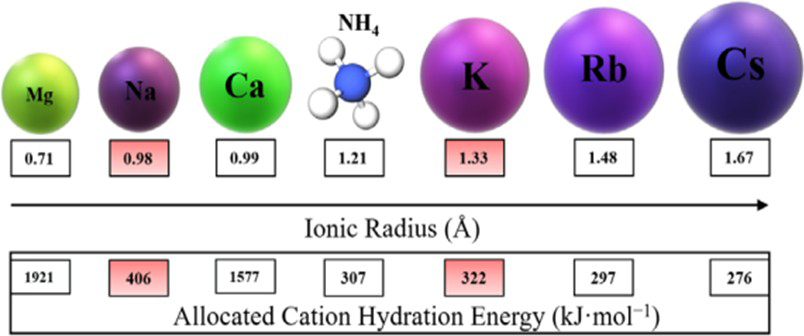
Table 3 show the presence of Iron, Aluminum, and Magnesium, with atomic percentages of 1.28, 5.80, and 0.81, respectively. The presence of all these minerals is consistent with Brigatti, et al.’s [32] explanation that when tetrahedral and octahedral sheets join to form a layer, either a neutral or negatively charged structure results. Results for Ca-bentonite were similar to Na-bentonite; however, a higher atomic percentage of Calcium was observed in the Ca- bentonite structure. This higher Calcium presence explains why Ca-bentonites are not as absorbent when in contact with water in the crystal structure. Sawhney [33] explained this phenomenon using ionic radii and cation hydration energy. Na has an ionic radius of 0.98 and hydration energy of 406 kJ mol⁻¹, while Ca has a radius of 0.99 and hydration energy of 1577 kJ mol⁻¹. The higher hydration energy of Calcium reduces water absorption and swelling due to stronger hydrogen bonding compared to sodium bentonites.
| Element | Weight % | Atom % | ||
|---|---|---|---|---|
| Na Bentonite | Ca Bentonite | Na Bentonite | Ca Bentonite | |
| C | 6.65 | 6.08 | 10.78 | 9.86 |
| O | 48.57 | 49.73 | 59.14 | 60.61 |
| Na | 1.67 | 1.66 | 1.41 | 1.41 |
| Mg | 1.01 | 1.97 | 0.81 | 1.58 |
| Al | 8.04 | 10.04 | 5.8 | 7.25 |
| Si | 28.68 | 24.01 | 19.89 | 16.67 |
| S | 0.39 | 0.27 | 0.24 | 0.16 |
| K | 0.43 | 0.33 | 0.21 | 0.16 |
| Ca | 0.91 | 1.58 | 0.44 | 0.77 |
| Fe | 3.66 | 4.34 | 1.28 | 1.51 |
| Total | 100 | 100 | 100 | 100 |
Table 3: Eds quantitative measure of the elemental composition of Na and Ca bentonite.
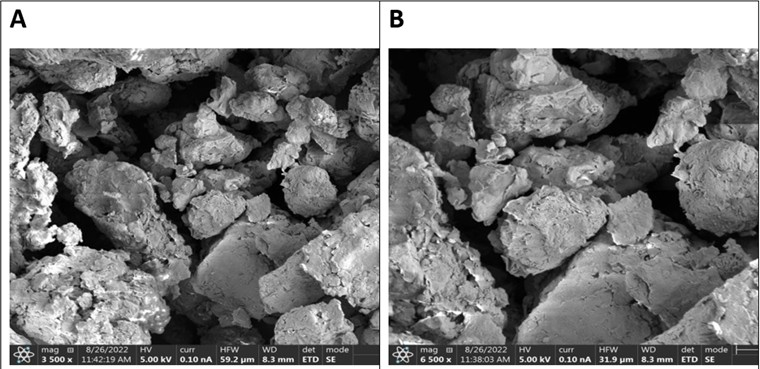
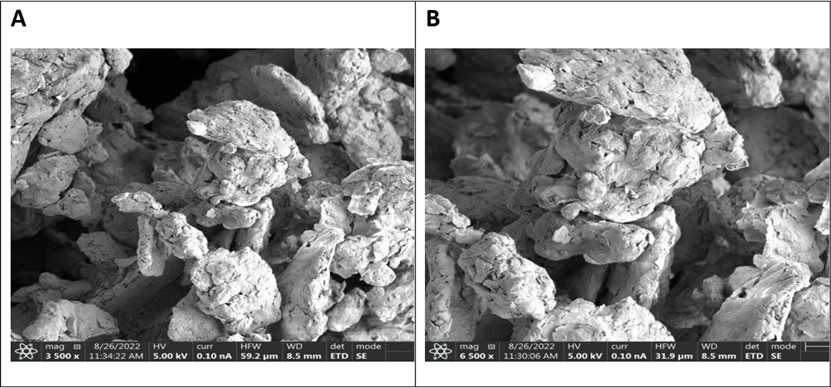
Scanning Electronic Microscope (SEM)
The surface properties and morphology of the Ca and Na bentonites under investigation were examined using SEM methods. The samples were put on the stub, which had gold conducting layers sputter-coated over it. The Ca and Na bentonites surfaces were examined at 3500 and 6500 magnifications. A description of the bentonite samples used in this study can be found in Figures 17 & 18. Ca bentonites have perfectly oriented platelets as compared to Na bentonites. The spaces between the particles in the Ca bentonite are also wider than those in the Na bentonite, as shown in Figures 18. SEM of sodium bentonites (Figure 17) shows that the Na bentonites are more loose while the Ca bentonites (Figure 18) are more compacted. This explains why the sodium bentonites were good adsorbent of water than the Calcium bentonite
Capillary Suction Timer Test
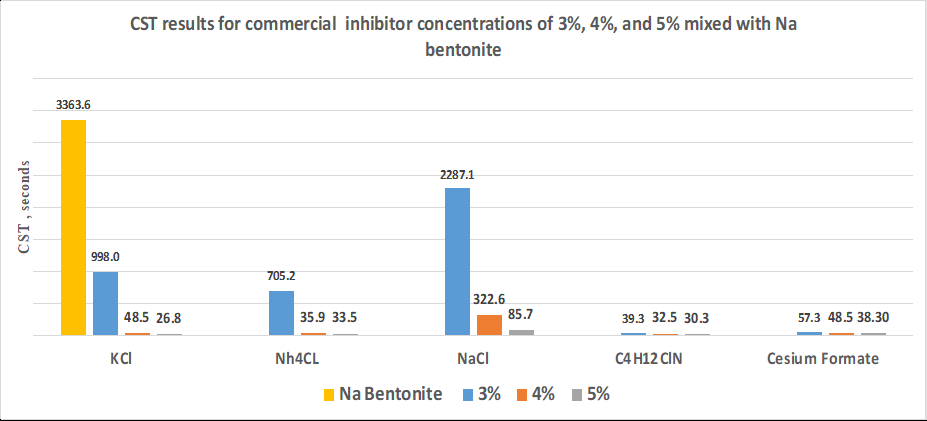
For the clay inhibitors produced 3%, 4%, and 5% concentrations of F4CHN-70 gave the best results when tested on the Na bentonite clay as shown in Figures 19 & 20. The CST time decreased from 3363.6 without inhibitor to 38.6 seconds at 3% concentration to 30.6 seconds at 4% concentration and 25.3 seconds as shown in Figure 19 at 5% concentration of F4CHN-70, demonstrating that the clay inhibitor inhibited the Na bentonite from absorbing water. The inhibition performance of F3CHN-70 was similar to the F4CHN-70 at the 3%, 4% and 5 percent concentration. Though the F2CHN70 and INCH inhibition performance was not as good as the F4CHN-70 and F3CHN-70, they both performed better than the KCl. The average inhibition times for these inhibitors were 170 seconds for 3% concentration which was 351.1 seconds lesser than the inhibition time of KCl. The F1CHN-70 showed the least inhibition performance with the produced clay inhibitors. It was observed that for good inhibition performance of the F1CHN-70 higher concentrations has to be used.
3363.6
The CST time was lowered with potassium chloride from 193.4 without the inhibitor to 34.2 seconds for 3 % but was significantly reduced with the 4% and 5% concentrations, respectively, by 29.2 seconds and 23.6 seconds. There was no significant difference in the time for the concentrations for the commercial clay inhibitors. NaCl produced the least reaction time for the commercial inhibitors however the results was similar to the Tetramethylammonium Chloride as shown in Figure 21. Compared to the Na bentonite, the swelling rate of the Ca bentonite was lower the inhibition time without the inhibitor was lower in the Ca bentonite. The Ca bentonite produced a time of 193.4 seconds whiles the Na bentonite produced a time of 3363.6. This indicates that the Na bentonite has a high swelling ability than the Ca bentonite. This phenomenon can be explained using the ionic radius and hydration energy of the of the Ca and Na elements.
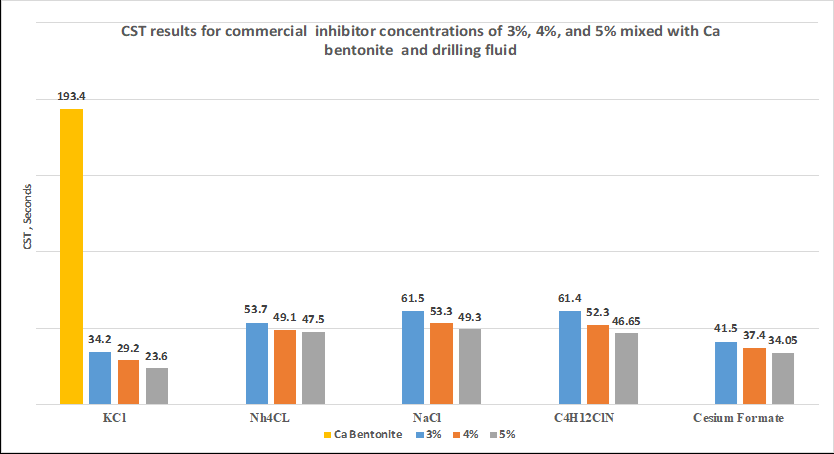
The Na bentonite has 0.98 ionic radius, and 408 hydration energy whiles Ca has 0.99 ionic radius and 1577 hydration energy as shown in Figure 22. Since the hydration energy of Na is low it makes is very volatile than Ca bentonite.
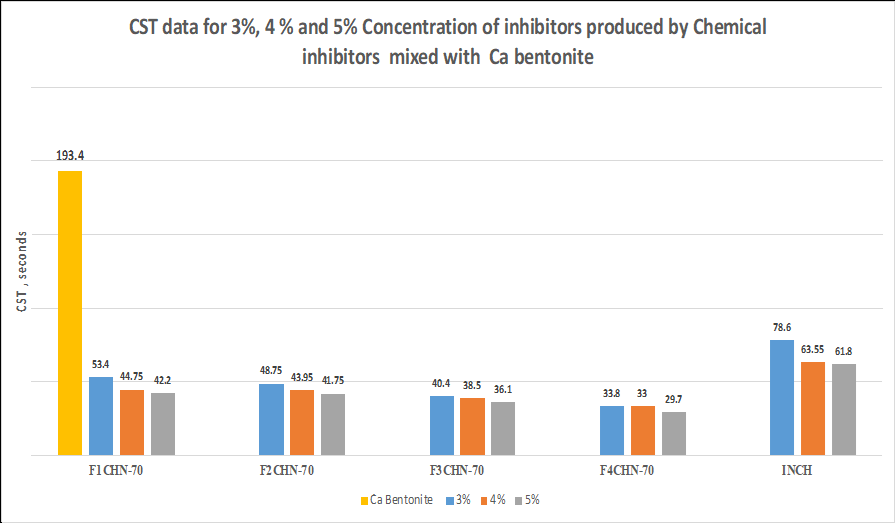
In comparison to the other inhibitors produced, F4CN -70 generated the best CST time as shown in Figure 23. In contrary to when the Na bentonite was combined with inhibitors, the data did not demonstrate a significant difference in time for the concentrations.5% concentration of the F4CHN-70 reduced the CST time of the Ca bentonite to 29.7 seconds, the least responsive Inhibitor to the CST was INCH. For 3%, 4%, and 5% concentrations, the time produced was 78.6 seconds, 63.55 seconds, and 61.8 seconds, respectively. This demonstrates that, unlike the F4CHN-70, the INCH did not prevent the clay from absorbing water. The results for the other inhibitors (F1CHN-70, F2CHN-70 and F3CHN-70) were similar with each other. These inhibitors reduced the CST time of Ca bentonite to more than half of the for the 5 % concentration but did not perform as better as the F2CHN-70.
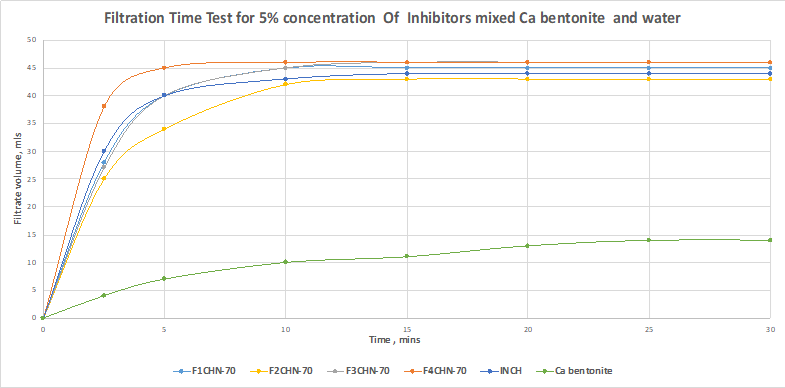
Filtration Time Test
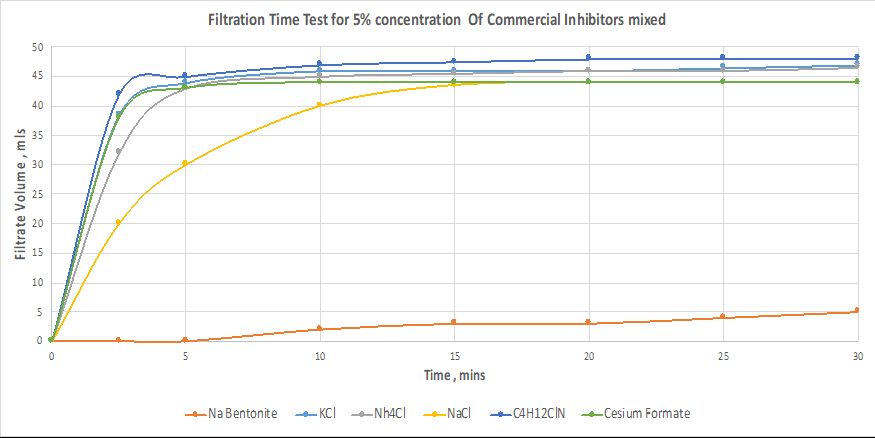
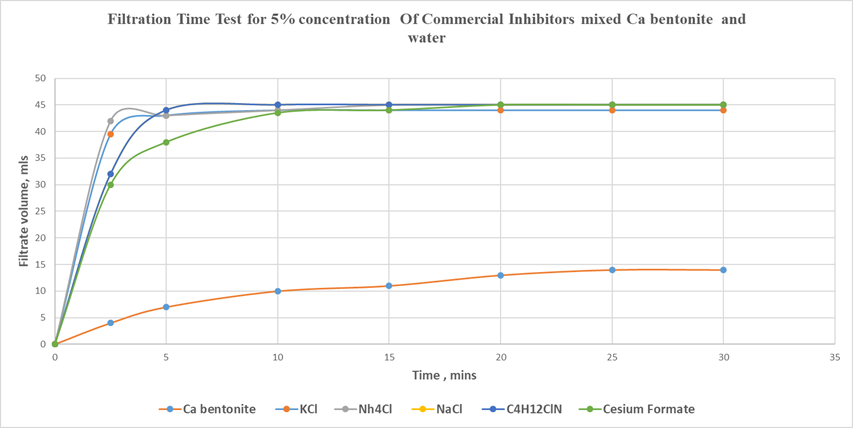
The results of the filtration time test shows that in 5 minutes, a mixture of Na bentonite with water produced a filtrate volume of 15 ml of the 50 ml of water that was used for the experiment as shown in Figure 24. This demonstrates the strong absorptive capacity if the Na bentonite clay. Figure 25 shows that Ca bentonite has low absorptivity when reacting with water compared to the Na bentonite. However, the filtering rate for the commercial inhibitors was greater in the calcium bentonite than in the sodium bentonite, with KCl producing the best outcomes for both Ca and Na bentonites. About 90 % of the water used had filtered through the Whatman #2 paper in 5 minutes, this shows that the Na bentonite’s ability to absorb more water into its structure was inhibited by the KCl. The least performing of all the commercial inhibitors used for the experimentation was the NaCl. The inhibition performance was low in the Na bentonite than the Ca bentonite. The Tetramethylene Ammonium Chloride and the Cesium Formate showed a similar result for the Na bentonite and Ca bentonite.
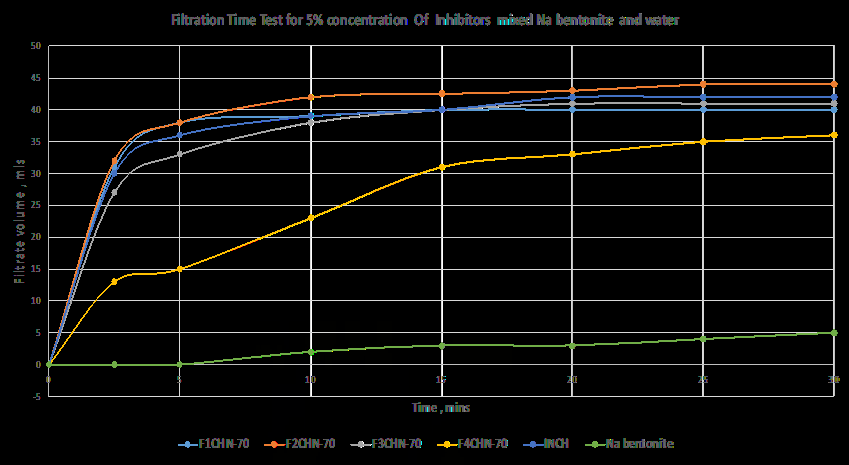
The results of the 5% concentration of the inhibitors shows the F4CHN-70 performing better inhibition than the other inhibitors.38 ml of the 50 ml of water used for the experiment had filtered through the Whatman #2 paper in 5 minutes compared to the blank (Na bentonite mixed with water without inhibitor) that had only 5 ml of the 50 ml of water filtered through the filter paper after 5 minutes as shown in Figure 26. The F4CHN-70 filtered 43 ml of the 50 ml water within the experimentation time as shown in Figure 26 and Figure 27. This is a good indication that the inhibitor is preventing the clay from absorbing water hence preventing swelling. F2CHN-70 gave the poorest inhibition compared to the other inhibitors. Only 15 ml of the 50 ml of water used was filtered through the filter paper in five minutes. The Na bentonite retained 15 ml of water used during the experimentation. This clearly shows that the was a poor inhibition from the F2CHN-70.
Conclusion
The study evaluated various commercial inhibitors for their effectiveness in reducing clay swelling, an important issue in drilling operations and other applications involving clay-rich formations. Our findings reveal important variations in inhibitor performance, dependent on both the type of inhibitor and the specific clay mineralogy. Among the commercial inhibitors tested, Tetramethylammonium Chloride and Cesium Formate demonstrated superior performance in both the Capillary Suction Timer (CST) test and the Filtration Time test. The effectiveness of Tetramethylammonium Chloride can be attributed to its ability to replace exchangeable cations in the clay structure, thereby reducing the clay’s affinity for water and limiting swelling. Cesium Formate’s efficacy stems from the large size of the cesium ion, which can effectively block water from entering the interlayer spaces of clay minerals, thus preventing swelling. Interestingly, our results indicated that common salts such as sodium chloride (NaCl) and potassium chloride (KCl) required higher concentrations to achieve satisfactory inhibition performance. This suggests that these salts may be less efficient at lower concentrations compared to other inhibitors tested. The mechanism here is likely related to the osmotic effect, where higher salt concentrations are needed to create a sufficient chemical potential difference to prevent water from entering the clay structure [34]. This observation underscores the importance of considering inhibitor concentration in addition to inhibitor type when designing drilling fluids or other applications requiring clay stabilization.
The filtration time test results revealed that two specific inhibitors, F4CHN-70 and F3CN-70, exhibited the most effective inhibition performance when used with sodium bentonite (Na-bentonite). The superior performance of these inhibitors may be attributed to two potential mechanisms: (1) direct reduction of clay swelling through ion exchange or interlayer spacing modification, and (2) formation of a protective film or shell around clay particles, which could prevent water from interacting with the clay surface. This film formation mechanism is notable as it represents a different approach to swelling inhibition compared to direct modification of the clay structure, as previously stated by Sun et al. [35]. Our study also revealed that F4CHN-70 demonstrated more effective swelling inhibition performance when used with Na-bentonite compared to Ca-bentonite. This difference highlights the importance of selecting appropriate inhibitors based on the specific type of clay present in the formation. The reasons for this difference may include variations in the cation exchange capacity between Na- bentonite and Ca-bentonite, affecting the inhibitor’s ability to interact with the clay structure [36], and differences in the initial interlayer spacing of Na-bentonite and Ca- bentonite, influencing the inhibitor’s ability to intercalate and prevent further expansion [7].
Acknowledgment
The authors would like to Thank Dr. Nelson Chavez of the University of Louisiana Lafayette for inventing the novel inhibitor and his immersed contribution to make this research come to light. I would also want to thank Mr. Carlos Rodriguez and Besmir Buranaj of Baker Hughes Texas for allowing me to Perform some experimentation at their laboratory.
References
-
Molina A, Mendoza A, Lozano FJ, Serra-Barragán L, Ibarra-Yunez A (2022) Historical Context and Present Energy Use in the Global Economy. Energy Issues and Transition to a Low Carbon Economy, pp: 1-29.
-
Zhong H, Qiu Z, Huang W, Cao J (2012) Poly (oxypropylene)-amidoamine mod- ified bentonite as potential shale inhibitor in water-based drilling fluids. Applied Clay Science 67-68: 36-43.
-
Bommer PM (2008) A Primer of Oilwell Drilling. 7th(Edn.), University of Texas at Austin, Austin, pp: 1-241.
-
Nolan DP (2014) Handbook of fire and explosion protection engineering principles: for oil, gas, chemical and related facilities. 3rd(Edn.), William Andrew, pp: 496.
-
Agwu OE, Okon AN, Udoh FD (2015) A Comparative Study of Diesel Oil and Soybean Oil as Oil-Based Drilling Mud. Journal of Petroleum Engineering 2015: 1-10.
-
Ahmadi MA, Shadizadeh SR, Shah K, Bahadori A (2018) An accurate model to predict drilling fluid density at wellbore condition. Egyptian Journal of Petroleum 27(1): 1-10.
-
Anderson RL, Ratcliffe I, Greenwell HC, Williams PA, Cliffe S, et al. (2010) Clay swelling-a challenge in the oilfield. Earth-Science Reviews 98(3-4): 201-216.
-
Ghavami M, Hasanzadeh B, Zhao Q, Javadi S, Kebria DY (2018) Experimental study on microstructure and rheological behavior of organobentonite/oil-based drilling fluid. Journal of Molecular Liquids 263: 147-157.
-
Murtaza M, Kamal MS, Hussain SMS, Mahmoud M, Syed NA (2020) Quaternary ammonium gemini surfactants having different spacer length as clay swelling inhibitors: Mechanism and performance evaluation. Journal of Molecular Liquids 308: 113054.
-
Rojas JC, Clark DE, Greene B, Zhang J (2006) Optimized salinity delivers improved drilling performance. AADE Drilling Fluids Technical Conference, pp: 1-13.
-
Seyedmohammadi J (2017) The effects of drilling fluids and environment protection from pollutants using some models. Modeling Earth Systems and Environment 3(1).
-
Melton HR, Smith JP, Mairs HL, Bernier RF, Garland E, et al. (2004) Environmental aspects of the use and disposal of non-aqueous drilling fluids associated with offshore oil & gas operations. SPE International Conference on Health, Safety, and Environment in Oil and Gas Exploration and Production, Calgary, Alberta, Canada, Paper Number: SPE-86696-MS.
-
Attia M, Elsorafy W, D’Angelo S (2010) New engineered approach to replace oilbased fluids with high performance water-based fluids in Mediterranean sea. North Africa Technical Conference and Exhibition, Cairo, Egypt, Paper Number: SPE-127826-MS.
-
Du W, Wang X, Chen G, Zhang J, Slaný M (2020) Synthesis, property and mechanism analysis of a novel polyhydroxy organic amine shale hydration inhibitor. Minerals 10(2): 128.
-
Tehrani MA, Popplestone A, Guarneri A, Carminati S (2007) A water-based drilling fluid for HT/HP applications. International Symposium on Oil Field Chemistry Held, Houston, Texas, USA, Paper Number: SPE-105485-MS.
-
Salles F, Douillard JM, Denoyel R, Bildstein O, Jullien M, et al. (2009) Hydration sequence of swelling clays: evolutions of specific surface area and hydration energy. J Colloid Interface Sci 333(2): 510-522.
-
ASME (2005) Drilling fluids processing handbook. Gulf Publishing, pp: 594.
-
Alsabaa A, Gamal H, Elkatatny S, Abdulraheem A (2020) Real-time prediction of rheological properties of invert emulsion mud using adaptive neuro-fuzzy inference system. Sensors 20(6): 1669.
-
Ghaedi M (2021) Fundamental Processes and Applications.
-
Li J, Zhang G, Li G, Huang Z, Li W (2018) A Method to Double the Extension Ability of Radial Jet Drilling Technology. Journal of Energy Resources Technology 140(9): 093102.
-
Amer M, Al-Bidry MA, Alwasiti A (2022) Calcium bentonite based drilling mud with NaOH and Na2CO3 additives to improve the laboratory simulated cleaning process. Petroleum Science and Technology 40(23): 2925-2941.
-
Balaban RC, Vidal ELF, Borges MR (2015) Design of experiments to evaluate clay swelling inhibition by different combinations of organic compounds and inorganic salts for application in water base drilling fluids. Applied Clay Science 105-106: 124-130.
-
Ahmed HM, Kamal MS, Al-Harthi M (2019) Polymeric and low molecular weight shale inhibitors: A review. Fuel 251: 187-217.
-
Weaver JD, Nguyen PD, Loghry RA (2011) Stabilizing Fracture Faces in Water-Sensitive Shale Formations. SPE Eastern Regional Meeting, Columbus, Ohio, USA, Paper Number: SPE-149218-MS.
-
Muhammed NS, Olayiwola T, Elkatatny S (2021) A review on clay chemistry, characterization and shale inhibitors for water-based drilling fluids. Journal of Petroleum Science and Engineering 206: 109043.
-
Yuan G, Cao Y, Schulz HM, Hao F, Gluyas J, et al. (2019) A review of feldspar alteration and its geological significance in sedimentary basins: From shallow aquifers to deep hydrocarbon reservoirs. Earth-Science Reviews 191: 114-140.
-
Quainoo AK, Negash BM, Bavoh CB, Ganat TO, Tackie-Otoo BN (2020) A perspective on the potential application of bio-inhibitors for shale stabilization during drilling and hydraulic fracturing processes. Journal of Natural Gas Science and Engineering 79: 103380.
-
Lv K, Huang P, Zhou Z, Wei X, Luo Q, et al. (2020) Study of Janus Amphiphilic Graphene Oxide as a High-Performance Shale Inhibitor and Its Inhibition Mechanism. Frontiers in Chemistry 8: 1-9.
-
Norrish K (1954) The swelling of montmorillonite. Discussions of the Faraday society 18: 120-134.
-
Mahmoud O, Nasr-El-Din HA, Vryzas Z, Kelessidis VC (2018) Effect of ferric oxide nanoparticles on the properties of filter cake formed by calcium bentonite- based drilling muds. SPE Drilling and Completion 33(4): 363-376.
-
Gao Y, Wang Y, Chen C, Zhou J, Cheng Y, et al. (2022) Preparation of Montmo- rillonite Nanosheets with a High Aspect Ratio through Heating/Rehydrating and Gas- Pushing Exfoliation. Langmuir 38(34): 10520-10529.
-
Brigatti MF, Galán E, Theng BKG (2013) Structure and Mineralogy of Clay Minerals. Developments in Clay Science 5: 21-81.
-
Sawhney BL (1972) Selective Sorption and Fixation of Cations by Clay Minerals: A Review. Clays and Clay Minerals 20(2): 93-100.
-
Amorim CLG, Lopes RT, Barroso RC, Queiroz J, Alves DB, et al. (2007) Effect of clay-water interactions on clay swelling by X-ray diffraction. Nuclear Instruments and Methods in Physics Research Section A: Accelerators, Spectrometers, Detectors and Associated Equipment 580(1): 768-770.
-
Sun J, Zhang F, Lv K, Chang X (2019) A novel film-forming silicone polymer as shale inhibitor for water-based drilling fluids. e-Polymers 19(1): 574-578.
-
Hensen EJ, Smit B (2002) Why clays swell. The Journal of Physical Chemistry B 106(49): 12664-12667.
- Nigeria’s Vulnerability in the Face of Global Energy Policy
- A Simulation Study of Investigation of Optimum Oil Production Performance by Applying Various Gas Injection Methods in Oil Reservoir
- Characterization of Permo-Triassic Reservoirs through Thermal Maturity Assessment of Westphalian Source Rocks in the Cheshire Basin
- Influence of Microwax on the Rheological and Thermal Behaviour of a Wax Crude Oil
- Real-Time Monitoring and Performance Optimization of Steam Injection in Heavy Oil Reservoirs Using Fiber Optic Sensing and Integrated Predictive Simulation Models
- Rapid On-Site Determination of the Total Petroleum Hydrocarbon Content of Soils by Handheld Fourier Transform Near-Infrared Spectroscopy: Development of a Global, Site- and Scanner- Independent Calibration Model