Increasing Number of Fractions in the Case of Non-Uniform Dose and Fixed Nominal BED Leads to Increased Cell Killing in the Treatment Target
Purpose: To evaluate how heterogeneity of the target dose affects cell survival in the target and biologically effective dose (BED) depending on the number of fractions ( ). Methods: Effect of dose non-uniformity on the probability of cell survival in the target volume is studied by using the linearquadratic model. In this work we compare cell killing for different fractionation schedules under the assumption that the nominal biologically effective dose is fixed. Results: It is theoretically shown that in the case the probability of cell survival in the target decreases with increasing for an arbitrary ratio , where denote variance and mean of the target dose, respectively. This result is valid for an arbitrary distribution of the target dose. To demonstrate dependence of BED on and , we computed BEDs by using DVHs for 57 clinical cases of early-stage, non-small cell lung cancer. The computed BEDs demonstrate potential increase in cell kill for the considered cases when is increased from 5 to 20 for a fixed . Conclusion: Small variations in the target dose (i.e., ) can significantly reduce BED in Stereotactic body radiation therapy (SBRT) and stereotactic radiosurgery (SRS). The magnitude of decrease in BED can be reduced by increasing . The obtained results indicate that moderate hypo fractionation with can yield higher BED as compared to the frequently used SBRT schedules with five or fewer fractions.
VY Kuperman1* and GS Spradlin2
1Florida Cancer Specialists & Research Institute, USA
2Department of Mathematics, Embry-Riddle University, USA
*Corresponding author: Vadim Y Kuperman, Florida Cancer Specialists & Research Institute, 7651 Medical Drive, Hudson, USA 34667, USA, Tel: (813) 300-0514; Email: vadimkuperman@yahoo.com
Abstract
Purpose: To evaluate how heterogeneity of the target dose affects cell survival in the target and biologically effective dose (BED) depending on the number of fractions ($N_f$).
Methods: Effect of dose non-uniformity on the probability of cell survival in the target volume is studied by using the linear-quadratic model. In this work we compare cell killing for different fractionation schedules under the assumption that the nominal biologically effective dose ($BED_{nom}$) is fixed.
Results: It is theoretically shown that in the case $BED_{nom} = const$ the probability of cell survival in the target decreases with increasing $N_f$ for an arbitrary ratio $\sigma/\bar{D}$ where $\sigma$ and $\bar{D}$ denote variance and mean of the target dose, respectively. This result is valid for an arbitrary distribution of the target dose. To demonstrate dependence of BED on $N_f$ and $\sigma/\bar{D}$, we computed BEDs by using DVHs for 57 clinical cases of early-stage, non-small cell lung cancer. The computed BEDs demonstrate potential increase in cell kill for the considered cases when $N_f$ is increased from 5 to 20 for a fixed $BED_{nom}$.
Conclusion: Small variations in the target dose (i.e., $\sigma/\bar{D} \leq 0.1$) can significantly reduce BED in Stereotactic body radiation therapy (SBRT) and stereotactic radiosurgery (SRS). The magnitude of decrease in BED can be reduced by increasing $N_f$. The obtained results indicate that moderate hypofractionation with $N_f = 15-20$ can yield higher BED as compared to the frequently used SBRT schedules with five or fewer fractions.
Keywords: Heterogeneous Target Dose; BED; Hypofractionation; SBRT
Abbreviations
TCP: Tumor Control Probability; LQ: Linear-quadratic; BED: Biologically Effective Dose; MU: Monitor Units; PTV: Planning Target Volume.
Introduction
Since the studies by Webb and Nahum [1], Webb, et al. [2], it has been established that uniform dose maximizes tumor control probability (TCP) if average dose in the target volume is fixed. According to a prior study by Brahme [3], heterogeneity of the target dose (measured by its standard deviation) should be within 3-5% of the mean dose to attain acceptable treatment outcome. The conclusions of the above-mentioned studies were obtained by using the linear-quadratic model (LQ) for cell killing by radiation [4, 5]. In the LQ model the probability of survival ($S$) is a function of several parameters including target dose, radiosensitivity of irradiated cells and number of fractions ($N_f$) (e.g., see [5, 6]). To compare different fractionation regimens in the LQ framework, one can use biologically effective dose (BED). When the target dose $D$ is uniform, the corresponding BED is defined as (e.g., [5, 6, 7, 8])
$$BED = D + \frac{D^2}{N_f(\alpha/\beta)},$$
(1)
where parameters $\alpha$ and $\beta$ characterize radiosensitivity of the irradiated cells. In turn, the probability of survival and tumor control probability can be expressed as
$$S = \exp(-\alpha BED) \text{ and } TCP = \exp(-N_0 S),$$
(2)
where $N_0$ denotes initial (i.e., before commencement of radiotherapy) number of malignant cells in the treatment target (e.g., [9, 10, 11]).
Equation (2) implies that, in the case of uniform target dose, different fractionation schedules with the same BED are iso-effective (radiobiologically equivalent) because they yield the same $S$ and TCP. Consequently, in order to transition from a reference regimen with $D_{ref}$ and $N_{ref}$ to another schedule with $D$ and $N_f$ while preserving TCP, one can use the following equation:
$$BED_{ref} = D_{ref} + \frac{D^2}{N_f_{ref}(\alpha/\beta)} = D + \frac{D^2}{N_f(\alpha/\beta)}.$$
(3)
Since in practice target dose is always non-uniform due to the need to spare normal structures, different treatment schedules can be characterized by a nominal BED defined as
$$BED_{nom} = \bar{D} + \frac{\bar{D}^2}{N_f(\alpha/\beta)},$$
(4)
where $\bar{D}$ denotes the average target dose. Note that the probability of survival is dependent on both $\bar{D}$ and dose variations in the target volume. As a result, treatment regimen with the same $BED_{nom}$ are not generally iso-effective when the target dose is non-uniform.
The main objective of this work is to establish how probability of survival depends on number of fractions for a given radiotherapy plan (including beam energy, gantry angles, monitor unit for each beam, MLC leaves positions etc.) under the condition of fixed $BED_{nom}$. The impetus for our study was twofold. First, it was previously shown that in the case of SBRT, small variations in the target dose can cause significant reduction in the corresponding BED and TCP (e.g., [12, 13]). As a result of recent adoption of SBRT for different anatomical sites (e.g., [14, 15, 16]), it is clinically important to determine whether varying number of fractions can reduce the effect of dose non-uniformity on probability of survival and TCP for hypofractionated treatments. Second, because numerical calculations by Wiklund, et al. [12] indicate that increasing $N_f$ can indeed lead to increased TCP for $BED_{nom} = const$, it is important to establish whether this result is dependent on the dose distribution in the target.
Because replanning can be time consuming and labor intensive, it is interesting to consider plans which are different in two parameters only – number of fractions and total number of monitor units (MU). As number of fractions varies between the plans, MU must also vary if $BED_{nom}$ is fixed (see Eq. (4)). For a reference treatment plan with $N_f = N_{ref}$, let $f_{ref}(D)$ and $\bar{D}_{ref}$ denote the probability dose distribution and average reference dose in the target volume, respectively. Since only changes in total MU and $N_f$ are allowed, the target dose distribution $f(D)$ for an arbitrary $N_f$ satisfies the following relationship:
$$f(D) = cf_{ref}(cD),$$
(5)
where
$$c = \frac{\bar{D}_{ref}}{\bar{D}}$$
(6)
Equations (5,6) and $BED_{nom} = const$ are employed in this work to assess changes in the survival probability as a function of $N_f$. The main result of this study is the analytical proof that for a realistic dose distribution in the target volume, the probability of survival of malignant cells averaged over the distribution of the target dose always decreases with increasing number of fractions.
**Theory**
**Probability of Survival and BED in the Case of Non-Uniform Dose**
Consider first a course of radiotherapy with $N_f$ treatment fractions, (uniform) dose per fraction $d$ and total dose $D = N_f d$. In the LQ model, the probability of survival for irradiated cells is (e.g., [5, 6])
$$S = \exp(-\alpha D - \beta dD) = \exp(-\alpha D - \frac{\beta D^2}{N_f})$$
(7)
Suppose that $V_{PTV}$ denotes the planning target volume (PTV). In the case of heterogeneous target dose, let $V(D)$ denote volume of the target that receives a dose equal to or greater than a given dose $D$. The ratio $V(D)/V_{PTV}$ is a function of dose and is referred to as (cumulative) dose-volume histogram or DVH [17]. From the definition of DVH it follows that the difference $DVH(D) - DVH(D + \Delta D) = -\left(\frac{ADVH}{dD}\right)\Delta D$ equals relative volume of the PTV with dose ranging between $D$ and $D + \Delta D$. Consequently, the probability of survival averaged over the dose distribution in the target is
$$\bar{S} = -\int_{D_{car},\min}^{D_{car},\max} \exp\left(-\alpha D - \frac{\beta D^2}{N_f}\right) \frac{dVH}{dD} \mathrm{d}D,$$
where $D_{car},\min$ and $D_{car},\max$ denote minimum and maximum doses in the PTV. Note that the minus sign before the integral in Eq. (8) is due to the fact that DVH is a monotonically decreasing function of dose.
Computation of $\bar{S}$ requires knowledge of the entire DVH for the target volume. For the purpose of our discussion, it is convenient to rewrite Eq. (8) as
$$\bar{S} = \int_{D_{car},\min}^{D_{car},\max} \exp\left(-\alpha D - \frac{\beta D^2}{N_f}\right) f(D) \mathrm{d}D$$
where $f(D) = -\frac{dVH}{dD}$ represents density distribution of the target dose. The corresponding BED and TCP can be expressed as follows (e.g., [13, 19])
$$BED = -\frac{1}{\alpha} \ln \bar{S} \text{ and } TCP = \exp\left(-N_o \bar{S}\right)$$
**Considered Dose Distribution in the PTV**
In the derivations below, we show that under conditions in Eqs. (5) and (6) $\bar{S}$ decreases with increasing $N_f$ assuming fixed $BED_{nom}$. Note that this conclusion is valid for all SBRT dose distributions in the target volume which we refer to as realistic. Specifically, we consider distributions of the target dose with
$$\alpha BED_{nom} > 1.$$
Since the initial number of malignant cells in the target is typically very large$^1$, the condition in Eq. (11) is necessary to attain TCP reasonably close unity (see Eq. (2)). Another feature of a realistic dose distribution in SBRT is that minimum dose ($D_{min}$) in the PTV is of the same order of magnitude as the mean dose. For example, we examined 60 SBRT plans with the treatment schedule 12 Gy $\times$ 5 = 60 Gy and found $D_{min} > 30$ Gy for each plan. In the following discussion we employ a condition for $D_{min}$:
$$D_{min} > r \bar{D}_{ref}$$
where $\bar{D}_{ref}$ is the mean dose in the PTV for a reference$^1$ $N_o$ is given by the product of $n_o$ and $V_r$, where $n_o$ is the initial concentration of malignant cells in the tumor and $V_r$ is the tumor volume. A reasonable estimate for $n_o$ is $10^7 \text{ cm}^{-3}$ [1].
Regimen with $N_f$,ref fractions and $r$ is the real solution of the following equation:
$$\frac{-\ln r}{1-r} = \alpha BED_{nom}$$
Because $\ln r \leq r-1$ for $r \geq 1$, the real solution of Eq. (13) for $\alpha BED_{nom} > 1$ satisfies $r < 1$. Eq. (13) can be numerically solved by iterations:
$$r_0 = \exp\left(-\alpha BED_{nom}\right), \quad r_1 = \exp\left(-\alpha BED_{nom} \times (1-r_0)\right), \quad r_2 = \exp\left(-\alpha BED_{nom} \times (1-r_1)\right), \dots$$
Several examples are as follows; $\alpha BED_{nom} = 5$, $r \approx 6.977 \times 10^{-3}$; $\alpha BED_{nom} = 10$, $r \approx 4.542 \times 10^{-5}$; $\alpha BED_{nom} = 100$, $r \approx 3.720 \times 10^{-44}$. Note also that due to condition in Eq. (12), $f_{ref}(D)$ is zero in the interval $[0, r \bar{D}_{ref}]$.
Proof that $\bar{S}$ Decreases with Increasing $N_f$ if
$$BED_{nom} = \text{const}$$
The probability of survival averaged over the dose distribution $f(D)$ can be expressed as follows (see Eqs. (4) - (6)):
$$\bar{S} = \int_{0}^{1} \exp\left(-\alpha D - \frac{\beta D^2}{N_f}\right) f(D) \mathrm{d}D = \int_{0}^{1} \exp\left(-\frac{\alpha D x}{D_f} - \frac{\alpha x^2 \left(BED_{nom} - \bar{D}\right)}{D_f^2}\right) f_{ref}(x) \mathrm{d}x,$$
where $x = c D = \frac{\bar{D}_0 D}{D}$. In turn, the derivatives $\frac{\partial S}{\partial D}$ and $\frac{\partial S^2}{\partial D^2}$ are
$$\frac{\partial S}{\partial D} = a \int_{0}^{1} \left(\frac{x^2}{D_f^2} - \frac{x}{D_f}\right) \exp\left(-\frac{\alpha D x}{D_f} - \frac{\alpha x^2 \left(BED_{nom} - \bar{D}\right)}{D_f^2}\right) f_{ref}(x) \mathrm{d}x,$$
and (16)
$$\frac{\partial S^2}{\partial D^2} = \int_{0}^{1} \left(\frac{x^2}{D_f^2} - \frac{x}{D_f}\right) \exp\left(-\frac{\alpha D x}{D_f} - \frac{\alpha x^2 \left(BED_{nom} - \bar{D}\right)}{D_f^2}\right) f_{ref}(x) \mathrm{d}x.$$
It is apparent that $\frac{\partial S^2}{\partial D^2} > 0$. Consequently, $\frac{\partial S}{\partial D}$ is an increasing function of $\bar{D}$. If we can show that $\frac{\partial S}{\partial D}$ is negative for $\bar{D} = BED_{nom}$, then $\frac{\partial S}{\partial D}$ is negative for all $\bar{D} < BED_{nom}$. From the condition $BED_{nom} = \text{const}$ (see Eq. (4)), it follows that $\bar{D}$ increases as $N_f$ increases. Consequently, if $\frac{\partial S}{\partial D} < 0$, we can then conclude that $\frac{\partial S}{\partial N_f}$ is negative for all $N_f$.
Let $\lambda = \alpha BED_{nom} > 1$. Since the mean dose for the distribution $f_{ref}(D)$ is $\bar{D}{ref}$, we have for $\bar{D} = BED{nom}$ (see Eq. (16))
By using $s = x / \bar{D}_{ref} - 1$, we have
$$\frac{\partial \bar{S}}{\alpha \partial D} = \bar{D}_{ref} \exp(-\lambda) \int_{r=1}^{s} s[(s+1) \exp(-\lambda s)-1] f_{ref}(\bar{D}_{ref}(s+1)) \mathrm{d}s$$
$$= \bar{D}_{ref} \exp(-\lambda) \int_{r=1}^{\infty} s Q(s) f_{ref}(\bar{D}_{ref}(s+1)) \mathrm{d}s$$
where $Q(s) = (s+1) \exp(-\lambda s)-1$. To show that $\frac{\partial \bar{S}}{\partial D}$ is less than zero, it is sufficient to show that $s Q(s) < 0$ for all $s > r-1$. To accomplish this, we will show that $Q(s)$ is negative for all $s \in (0, \infty)$ and positive for all $s \in (r-1, 0)$.
Clearly, $Q(0) = 0$. Note that derivative
$$\frac{\mathrm{d}Q(s)}{\mathrm{d}s} = (1-\lambda(s+1)) \exp(-\lambda s)$$
is negative for $s \geq 0$. Consequently, $Q(s) < 0$ and $s Q(s) < 0$ for $s > 0$. Note also that equation $\frac{\mathrm{d}Q(s)}{\mathrm{d}s} = 0$ has a single root $\hat{s} = 1 / \lambda-1$. From the definition of $r$ in Eq. (13) it follows that $Q(r-1) = r \exp(-\lambda(r-1))-1 = 0$.
Does $Q(s)$ have zeroes in the closed interval $[r-1, 0]$ besides its endpoints? If $Q(s)$ had another zero, then by the Rolle's Theorem $\frac{\mathrm{d}Q(s)}{\mathrm{d}s}$ would have at least two zeroes in the open interval $(r-1, 0)$ which is impossible. Consequently, $Q(s)$ is either positive or negative on $(r-1, 0)$. Note that since $\frac{\mathrm{d}Q(s)}{\mathrm{d}s} < 0$ at $s=0$, $Q(s)$ is positive on $(r-1, 0)$. As a result, we conclude that the product $\frac{\mathrm{d}Q(s)}{\mathrm{d}s} < 0$. Since $\frac{\partial \bar{S}}{\partial D} > 0$, $\bar{S}$ decreases with increasing $N_f$. The proof is complete.
It should also be realized that since $\bar{S}$ decreases with increasing $N_f$, $BED = -\frac{1}{\alpha} \ln \bar{S}$ increases with increasing number of fractions.
Elucidation of the Dependence of $\bar{S}$ on $N_f$
The previous Section contains a rigorous proof that $\bar{S}$ decreases with increasing $N_f$ if $BED_{nom} = const$ for a realistic dose distribution and uniform radiosensitivity in the target. Unfortunately, this proof doesn't easily yield a qualitatively clear explanation of the claimed dependence of $\bar{S}$ on $N_f$. Here, we consider a simpler and more intuitive approach previously outlined in [21], which leads to the same conclusion.
By expanding $\exp(-\alpha D + \beta D^2 / N_f)$ in a power series around $\bar{S}$, we obtain
$$\exp(-D + \beta D^2 / N_f) = S(\bar{D}) + (D - \bar{D}) \frac{\partial S(\bar{D})}{\partial D} + \frac{(D - \bar{D})^2}{2} \frac{\partial S^2(\bar{D})}{\partial D^2} + \dots$$
In the case when the variance of the target dose $\sigma$ is small (i.e., $\sigma / \bar{D} << 1$), we can restrict series expansion in Eq. (22) to the second order term. Substituting expression for $\exp(-\alpha D + \beta D^2 / N_f)$ from Eq. (22) into Eq. (9) and considering the fact that the average value of $\bar{D} - \bar{D}$ is zero, we obtain the following equation for $\bar{S}$:
$$\bar{S} = S(\bar{D}, \alpha) + \frac{\sigma^2}{\alpha^2} \frac{\partial S^2(\bar{D}, \alpha)}{\partial D^2} = \left[ 1 + \frac{\sigma^2}{2} \left( \alpha^2 + \frac{2\bar{D}}{N_f(\alpha / \beta)} \right)^2 - \frac{2\beta}{N_f} \right] \exp(-\alpha BED_{nom})$$
One can verify that under the condition $\alpha \bar{D} >> 1$, we have $\frac{2\beta}{N_f} << \alpha^2 \left( 1 + \frac{2\bar{D}}{N_f(\alpha / \beta)} \right)^2$. Consequently, expression for the probability of survival in Eq. (23) is reduced to
$$\bar{S} = \left[ 1 + \frac{\sigma^2}{2} \left( 1 + \frac{2\bar{D}}{N_f(\alpha / \beta)} \right)^2 \right] \exp(-\alpha BED_{nom})$$
In the case $BED_{nom} = const$, from Eq. (4) it follows that dose per fraction $\bar{d} = \frac{D}{N_f}$ decreases with increasing $N_f$. Consequently, Eq. (24) implies that decreases with increasing $N_f$. Unfortunately, truncation of the infinite series for $S$ (which leads to Eq. (24)) is difficult to justify rigorously. Note that the proof in the previous section doesn't use series expansion for $S$. As a result, it is free of limitations inherently present in the intuitive but non-rigorous derivation of Eq. (24) presented above.
Finally, in the case $\frac{\sigma^2 \alpha^2}{2} \left( 1 + \frac{2\bar{D}}{N_f(\alpha / \beta)} \right)^2 << 1$, we have
$$BED = BED_{nom} - \frac{\sigma^2}{2\alpha} \left( \alpha + \frac{2\beta \bar{D}}{N_f} \right)^2$$
Eq. (25), in turn, indicates that for fixed / D σ , reduction in BED due to dose heterogeneity rapidly increases in magnitude with increasing dose per fraction:
2 D BED BED BED N α α β
2 ~ ( ) . nom nom
− + ( ) (26) f
Effect of non-uniform Radiosensitivity on Cell Survival
The discussion in the preceding Sections is focused on the effect of target dose heterogeneity on BED while radiosensitivity of malignant cells is assumed to be uniform. It is potentially clinically important to incorporate the effect of heterogeneous radiosensitivity in the analysis of BED dependence on number of fractions. In this Section we employ the following assumptions: (a)α and β are independent random variables with probability density functions ( ) fα α and ( ) fβ β ; (b) the joint probability for alpha and beta is described by the Gamma probability density function; i.e., , ( , ) ( ) ( ) f f f α β α β α β α β ≡ is given by α β α β θ θ α β α β θ θ − − − − > > = Γ Γ
1 1 exp( ) , 0 and 0 ( , ) ( ) ( )
t t β α (27) α β t t f t t
( ) ( ) α β α β α β
0, otherwise In Eq. (27) Γ denotes the so-called Gamma function [18]
$$ \Gamma (t) = \int_ {0} ^ {\infty} x ^ {t - 1} e ^ {- x} d x, \tag {28} $$
1
0 ( ) t x t x e dx where 0 t > . It should be mentioned that parameters , , and t t α β α β θ θ are defined by the mean values of alpha (α ) and beta ( β ), and their variances 2 2 ( ) and ( ) α β σ σ [18]; i.e.,
2 2 2 2 $$ = \frac {\bar {\alpha} ^ {2}}{\sigma_ {\alpha} ^ {2}}, t _ {\beta} = \frac {\bar {\beta} ^ {2}}{\sigma_ {\beta} ^ {2}}, \theta_ {\alpha} = \frac {\sigma_ {\alpha} ^ {2}}{\bar {\alpha}} \mathrm {a n d} \theta_ {\beta} = \frac {\sigma_ {\beta} ^ {2}}{\bar {\beta}}. \tag {29} $$
2 2 , , and t t β α α β α β α β Note that ( , ) f α β in Eq. (27) is normalized so that $$ \iint_ {0} ^ {\infty} \int_ {0} ^ {\infty} f (\alpha , \beta) d \alpha d \beta = 1. $$
0 0 ( , ) 1 f d d α β α β In the case of non-uniform dose and non-uniform radiosensitivity in the target, the probability of survival average over the distributions of the target dose and radiosensitivity is (see Eq. (8) for comparison)
2 d exp( ) ( , )d d d d f
D DVH S D f D N D β α α β α β = − − − ∫∫∫ . (30)
By using substitutions (see Eq. (27))
2 1 1
1 1 f N d $$ \frac {1}{\theta_ {\beta} ^ {\prime}} = \frac {1}{\theta_ {\beta}} + N _ {f} d ^ {2} \tag {31} $$ f N d $$ \frac {1}{\theta_ {\alpha} ^ {\prime}} = \frac {1}{\theta_ {\alpha}} + N _ {f} d \mathrm {a n d} \frac {1}{\theta} $$ and integrating over alpha and beta, we can reduce the triple integral in Eq. (30) to a single integral t t D $$ \bar {S} = - \int_ {D _ {\min }} ^ {D _ {\max }} \left(1 + \frac {\bar {\alpha} D}{t _ {\alpha}}\right) ^ {- t _ {\alpha}} \left(1 + \frac {\bar {\beta} D ^ {2}}{t _ {\beta} N _ {f}}\right) ^ {- t _ {\beta}} \left(\frac {\mathrm {d} D V H}{\mathrm {d} D}\right) \mathrm {d} D. \tag {32} $$ β α
2 d 1 1 d d D D DVH S D t t N D
α β max f D α β min Note that biologically effective dose for non-uniform radiosensitivity is defined as [19]
$$ B E D = - \frac {1}{\bar {\alpha}} \ln \overline {{S}}. \tag {33} $$
Results
To demonstrate dependence of BED on number of
fractions, we computed BEDs by using DVHs for 57 clinical
cases of early-stage, non-small cell lung cancer. The locations
of the treated lesions are shown in Table 1. The analyzed
radiotherapy plans were created in the Eclipse treatment
planning system (v. 11, Varian Medical Systems, Palo Alto,
CA, USA) by using 6MV flattening-filter free photon beams
and volumetric modulated arcs. Dose distribution for each
treatment plan was computed by using 2 mm
$$ n \times 2 \mathrm {m m} \times 2 \mathrm {m m} \mathrm {d o s e} $$
grid and Analytical Anisotropic Algorithm (AAA). The mean
target dose in the PTV, dose per fraction and number of
fractions for each plan were 60 Gy, 12 Gy and 5, respectively.
The radiosensitivity of malignant cells was characterized $$ \text {b y} \alpha = 0. 3 5 \mathrm {G y} ^ {- 1} \text {a n d} \alpha / \beta = 1 0 \mathrm {G y}. $$
. The employed value
of α was approximately equal to the average value of this
parameter determined by analyzing tumor control for almost
3000 SBRT patients [20]. The corresponding, nominal BED
for each considered plan was 132 Gy.
| Location of Lesions | Number of Cases | |
|---|---|---|
| N | % | |
| RUL | 18 | 31.6 |
| RLL | 10 | 17.5 |
| RML | 4 | 7 |
| LUL | 18 | 31.6 |
| LLL | 7 | 12.3 |
Table 1: Lesion locations: RLL = right lower lobe; RML = right middle lobe; RUL = right upper lobe; LLL = left lower lobe; LUL =
For each case, two DVHs for the PTV were analyzed. The first DVH corresponded to the original plan with 5 f N = , dose per fraction of 12 Gy, total dose of 60 Gy and 132 Gy nom BED = . The second DVH was created by multiplying monitor units for each volumetric arc by a factor 4.54/12= 0.3783 to produce
a new plan with
$$ N _ {f} = 2 0, $$
, dose per fraction of 4.54 Gy, total
dose of 90.8 Gy and the same
$$ B E D _ {n o m} = 1 3 2 \mathrm {G y}. $$ Figure 1a displays comparison between BEDs for two treatment regimens 60 Gy=12 Gy 5 × and 90.8 Gy=4.54 Gy 20 × , and 132 Gy nom BED = . All BEDs displayed in this figure were computed by using planned
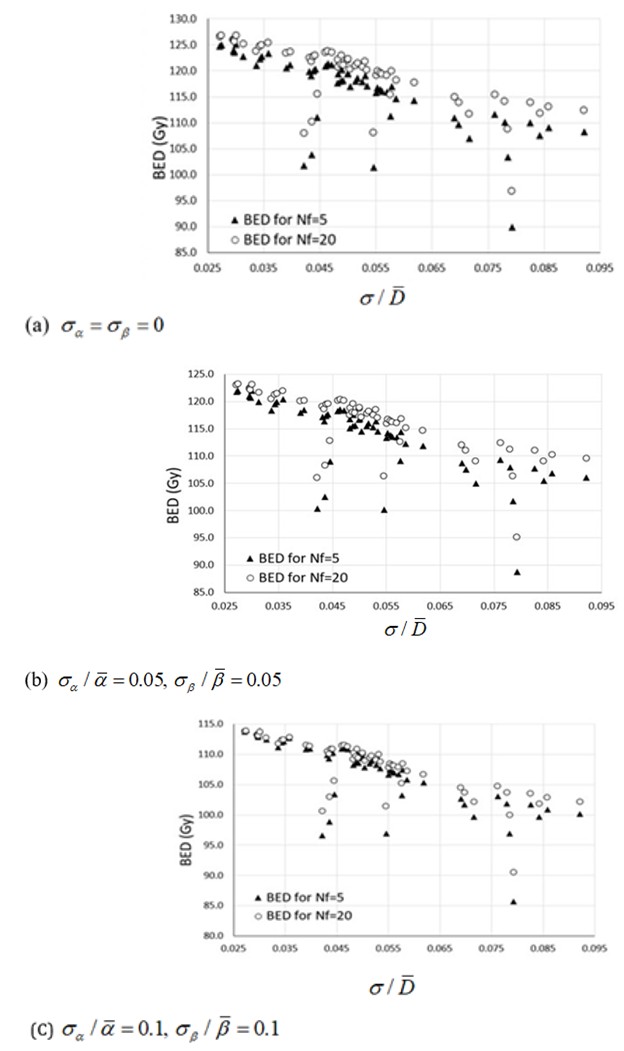
DVHs (see Eqs. (8) and (10)) under the assumption of uniform radiosensitivity in the tumor. To assess the effect of heterogeneous radiosensitivity on the dependence of BED on f N , we also computed BEDs for non-zero values of / and / α β σ α σ β . The results are displayed in Figure 1b and 1c.
. The results in Figs. 1a-1c confirm the following:
•
BED decreases with increasing variance of the target dose
•
BED increases with increasing number of fractions if $$ \mathrm {E} = \mathrm {E} _ {\mathrm {i}} + \mathrm {E} _ {\mathrm {j}} + \mathrm {E} _ {\mathrm {k}} $$
Discussion
As mentioned previously, the objective of this work is to establish how BED in the target varies with f N under the condition of fixed nom BED . The main finding of our study is that for a realistic distribution of the target dose and uniform radiosensitivity in the target, the corresponding BED always increases with increasing number of fractions if nom BED is fixed. The developed proof that BED increases with increasing f N doesn’t employ a truncated power series for S (discussed previously in [12, 13, 21]) which is difficult to rigorously justify. Specifically, in contrast to our recent study [21], the current approach doesn’t require that σ be much smaller than the mean target dose. The obtained results rely on several radiobiological assumptions considered below.
Radiobiological Assumptions
The LQ model for cell killing forms the foundation of our work. The applicability of this model for hypofractionation has been disputed in several studies which described a number of alternative models (e.g., [22, 23, 24, 25]). The main feature of the proposed non-LQ models is that on the log- linear plot the survival curve becomes linear at high doses. By analyzing tumor control data for SBRT and SRS, recent studies, however, concluded that the LQ model fits the clinical TCP data best [20, 26, 27]. It is important to realize that our model doesn’t consider the effect of accelerated (i.e., faster than before commencement of radiotherapy) repopulation of malignant cells which begins after a delay $T_k$ following the first fraction of radiation (e.g., [28, 29]). Since reported $T_k$ for non-small cell cancer of the lung ranges between 14 and 35 days [29], the effect of accelerated repopulation is likely to be small in the case $N_f \leq 20$ considered in our study.
Dependence of BED on the Variance of the Target Dose and $N_f$
As shown in Figure 1, small variance of the target dose (i.e., $\sigma \leq 0.1\bar{D}$) can cause a significant reduction in BED. In this work it is analytically shown that for a given ratio $\sigma/\bar{D}$ and uniform radiosensitivity BED always increases with increasing $N_f$ if $BED_{nom}$ is fixed. It is important to establish whether this increase can be significant for clinical cases.
The results in Figure 1a demonstrate that transitioning from a frequently used SBRT schedule $12\mathrm{Gy} \times 5 = 60\mathrm{Gy}$ with 5 fractions [16] and $BED_{nom} = 132\mathrm{Gy}$ to a schedule $4.54\mathrm{Gy} \times 20 = 90.8\mathrm{Gy}$ with 20 fractions and the same $BED_{nom}$ can lead to 7-8% increase in the corresponding BED. Unlike our previous study [13], these results were obtained by considering clinical cases of SBRT without making additional assumptions regarding the dose distribution in the target.
Effect of Non-Uniform Radiosensitivity on Dependence of BED on $N_f$
The analytically derived conclusion in Section 2.3 that BED increases with increasing number of fractions doesn't consider variations in radiosensitivity. To study the effect of small variations in $\alpha$ and $\beta$ in the tumor on the dependence of BED on $N_f$, we assumed (in contrast to our previous study [21]) that these variations were uncorrelated. This assumption can be justified as follows. In the LQ model, alpha term describes lethal damage produced on the nanometer level. Conversely, beta term relates to damage caused by interactions of double-strand breaks on a significantly larger scale [30]. Another assumption employed in this study is that joint probability distribution of alpha and beta can be approximated by the Gamma density probability function (see Eq. (27)). The rationale for Gamma distribution is threefold:
- Gamma distribution is a smooth, bell-shaped distribution which, in contrast to Gaussian distribution, doesn't allow negative values of alpha and beta;
- Gamma distribution approaches Gaussian distribution when $\sigma_a << \bar{\alpha}$ and $\sigma_\beta << \bar{\beta}$ [18];
- Recently, Gamma distribution was successfully employed to model tumor control in almost 3000 patients [20].
The results from Figures 1b and 1c indicate that BED increases with increasing $N_f$ for non-zero $\sigma_a$ and $\sigma_\beta$. This conclusion was confirmed by computing BED for a Gaussian (joint) distribution of alpha and beta. The resulting values of BED (not shown here for brevity) were within 1% of those in Figures 1b and 1c. The observed good agreement between BEDs computed for Gamma and Gaussian distributions is not surprising because, as mentioned above, Gamma distribution approaches Gaussian distribution for relatively small values of $\sigma_a$ and $\sigma_\beta$.
**Clinical Implications**
Reduction in BED Due to Dose non-uniformity: According to the obtained results, for SBRT regimens with $N_f = 5$, the corresponding BED can decrease by about 30% while $\sigma$ varies between zero and 8% of the mean dose (see Figure 1a). Such significant changes in BED can present a problem for radiobiological comparison of different hypofractionation regimens because clinical reports do not normally contain variance of the target dose for each case. For example, consider two regimens $12\mathrm{Gy} \times 5 = 60\mathrm{Gy}$ and $4.54\mathrm{Gy} \times 20 = 90.8\mathrm{Gy}$ characterized by the same $BED_{nom} = 132\mathrm{Gy}$. In the case $\sigma/\bar{D} = 0.08$, the former regimen with 5 fractions can yield BED of 90Gy while the regimen with 20 fractions achieves BED of 97Gy (see Figure 1a). As shown in this work, in the case of uniform radiosensitivity in the tumor, reduction in BED due to inhomogeneity of the target dose is always smaller for a schedule with a number of fractions $N_{f,1}$ as compared to that for a treatment schedule with $N_{f,2} < N_{f,1}$ for the same ratio $\sigma/\bar{D}$ and $BED_{nom}$.
One possibility to decrease discrepancy between BEDs for different clinical cases is to limit acceptable dose non-uniformity to less than 5% (i.e., $\sigma \leq 0.05\bar{D}$) as proposed in [13, 21]. However, our clinical experience indicates that in some cases this condition is difficult to accomplish. The results of this work suggest that increasing number of fractions can be radiobiologically beneficial for small, well-perfused lung lesions which are frequently targeted in lung SBRT. Specifically, in the case $\sigma > 0.05\bar{D}$ and small variances of alpha and beta, moderate hypofractionation with $N_f = 20$ can yield higher BED (and associated TCP) as compared to treatment schedules with five or fewer fractions used for SBRT of non-small, early-stage lung cancer.
**Clinical Protocols**
A recent study [31] concluded that SBRT for early-stage, non-small lung cancer delivered with a relatively low $BED_{nom}$ (i.e., 100-129 Gy) was characterized by 3 and 5 year overall survival (OS) of 60% and 26%, respectively.
Conversely, regimens with higher $BED_{nom}$ (i.e., >130 Gy) achieved higher 3 and 5 year OS of 64% and 34%, respectively. Due to dose heterogeneity in the PTV, a treatment regimen with a higher $BED_{nom}$ and higher ratio $\sigma/\bar{D}$ can result in actual BED lower than that achieved for a regimen with a lower $BED_{nom}$ and lower ratio $\sigma/\bar{D}$ [13]. These findings indicate the need to report both mean target dose and its variance for the analysis of local control and OS for different SBRT protocols.
Conclusion
The main results of this work can be summarized as follows:
• It is theoretically shown that in the case of uniform intratumor radiosensitivity and $BED_{nom} = const$ the probability of cell survival ($\bar{S}$) in the target decreases with increasing $N_f$ for an arbitrary ratio $\sigma/\bar{D}$.
• The performed computations confirm that $\bar{S}$ also decreases with increasing $N_f$ in the case of small variations in the radiosensitivity of malignant cells (i.e., $\sigma_n << \bar{a}$ and $\sigma_n << \bar{b}$).
• The results indicate that moderate hypofractionation with $N_f = 15–20$ can yield higher BED as compared to the commonly employed SBRT schedules with $N_f \leq 5$.
References
-
Webb S, Nahum AE (1993) A model for calculating tumour control probability in radiotherapy including the effects of inhomogeneous distributions of dose and clonogenic cell density. Phys Med Biol 38(6): 653-666.
-
Webb S, Evans PM, Swindell W, Deasy JO (1994) A proof that uniform dose gives the greatest TCP for fixed integral dose in the planning target volume. Phys Med Biol 39(11): 2091-2098.
-
Brahme A (1984) Dosimetric precision requirements in radiation therapy. Acta Radiol Oncol 23 (5): 379-391.
-
Sinclair WK (1968) The shape of radiation survival curves of mammalian cells cultured in vitro. Biophysical Aspects of Radiation Quality Technical Reports Series 58.
-
Fowler JF (1989) The linear-quadratic formula and progress in fractionated radiotherapy. Br J Radiol 62: 679-694.
-
McMahon SJ (2019) The linear quadratic model: usage, interpretation and challenges. Phy Med Biol 64(1): 01TR01.
-
Barendsen GW (1982) Dose fractionation, dose rate and iso-effect relationships for normal tissue responses. Int J Rad Oncol Biol Phys 8: 1981-1997.
-
Fowler JF (2010) 21 years of Biologically Effective Dose. B J Radiol 83: 554-568.
-
Porter EH (1980) The statistics of dose/cure relationships for irradiated tumours. Br J Radiol 53: 336-345.
-
Deasy J (1996) Poisson formulas for tumor control probability with clonogenic proliferation. Radiat Res 145: 382-384.
-
Nahum AE, Sanchez-Nieto B (2001) Tumor control probability modeling: Basic principles and applications in treatment planning. Physica Medica 17: 13-23.
-
Wiklund K, Toma-Dasu I, Lind BK (2011) The influence of dose heterogeneity on tumour control probability in fractionated radiation therapy. Phys Med Biol 56(23): 7585-7600.
-
Kuperman VY, Lubich LM (2021) Impact of target dose inhomogeneity on BED and EUD in lung SBRT. Phy Med Biol 66: 01NT02.
-
Timmerman RD, Kavanagh BD, Cho LC, Papiez L, Xing L (2007) Stereotactic body radiation therapy in multiple organ sites. J Clin Oncol 25(8): 947-952.
-
Onishi H, Araki T, Shirato H, Nagata Y, Hiraoka M, et al. (2004) Stereotactic hypofractionated high-dose irradiation for stage I non-small cell lung carcinoma: clinical outcomes in 245 subjects in a Japanese multi-institutional study. Cancer 101: 1623-1631.
-
Corso DC, Park HS, Moreno AC, Kim AW, Yu JB, et al. (2017) Stage I lung cancer SBRT clinical practice patterns. American J Clin Oncol (40): 358-361.
-
Drzymala RE, Mohan R, Brewster L, Chu J, Goitein M, et al. (1991) Dose-volume histograms. Int J Radiat Oncol Biol Phys (21): 71-78.
-
Arfken GB, Weber HJ, Harris FE (2013) Mathematical methods for physicists. 7th(Edn.), Academic Press.
-
Hawkins RB (2017) Effect of heterogeneous radio sensitivity on the survival, alpha beta ratio and biologic effective dose calculation of irradiated mammalian cell populations. Clinical and Translational Radiation Oncology 4: 32-38.
-
Shuryak I, Carlson DJ, Brown MJ, Brenner DJ (2015) High-dose and fractionation effects in stereotactic radiation therapy: Analysis of tumor control data from 2965 patients. Radiother Oncol 115(3): 327-334.
-
Kuperman VY, Lubich LM (2021) Effect of heterogeneous target dose and radiosensitivity on BED and TCP for different treatment regimens. Phys Med Biol 66: 155006.
-
Guerrero M, Li XA (2004) Extending the linear-quadratic model for large fraction doses pertinent to stereotactic radiotherapy. Phys Med Biol 49: 4825-4835.
-
Kirkpatrick JP, Meyer JJ, Marks LB (2008) The L-Q model is inappropriate to model high-dose per fraction effects. Semin Radiat Oncol 18(4): 240-243.
-
Astrahan M (2008) Some implications of linear- quadratic-linear radiation dose-response with regard to hypofractionation. Med Phys 35(9): 4161-4172.
-
Park C, Papiez L, Zhang S, Story M, Timmerman RD (2008) Universal survival curve and single fraction equivalent dose: useful tools in understanding potency of ablative radiotherapy. Int J Radiat Oncol Biol Phys 70(3): 847-852.
-
Brenner DJ (2008) The linear-quadratic model is an appropriate methodology for determining isoeffective doses at large doses per fraction. Semin Radiat Oncol 18: 234-239.
-
Ruggieri R, Stavrev P, Naccarato S, Stavreva N, Alongi F, et al. (2017) Optimal dose and fraction number in SBRT of lung tumours: A radiobiological analysis. Phys Med (44): 188-195.
-
Armpilia CI, Dale RG, Jones B (2004) Determination of the optimum dose per fraction in fractionated radiotherapy when there is delayed onset of tumour repopulation during treatment. Br J Radiol 77(921): 765-767.
-
Mehta M, Scrimger R, Mackie R, Paliwal B, Chappell R, et al. (2001) A new approach to dose escalation in non- small-cell lung cancer. Int J Radiat Oncol Biol Phys 49(1): 23-33.
-
Brenner DJ, Hall EJ (2000) In response to Drs. King and Mayo: Low alpha/beta values for prostate appear to be independent of modeling details. Int Radiat Oncol Biol Phys 472: 538-539.
-
Moreno AC, Fellman B, Hobbs BP, Liao Z, Gomez DR, et al. (2020) Biologically effective dose in stereotactic body radiotherapy and survival for patients with early-stage NSCLC. J Thorac Oncol 15(1): 101-109.
- Sense, Gravity, Parity & Chirality in Mathematical Physics
- Quantum Lattice Simulations PHYSICS: Microcircuit Particle Formation and Observable Macroscopic Irreversible Time - A Discrete Lagrangian with Cellular Automata Framework
- Quantum Biology from Biomacromolecule to Cell, and Central Dogma Described by Quantum Theory
- Focus, Agility, Speed and Technology (FAST) for Sustainability and Growth
- Square Root Metric Geometry and Pati-Salam Model in Curved Space-Time
- A Simple System Demonstrating the Mpemba Effect in Classical Mechanics