White Blood Cell Response of Nile Tilapia (Oreochromis Niloticus L.) to Single, Double and Multiple Bacterial Infections
The general objective of the study was to investigate the White Blood Cell (WBC) response of Nile tilapia (Oreochromis niloticus L.) of various weight groups (A1 = 45-50 g; A2 = 95-100 g and A3 = 145-150 g) to single (B2, B3 and B4), double (B5, B6 and B7) and multiple (B8) bacterial infections. The experiment utilized three different bacteria (Aeromonas hydrophila, A. sobria and Providencia rettgeri) and the experimental fish were exposed on these bacterial isolates at three different levels of infections. Morphological signs such as red spots, external nodule, fin erosion and bulging eyes were observed in infected fish after four days. Across levels of infections and weight groups, the final Total White Blood Cell (TWBC) count was higher than the initial TWBC count. Highest final TWBC counts were observed in fish that received multiple infections (1st weight group = 312.00 ± 50.27/mm3; 2nd weight group = 289.00±99.24 mm3; 3rd weight group = 293±112.12/mm3). The study also found out that P. rettgeri was more pathogenic in larger sized tilapia, and A. hydrophila or A. sobria was more pathogenic when mixed with P. rettgeri. Only three types of WBC were identified in the differential counting. Before the challenge test, the highest percentage of cell type was neutrophils, followed by monocyte and lymphocyte. The reduction of neutrophils was more distinct in double and multiple bacterial infections and largest weight group, specifically in A3B7 (A. sobria + P. rettgeri) (initial = 56.33% ± 6.81; final = 20.33% ± 13.65) and A3B8 (A. hydrophila + A. sobria + P. rettgeri) (initial = 56.33% ± 12.12; final = 23.00% ± 9.17). Percent increase rate in lymphocyte ranged from 58.45-92.68% in 45-50 g, 43.69-66.06% in 95-100 g and 43.93-85.21% in 145-150 g. By level of bacterial infections, the first five highest percent increase in lymphocyte were recorded in A1B8 (A. hydrophila + A. sobria + P. rettgeri; 92.68%), A3B1 (no infection; 85.21%), A1B3 (A. sobria; 84.73%), A1B2 (A. hydrophila; 81.62%) and A1B5 (A. hydrophila + A. sobria; 79.56%). In general, the smallest weight group and tilapia that received multiple bacterial infections had the highest increase in lymphocyte count after the challenged test. Slight reductions in percent monocyte count were observed across weight groups and level of bacterial infections after the challenge test, and statistical analysis showed no significant difference (p>0.05). Percent reduction rate in percent monocyte count was more evident in fish exposed in single infection, especially in P. rettgeri. Two-way Analysis of Variance revealed that the interaction effect of different tilapia weight groupings and level of bacterial infections showed no significant effect on TWBC and differential WBC of the experimental fishes (p>0.05).
Alvin T Reyes* and Nikko C Aliasas
Philippines
alvinreyes1845@gmail.com
showed no significant difference (p>0.05). Percent reduction rate in percent monocyte count was more evident in fish exposed in single infection, especially in P. rettgeri. Two-way Analysis of Variance revealed that the interaction effect of different tilapia weight groupings and level of bacterial infections showed no significant effect on TWBC and differential WBC of the experimental fishes (p>0.05).
Keywords: White Blood Cell; Bacterial Infections; Oreochromis Niloticus L
Abbreviations: TWBC: Total White Blood Cell; FAC: Freshwater Aquaculture Center; TSA: Tryptone Soya Agar; TSB: Tryptone Soya Broth; RBC: Red blood cell.
Introduction
Background of the Study
All living organisms can, in certain circumstances, become subject to disease and fishes make no exception [1]. Diseases are commonly caused by pathogenic organisms, and among pathogens bacteria have the biggest problem [2]. The most common bacteria in freshwater habitats throughout the world are among motile aeromonads [3]. Aeromonas spp. are characteristically divided into three biochemically differentiated groups namely A. hydrophila, A. caviae and A. sobria [4]. The above mentioned pathogens may affect a variety of cool and cold-water species, but are not necessarily restricted to freshwater environments [5]. According to Cipriano, et al. [5], the prevalence of Motile Aeromonad Septicemia in cultured and wild Nile tilapia (Oreochromis niloticus) was 10.0% and 2.5%, respectively.
According to Buller NB [6] our knowledge about the isolation and identification of bacteria from aquatic animals and the aquatic environment is expanding at a rapid rate. The author also mentioned that new organisms, be they are pathogens, normal flora or potential probiotics, are being described and reported each month. This has happened due to an increase in aquaculture research, intensive fish farming systems, international trade of live aquatic animals and products, and the emergence of new diseases [6]. Providencia rettgeri is one of the new emerging pathogenic organisms that cause diseases in tilapia such as septicaemia [7]. According to the study of Shoemaker, et al. [12], the captive tilapia with a single bacterial infection had less than 7% total mortality. They added that during the co- infection, mortality increased significantly. Moreover, single bacterium has the ability to intensify the mechanisms of other bacteria in terms of their capacities to adhere, invade and cause damage to host cells and tissues, as well as to survive host defences and establish infection [7]. These bacteria-bacteria interactions are mechanism to keep the microhabitat to certain species of microorganisms. However, these mechanisms for regulating the growth of other bacteria appear to be inhibited in situations of stress such as changes in water temperature [7].
According to Al-Zubaydi ZH [8], there are about 60,000 white blood cells (WBCs) per mm3 and they account for less than 1% of total blood volume. Leukocytes form a protective, movable army that helps defend the body against damage by bacteria, viruses, parasites and tumor cells [8]. Most vertebrates have five types of WBCs or leukocytes: neutrophils, lymphocytes, eosinophils, basophils and monocytes [9].
The immunological function of each of the WBC types has been reviewed extensively [8]. The author observed that neutrophils are the primary phagocytic leukocyte, and proliferate in circulation in response to infections, inflammation and stress. The author also stated that lymphocytes are involved in a variety of immunological functions such as immunoglobulin production and modulation of immune defense. Basophils are the rarest of the WBCs which contain a large histamine-containing granule that makes blood vessels leaky and attracts other WBCs to the inflammatory site. The remaining 20% of the leukocytes or WBCs represent a combination of eosinophils, which play a role in the inflammation process, and monocytes, which are long-lived phagocytic cells associated with defense against infections and bacteria [8].
Haematological analysis can provide valuable knowledge for monitoring the health and condition of both wild and cultured fishes [10]. Qualitative and quantitative variations in haematological parameters including the red blood cell (RBC) and WBC numbers, cell proportions of leukocyte, the amount of haemoglobin and the size of RBC and WBC are the most significant findings as regards to diagnosis [11].
Objectives of the Study
Most studies of disease in tilapia to date have focused on a single bacterial pathogen. In intensive tilapia aquaculture, the reality of a single disease agent resulting in death-loss may be small. More likely, multiple disease agents are present and responsible for disease losses [12]. The study generally aimed to investigate the WBC response of Nile tilapia of various weight groups to single, double and multiple bacterial infections. Specifically, this study aimed to:
- Investigate the effect of A. hydrophila, A. sobria and P. rettgeri of various level of bacterial infections in the WBC and differential WBC counts of Nile tilapia.
- Investigate the effect of tilapia weight groups in the WBC and differential WBC counts of Nile tilapia.
- Investigate the interaction between level of bacterial infections and tilapia weight groups in the WBC and differential WBC counts of Nile tilapia.
- Investigate the gross-anatomical effect of the bacteria to the various tilapia weight groups. Time and Place of the Study The study was conducted at the Wet and Fish Pathology Laboratories of the Freshwater Aquaculture Center (FAC), Central Luzon State University (CLSU), Science City of Muñoz, Nueva Ecija, Philippines from November 2013 to January 2014.
Materials and Method
Preparation of the Bacterial Isolates
Pure culture of A. hydrophila, A. sobria and P. rettgeri was obtained from the National Institute of Molecular Biology and Biotechnology of the University of the Philippines, Los Baños, Laguna. The three bacterial isolates were sub-cultured separately in Tryptone Soya Agar (TSA) plates. Four to five colonies from the 24 hours sub-cultured bacteria were transferred to 5 mL Tryptone Soya Broth (TSB). After 18 hours of incubation, the broth culture of each bacterial pathogen was serially diluted up to 10-6 [13].
Acclimatization of the Experimental Fish
Healthy Nile tilapias from FAC-CLSU were acclimatized in aquaria for two weeks. The experimental fish came from three weight groupings: 45-50 g, 95-100 g and 145- 150 g. The aquaria were provided with aeration throughout the course of acclimatization. The fish were fed based upon their average body weight, 5% feeding rate for 45-50 g, 4% feeding rate for 95-100 g and 3% feeding rate for 145-150 g.
Experimental Unit and Design
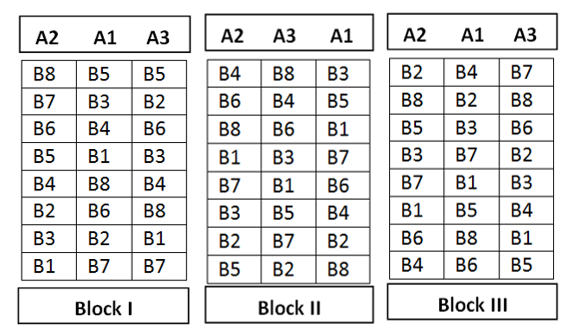
Circular plastic containers with volume capacity of 6 L served as experimental unit. The study used two-factor factorial in a split-plot RCBD with three replicates (Figure 1). The various weight groups served as Factor A and level of bacterial infections were Factor B (Table 1). Aeration was provided in the experimental unit throughout the course of the study. Each experimental unit was stocked with one-piece male tilapia from the above-mentioned weight groups.
| Factor A(Weight, g) | Factor B (level of bacterial infections) |
|---|---|
| A1 = 45-50 | B1 = no infection |
| A2 = 95-100 | B2 = single (A. hydrophila) |
| A3 = 145-150 | B3 = single (A. sobria) |
| B4 = single (P. rettgeri) | |
| B5 = double (A. hydrophila + A. sobria) | |
| B6 = double (A. hydrophila + P. rettgeri) | |
| B7 = double (A. sobria + P. rettgeri) | |
| B8 = multiple (A. hydrophila + A. sobria + P. rettgeri) |
Table 1: Description of the two factors that used in the experiment.
Challenge Test
The experimental fish were exposed to the bacterial isolates at three different levels:
- Single infection
- Double infections
- Multiple infections.
Briefly, 0.2 mL of the 10-6 serially diluted bacterium or bacteria combinations were injected intraperitoneally to the stocked tilapia. After injection, the fish were observed twice a day for any gross-anatomical signs of infection; mortalities were recorded also. The challenge test lasted for 6 weeks. Dead fish were necropsied, and smears from spleen, liver and kidney were streaked aseptically on TSA plates for incubation at 37°C for 18-24 hours [13]. Mortalities only valid if the isolates have similar morphological characteristics when compared to the known bacteria that were used in the challenge test.
Collection of Blood and Analysis
Fish blood sample per experimental unit was collected before and after the challenge test. Approximately, 200 µl were pooled from each fish by puncturing the blood vessels at the gills using 1 mL disposable syringe that was attached in 23 g needle [13]. Blood samples were distributed for WBC and differential WBC counting.
WBC Counting
The 100 µl blood was added with 2 mL of Turk’s Solution (1 mL crystal violet and 2 mL glacial acetic acid with 100 mL distilled water) and mixed gently. After mixing, the diluents were filtered and volume of 2 µl was placed in a Haemocytometer counting chamber. The total WBC count was calculated using the formula below [14]. Total WBC per mm3 = WBCs counted x Dilution (1:20)/ Volume (0.4)
Differential WBC Counting
Differential WBC count was done by using the oil immersion of a compound microscope. Each cell type (e.g. neutrophils, lymphocytes, eosinophils, basophils and monocytes) was recorded until a total of 100 cells were counted. The number of cells counted was expressed in percentage [13].
Statistical Analysis
Data on WBC and differential WBC counts were subjected first to square root and arcsin transformations, respectively. Analysis of Variance was used in determining significant differences within factors and interaction among factors. Tukey’s test was used in pair- wise comparison. Meanwhile, T-test was used in comparing the factors before and after the challenge test. The set of data was analyzed using SPSS.
Results and Discussion
General Conditions of the Experimental Fish
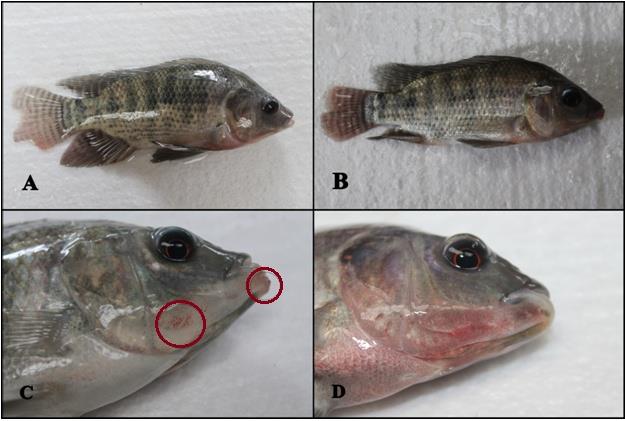
During the conduct of the study, the conditions of the experimental fish were monitored daily and possible mortalities were observed before and after the injection of bacterium or combination of bacteria. After four days of challenge test, majority of the challenged fish showed several signs of bacterial infection. Observed signs of bacterial infections include the presence of red spots, external nodule, fin erosion particularly in caudal fin and bulging of eyes (Figure 2). These infected fish also lost their appetite. The above mentioned physical and behavioural signs of infection were more pronounced in fish challenged with double and multiple bacteria. Control group showed body discoloration which can be a sign of distress due to cold weather. Cold weather is an important stressor that induces changes in hormone secretion, the cardiovascular system and the immune- system in animals [15]. Three weeks after the challenge test, two mortalities were observed in A1B7 (A. sobria and P. rettgeri) and A3B8 (A. hydrophila, A. sobria and P. rettgeri). It is evident from the results that the combination of Aeromonas and Providencia strain increased the host susceptibility. According to Shoemaker [12], combination of pathogenic organisms could increase the stress responses and decrease the disease resistance of the fish. Moreover, as stated by Gonzales-Parraga, et al. [7] single bacterium has the ability to intensify the mechanisms of other bacteria in terms of their capacities to adhere, invade and cause damage to host cells and tissues, as well as to survive host defenses and establish infection.
Recovery of the Bacteria
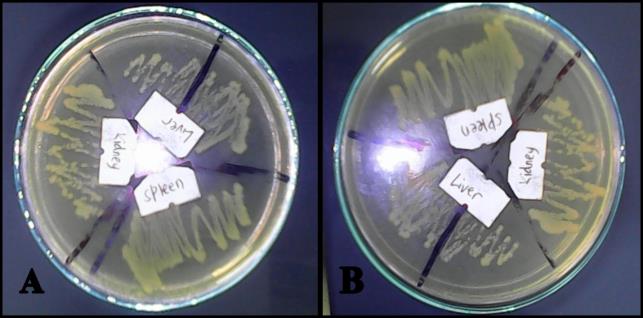
Necropsy was done in all dead fish and smears from spleen, liver and kidney were streaked aseptically on TSA plates to confirm the cause of death. After incubation at 37°C for 18-24 hours, bacterial growth was observed in the streaked plates and their isolates were morphologically similar as compared to the known bacteria that were used in the challenge test (Figure 3). Basically, the three bacterial isolates appeared yellowish and rounded in TSA plates but the main difference was observable based upon their sizes; P. rettgeri as smallest and A. hydrophila as largest. The recovery of the three bacteria in the necropsied fish only proved that the signs of disease and mortalities of the experimental fish were due to the injected bacteria. Also, more colonies of Aeromonas than P. rettgeri were recovered in the necropsied tilapia.
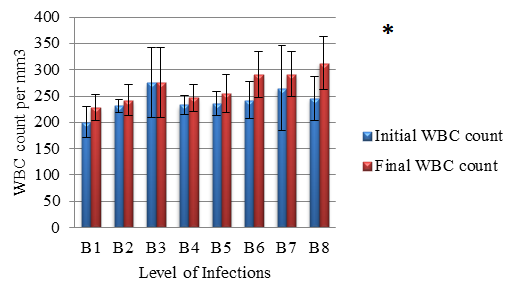
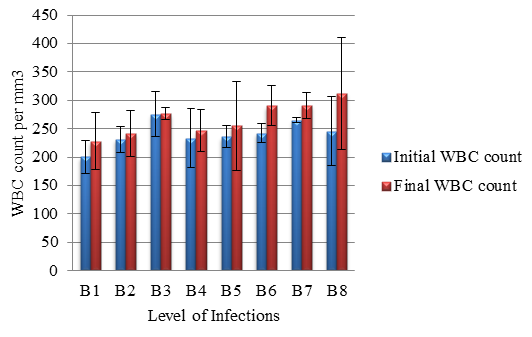
Across level of infections, the final TWBC count was higher than the initial TWBC and the significant difference was only recorded in multiple infections, A1B8 (initial=245.33±49.96/mm3; final=312.00 ± 50.27/mm3). Prominent increase in final TWBC were also observed in tilapia exposed to double infections (A1B5, A1B6, A1B7). The combination of P. rettgeri along with A. hydrophila (A1B6) or A. sobria (A1B7) also resulted to higher final TWBC as compared with combination of the latter two bacteria (A1B5) (Figure 4).
Total White Blood Cell Count Before Challenge Test
The linearized mean values of Total White Blood Cell (TWBC) by weight groupings were different from each other (Table 2). Highest mean value (240.21 ± 43.97/mm3) of TWBC count was observed in the smallest fish (45-50 g) while lowest (199.29 ± 51.33/mm3) in the largest fish (145-150 g). TWBC of 45-50 g and 95-100 g weight groupings were significantly higher than TWBC of 145-150 g weight group.
| WBC ± SD (per mm³) | |
|---|---|
| 45-50 | 240.21 ± 43.97 b |
| 95-100 | 237.08 ± 33.66 b |
| 145-150 | 199.29 ± 51.33 a |
Table 2: TWBC count by weight of the experimental fish before challenge test.
First Weight Group (45-50 g)
Total White Blood Cell Count After Challenge Test
Second Weight Group (95-100 g)
Higher TWBC’s were observed in the final counts but comparison showed no significant differences in all level of infections. The same with 45-50 g fish, highest final TWBC (289.00 ± 99.24/mm3) was observed in multiple infections, A2B8 and followed by double infections, A2B5 (282.33 ± 79.61/mm3). It was also noted that single infection of P. rettgeri also showed comparable effects in the final TWBC as compared to A2B5 and A2B8 (Figure 5).
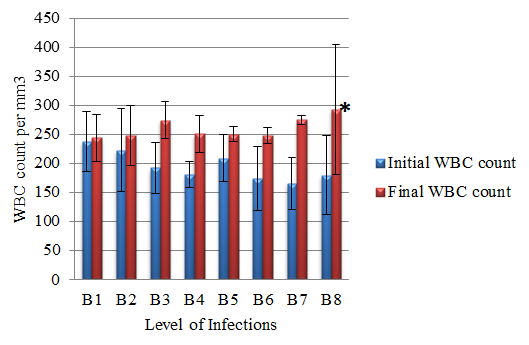
Third Weight Group (145-150 g)
The effect of bacteria in the final TWBC count was more pronounced in larger group of the experimental fish. In all treatments, the final TWBC counts were higher than the initial TWBC counts, with significant difference only recorded in double infections, A3B7 (initial = 165.67 ± 45.72/mm3; final = 275.00 ± 8.66/mm3). Highest final TWBC (293 ± 112.12/mm3) was recorded in multiple infections, A3B8, but no significant difference was observed as compared to initial count because of high variation in the final count of the replicates. Single infection of P. rettgeri, A3B3 also showed prominent increased in the final TWBC (274.33 ± 32.04/mm3) of tilapia under this weight group (Figure 6). This result might hypothesize that P. rettgeri was more pathogenic in larger sized tilapia.
Corroborating these results, Elkamel and Mosaad (2012) reported that after the injection of A. hydrophila in Nile tilapia, the WBC counts were increased. On the other hand, tilapia injected with 1 x 10⁶ CFU/mL of Enterococcus also showed an increase in WBC counts as stated by Martins, et al. [16].
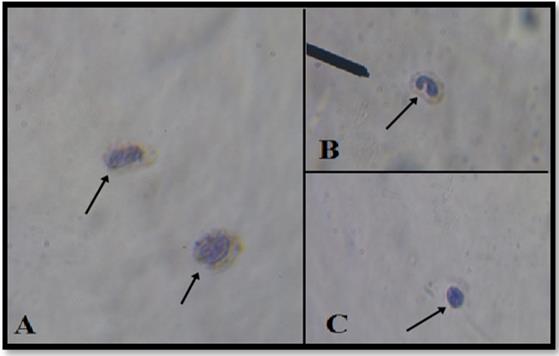
Differential WBC Count Before and After Infection
Before and after the challenge test, different types of WBC were counted in order to determine the percentage of each cell type circulating in the blood of Nile tilapia. Typically, five kinds of WBC were expected in differential counting but only three types were identified namely neutrophils, lymphocytes and monocytes (Figure 7).
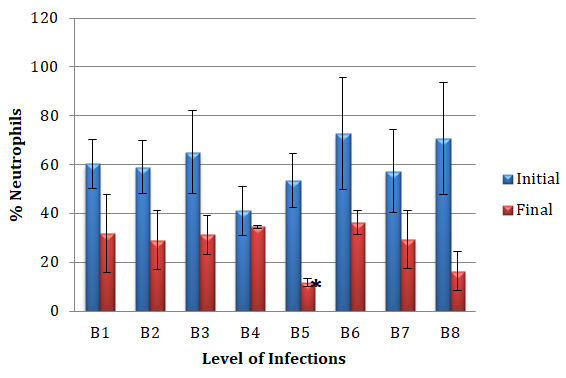
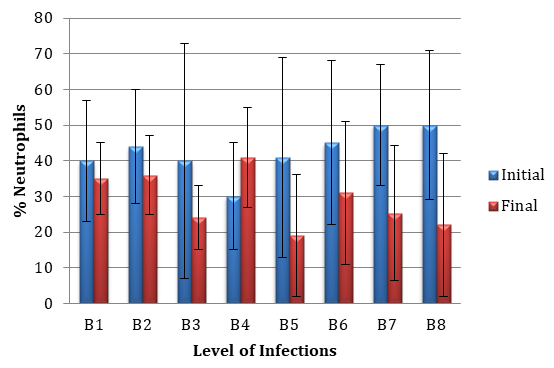
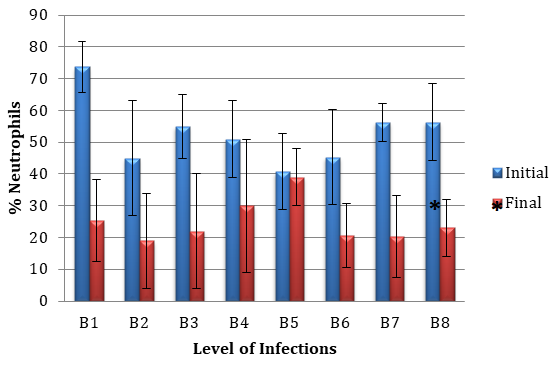
Significant reductions in percent neutrophils before and after infection were recorded in A1B5 (initial = 53.33%±11.55; final = 11.67%±1.53), A3B7 (initial = 56.33%±6.81; final = 20.33%±13.65) and A3B8 (initial = 56.33%±12.12; final = 23.00%±9.17) (Figures 8-10).
The other two types, basophil and eosinophil were not observed.
Before the challenge test, the highest percentage of cell type was neutrophils, followed by monocyte and lymphocyte. Percent neutrophils in general were significantly higher as compared to the other WBC types based upon weight groupings and level of infections. After the challenge test, there was significant increase in percent lymphocyte by weight and level of infection as effect of decrease in percent neutrophils and monocytes.
Neutrophils
Percent neutrophils before infection ranged from 41.50-70.67% (1st weight group), 36.00-50.00% (2nd weight group) and 40.67-73.67% (3rd weight group) of the TWBC. After infection, the percent reduction rate in percent neutrophils across level of bacterial infections (B1 = 12.50-65.62%; B2 = 20.00-57.78%; B3 = 40.00- 60.24%; B4 = 16.87-41.18%; B5 = 2.46-78.12%; B6 = 46.89-54.40%; B7 = 48.84-63.91%; B8 = 50.00-76.89%) and weight groups (1st = 16.87-78.12%; 2nd = 12.50- 53.66%; 3rd = 2.46-65.62%) were very prominent. The reduction of neutrophils was more distinct in multiple bacterial infections, B8 and largest weight group.
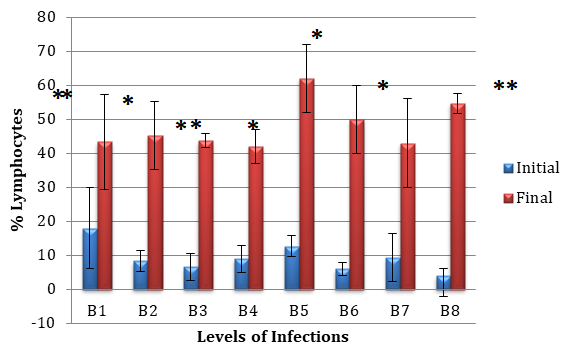
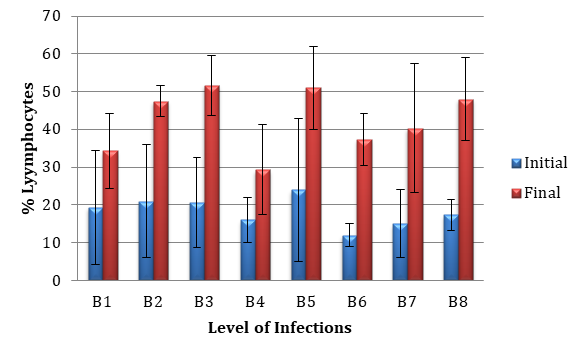
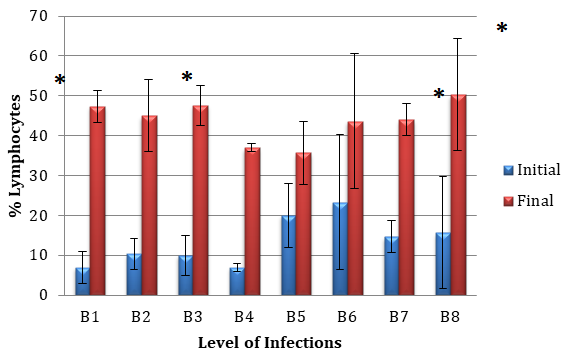
Percent lymphocyte by weight groups in uninfected experimental fish ranged from 4.00-18.00% (1st weight group), 12.67-24.00% (2nd weight group) and 7.00- 23.33% (3rd weight group) of the TWBC (Figures 11-13). The prominent increase in percent lymphocyte after challenge test was very evident in all weight groups and level of infections. Percent increase rate ranged from 58.45-92.68% in 45-50 g, 43.69-66.06% in 95-100 g and 43.93-85.21% in 145-150 g. By level of bacterial infections, the first five highest percent increase in lymphocyte were recorded in A1B8 (92.68%), A3B1 (85.21%), A1B3 (84.73%), A1B2 (81.62%) and A1B5 (79.56%). In general, the smallest group had the highest increase in percent lymphocyte. Fish infected by multiple bacteria in 45-50 g and 95-100 g had the highest increase in lymphocyte count after the injection.
Highly significant increase in percent lymphocyte before and after infection were recorded in A1B1, A1B3and A1B8 (p<0.01); significant increase was observed in A1B2, A1B4, A1B5, A1B6 (1st weight group), A3B1, A3B3, A3B7 and A3B8 (3rd weight group). Leucocyte belongs to an important cell involved in the immune response. In fact, under severe infection, the organism produces more white blood cells. It can be added that lymphocytes have been reported as immunocompetent cells Martins, et al. [16].
Monocyte
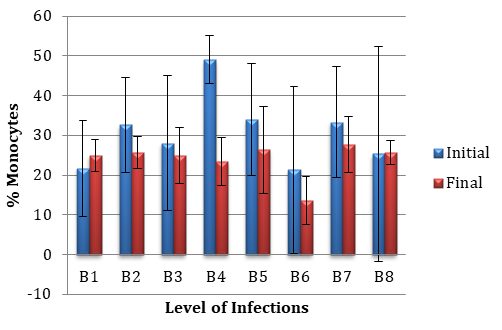
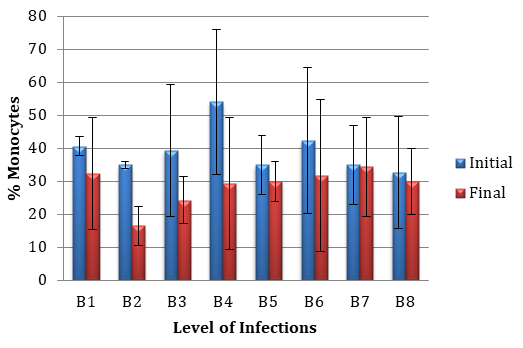
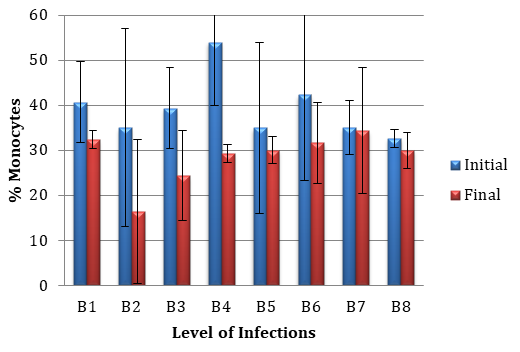
count was more evident in fish exposed in single infection, especially in P. rettgeri, B4 (A1B4 = 52.52%; A2B4 = 45.69%) and in small to medium size fish (45-50 g and 95-100 g). Increased final monocyte counts were observed in A3B6 and A3B7 (Figures 14-16). As support to these results, Martins, et al. [16] also reported that after the injection of 1 x 10⁶ Enterococcus/mL in tilapia, a decreased number of monocytes were observed and possibly, these cells were recruited to the lesion site as added by the author.
Percent monocyte count in the experimental fish before challenge test was highest in 95-100 g (32.00- 54.00%), followed by 45-50 g (21.33-49.50%) and 145- 150 g (19.33-44.67%). Slight reductions in percent monocyte count were observed across weight groups and level of bacterial infections after challenge test, and statistical analysis showed no significant difference (p>0.05). Percent reduction rate in percent monocyte
Interaction of Weight and Level of Bacterial Infections to WBC Count
Two-way Analysis of Variance revealed that the interaction effect of different tilapia weight groupings and level of bacterial infections showed no significant effect on TWBC and differential WBC of the experimental fish (p>0.05). Based upon the computed F value, level of bacterial infections has greater effect in TWBC and percent neutrophils; however, percent lymphocyte and monocyte were more affected by weight.
Summary and Conclusion
The general objective of the study was to investigate the White Blood Cell response of Nile tilapia of various weight groups to single, double and multiple bacterial infections. The experiment utilized three different bacteria (Aeromonas hydrophila, A. sobria and Providencia rettgeri) and the experimental fish were exposed at three different levels of infections:
- Single infection
- Double infections
- Multiple infections Briefly, 0.2 mL of the 10-6 serially diluted bacterium or bacteria combinations were injected intraperitoneally to the experimental fish.
Signs of infections were observed in the challenged fish after four days. Morphological signs such as red spots, external nodule, fin erosion and bulging eyes were seen in infected fishes. To confirm that the signs of infections and mortalities were due to the injected bacteria, dead fish were necropsied and the three bacteria were re-isolated from the spleen, liver and kidney.
Across level of infections and weight groups, the final TWBC count was higher than the initial TWBC count. Highest final TWBC counts were observed in fish that received multiple bacterial infections (1st weight group = 312.00±50.27/mm3; 2nd weight group = 289.00±99.24/mm3; 3rd weight group = 293±112.12/mm3). The study also found out that P. rettgerri was more pathogenic in larger sized tilapia, and A. hydrophila or A. sobria was more pathogenic when mixed with P. rettgeri. Only three types of WBC were identified in the differential counting. Before the challenge test, the highest percentage of cell type was neutrophils, followed by monocyte and lymphocyte. After the challenge test, there was significant increase in percent lymphocyte due to decrease in percent neutrophils and monocytes.
The reduction of neutrophils was more distinct in multiple bacterial infections and largest weight group, specifically, in A1B5 (initial = 53.33%±11.55; final = 11.67%±1.53), A3B7 (initial = 56.33%±6.81; final =
20.33% ±13.65) and A3B8 (initial = 56.33%±12.12; final = 23.00%±9.17). Percent increase rate in lymphocyte ranged from 58.45-92.68% in 45-50 g, 43.69-66.06% in 95-100 g and 43.93-85.21% in 145-150 g. By level of bacterial infections, the first five highest percent increase in lymphocyte were recorded in A1B8 (92.68%), A3B1 (85.21%), A1B3 (84.73%), A1B2 (81.62%) and A1B5 (79.56%). In general, the smallest weight group and tilapia that received multiple bacterial infections had the highest increase in lymphocyte count after the challenge test. According to Martins, et al. [16], lymphocytes have been reported as immunocompetent cells. Slight reductions in percent monocyte count were observed across weight groups and level of bacterial infections after challenge test, and statistical analysis showed no significant difference (p>0.05). Percent reduction rate in percent monocyte count was more evident in fish exposed in single infection, especially in P. rettgeri.
Two-way Analysis of Variance revealed that the interaction effect of different tilapia weight groupings and level of bacterial infections showed no significant effect on TWBC and differential WBC of the experimental fish (p>0.05).
References
-
Duijn Van C (1973) Diseases of Fishes. ILIFFE Books, Ltd. UK, pp: 372.
-
Carraschi SP, Claudinei CD, Joaquim JMN, Flávio RDM, Oswaldo DRJ (2012) Evaluation of experimental infection with _Aeromonas hydrophila_ in Pacu (_Piaractus_ _mesopotamicus_) (Holmberg, 1887). International Journal of Fisheries and Aquaculture 4(5): 81-84.
-
Shayo SD, Mwita CJ, Hosea K (2012) Ulcerative _Aeromonas_ infections in tilapia (Cichlidae: Tilapiini) from Mtera Hydropower Dam, Tanzania. Open Access Scientific Reports, pp: 1-4.
-
Igbinosa IH, Ehimario U, Igumbor, Aghdasi F, Tom M, Okoh AI (2012) Emerging _Aeromonas_ species infections and their significance in public health. Scientific World Journal 2012: 625023.
-
Cipriano RC (1984_) Aeromonas hydrophila_ and motile aeromonad septicemias of fish, pp: 9-25.
-
Buller NB (2004) Bacteria from fish and other aquatic animals: A practical identification manual. CABI Publishing. Massachusetts USA, pp: 361.
-
Pilar González-Párraga, Alberto Cuesta, Meseguer J, Ángeles Esteban M (2011) Marine microorganisms: the world also changes. A. Méndez-Vilas (Edn), pp: 1- 12.
-
Al-Zubaydi ZH (2013) White blood cells (WBCs) or leukocytes. Medical Physiology, pp: 1-5.
-
Davis AK, Maney DL, Maerz JC (2008) The use of leukocyte profiles to measure stress in vertebrates. A review for ecologists. Functional Ecology 22: 760- 772.
-
Jamalzadeh HR, Keyvan A, Ghomi MR, Gherardi F (2009) Comparison of blood indices in healthy and fungal infected Caspian salmon (_Salmo trutta caspius_). African Journal of Biotechnology 8(2): 319-322.
-
Summarwar S, Santosh V (2012) Study of selected haematological indeces of freshwater fish from Bisalpur Reservoir. Indian Journal of Fundamental and Applied Life Sciences 2: 51-54.
-
Shoemaker CA, De-Hai X, Klesius P, Evans J (2013) Concurrent infections (parasitism and bacterial disease) in tilapia. Aquatic Animal Health Research, pp: 1365-1375.
-
Angeles IP (2004) Assessment of the inhibitory effect of selected botanicals against some bacteria in Nile tilapia (_Oreochromis niloticus_). Undergraduate thesis. Department of Aquaculture, College of Fisheries, Central Luzon State University, pp: 73.
-
Heiserman DL (2004) Methods of hematology.
-
Chunwang Li, Yuan Gu, Songhua Tang, Hongxia Fang, Guohua Jiang, et al. (2011) Effects of acute low temperature stress on the endocrine reactions of the Qinghai toad-headed lizard. Current Zoology 57(6): 775-780.
-
Martins ML, Mouriño JL, Amaral GV, Vieira FN, Dotta G, et al. (2008) Haematological changes in Nile tilapia experimentally infected with _Enterococcus_ sp. Braz J Biol 68(3): 657-661.
- Gallic and Citric Acid Present in the Peels of Tropical Fruits as an Alternative in the Fight against Cancer
- Treating the Forehead Lines with Combination of Forehead and Glabellar Botulinum Toxin Among Japanese Patients
- Clinical Evaluation of Patients Suffering from Breast Cancer & Determination of Treatment Therapies and Better Strategies Related to Breast Cancer
- Medieval Recipes by Al-Zahrāwī for Heart Palpitations Treatment
- Etiology and Prescription Errors of Myocardial Infarction in Different Health Care Systems of Azad Kashmir
- Early Diagnosis and Multidisciplinary Management of Turner Syndrome: A Paediatric Case Study