Adverse Effects of Bisoprolol in Rats
The present study was designed to investigate the adverse effect of Bisoprolol and protective effect of Vitamin E and To Show the result of the combination between Bisorprolol and Vit. E on hepatic and renal disturbance induced in rats by Bisorprolol. Experimental design: After one week of acclimatization, eighty rats randomly allocated into 4 equal groups, each of 20 rats. The 1st group: Rats in this group were not medicated and left as control and received Nacl as avehicle. The 2nd group (VE): Rats in this group treated with vitamin E (1.8mg/kg b.wt. once daily) per os for Successive 21 days. The 3rd group (B): Rats in this group treated orally with Bisoprolol (1.8mg/kg b.wt. once daily) for successive 21 days as standard. The 4th group (VE+B): Rats in this group received orally a combination of vitamin E (1.8mg/kg b.wt. once daily) with Bisoprolol (1.8mg/kg b.wt. once daily) for Successive 21 day. At the end of the experiment, all rats were sacrificed, Liver and kidney samples were taken and blood was taken to centrifuged to gain serum for biochemical investigations. Effect of Bisoprolol, Vit.E and their combination on liver parameter (ALT, AST, ALP, Total serum proteins, Serum albumin, serum globulin). Oral administration of Bisoprolol (1.8mg/kg b.wt. once daily for 21 days) Showed a significant increase in (ALT, AST, ALP) while total serum proteins, serum albumin, and serum globulin showed a significant decrease compared with control group. Administration of Vit.E (1.8mg/kg b.wt. once daily for 21 days) and its combination with Bisoprolol (1.8mg/kg b.wt. once daily for 21 days) showed a decrease in (ALT, SAT, ALP) while total serum proteins, serum albumin, and serum globulin showed an increased compared with Bisoprolol group. 2- Effect of Bisoprolol, Vit.E and their combination on kidney parameters (creatinine and uric acid). Oral administration of bisoprolol (1.8mg/kg b.wt. once daily for 21 days) Showed a significant increase in (Creatinine and uric acid) compared with control group. Administration of Vit E (1.8mg/ kg b.wt. once daily for 21 days and its combination with bisoprolol (1.8mg /kg b.wt. once daily for 21 days) Showed a decrease in (creatinine and uric acid compared with bisoprolol group. 3- Effect of Bisoprolol and vit. E on antioxidant activites a- CAT, SOD and GPX activity Administration of Bisoprolol (1.8mg/kg b.wt. once daily for 21 days) showed a significant decrease in CAT, SOD and GPX activity compared with control group. Administration of Vit.E (1.8mg/kg b.wt. once daily for 21 days) and its combination with bisoprolol showed a significant increase in CAT, SOD and GPX activity compared with bisoprolol group. b- Lipid peroxidation (MDA) Oral administration of bisoprolol (1.8mg/kg b.wt. once daily for 21 days) showed a significant increase in MDA activity compared with control group. Administration of Vit E (1.8mg/kg b.wt. once daily for 21 days) and its combination with bisoprolol Showed asignificant decrease in MDA activity compared with bisoprolol group. 4- Histopathological finding. a- Histopathological finding in liver. Histopathological Results in 1st day after administration with bisoprolol showing mild to moderate congestion of hepatic blood vessels, portal biliary proliferation, round cells aggregations and fibroplasia in addition to minute interstitial aggregation of round cells. After administrated with bisoprolol and vit E showed apparently normal hepatic parenchyma, however the portal areas showed aggregations of round cells and mild biliary proliferation. The hepatic sinusoids revealed mild lymphocytosis and the kupffer cells were 7th day after administrations with bisoprolol showing sever congestion of hepatic blood vessels, portal biliary hyperplasia and round cells aggregations. After administrated with bisoprolol and vit E showed normal hepatic parenchyma. However, mild congestion of portal blood vessels with biliary proliferation and round cells aggregations were seen. The kupffur cells were prominantanly hypertrophied. b- Histopathological finding in kidney In 7th day after administration with bisoprolol showing congested renal blood vessels with peri vascular edema, multi focal necrosis of renal tubules. After administrated with bisoprolol and vit. E showed apparently normal renal parenchyma with focal interstitial round cells aggregation, mild degenerative changes in some renal tubular epithelium and intratubular hyaline casts in some tubules.
Introduction
Bisoprolol, an antagonist of β1-adrenergic receptors, is effective in reducing the morbidity and mortality in patients with heart failure (HF). It has been found that HF is accompanied with dysfunction of the sinoatrial node (SAN). However, whether bisoprolol reverses the decreased SAN function in HF and how the relevant ion channels in SAN change were relatively less studied. SAN function and messenger RNA (mRNA) expression of sodium channels and hyperpolarization-activated cyclic nucleotide-gated (HCN) channel subunits were assessed in shamoperated rats, abdominal arterio-venous shunt (volume overload)-induced HF rats, and bisoprolol- treated HF rats. SAN cells of rats were isolated by laser capture microdissection. Quantitative real-time PCR analysis was used to quantify mRNA expression of sodium channels and HCN channel subunits in SAN. Intrinsic heart rate declined and sinus node recovery time prolonged in HF rats, indicating the suppressed SAN function, which could be improved by bisoprolol treat- ment. Navl.l, Navl.6, and HCN4 mRNA expressions were reduced in SAN in HF rats compared with that in control rats [1]. Treatment with bisoprolol could reverse both the SAN function and the Navl.l, Navl.6, and HCN4 mRNA expression partially. These data indicated that bisoprolol is effective in HF treatment partially due to improved SAN function by reversing the down-regulation of sodium channels (Navl.l and Navl.6) and HCN channel (HCN4) subunits in SAN in failing hearts [1]. Heart failure (HF) is a major public health issue, with a high prevalence, poor clinical outcomes, and huge health care costs. Sudden cardiac death accounts for 50 % of deaths in patients with HF [2]. Although most sudden deaths in chronic HF could be attributed to ventricular arrhythmias, bradyarrhythmias also accounted for up to 42 % of sudden deaths in hospital [3]. Clinically, patients with HF share slower intrinsic heart rates [4], increased corrected sinoatrial node (SAN) recovery time (SNRTc), and abnormal propagation of the action potentials from the SAN, suggesting that SAN function is affected by HF [5].
Aim of Work
The present study was designed to investigate effect of Bisoprolol on kidney and liver in rats. Determine the protective effect of vitamin E through measuring of: Some liver and kidney functions, antioxidant activity, as well as histopathological findings. 1) Biochemical constituents in sera such as: Serum alanine aminotransferase (ALT), aspartate aminotransferase (AST), alkaline phosphate (ALP), total protein, albumin and globuline. a) Serum creatinine and uric acid, b) Catalase (CAT), d) Superoxide dismutase (SOD), e) Glutathione peroxidase (GPX). f) Malondialdehyde (MDA) (marker of lipid peroxidation). 2) Histopathology of liver and kidney.
Materials and Method
Material
- Drugs: Bisoprolol, marketed under the trade name (Zebeta) among others, is a medication most commonly used for heart diseases. This specifically includes high blood pressure, chest pain from not enough blood flow to the heart, and heart failure. It is taken by mouth.
- Structural formula:
Absorption is not affected by food. Peak plasma concentrations occur within 2-4 hours. • The recommended dose for rats is 1.8 mg according to Paget and Barnes. Vitamin E (Vitamin E capsules ®): Structural formula
![Figure 1: Structural formula [6]_._ • Dose: 10 mg/ day recommended dose for humans per os. • **Absorption:** Well absorbed. Bioavailability > 80%.](/fulltextimages/4248/fig_1.jpeg)
Experimental Animals
Eighty rats weighed (180 ± 20 gm.) were used in this study were obtained from the laboratory farm of Faculty of Vet. Medicine and allowed to acclimatize for one week at the animal house before starting the' experiments. the rats were randomly assigned into four equal groups, twenty rats each and kept in a cage for each group, maintained at a 12 hour light dark cycle and of a constant temperature of Rats received regular basic ration and water was provided ad.lib, the experimental protocols were approved by the ethics of Faculty of Veterinary Medicine, Zagazig University, Egypt.
Methods
Experimental Design: Eighty rats, weighed (180 ± 20 gm) were used in this study, the rats were divided into four equal groups each of 20 rats, they were kept under hygienic conditions and feed on basic ration free from any medications or chemicals ad.lib and water was provided. Groups divided as follow: Group one (Control group): Non treated rats in the first group received no drugs and remained as control group. Group two: Treated rats with 1.8 mg/kg b.wt. of Vitamin E orally which is the calculated therapeutic dose of the drug. Group three: Treated rats with 1.8 mg/kg b.wt. of Bisoprolol per os. Group four (Combination group): Treated rats with 1.8 mg/kg b.wt. of Vitamin E and 1.8 mg/kg b.wt. of Bisoprolol as a combination therapy per os. Drugs were given to rats early in the morning orally once daily for a successive 21 days. Collection of Samples: A) Blood Samples Collection: Blood was collected at 1st, 7th and 14th day of the experimental period. Five rats from each group were used for collection of blood samples in clean and dry bottles. The blood samples were taken from each group, for biochemical studies. The sample was collected without anticoagulant for separation of clear serum for biochemical analysis, each blood sample was collected in centrifuge tubes and left in slope position to clot at room temperature. Serum was centrifuged at 3000 rpm for 10 min for separation of clear serum, serum samples were put in clean dry vials and used for determination of Liver and Kidney function tests. Anti oxidant enzymes and MDA. B) Histopathological samples collection: Liver and Kidney samples from all groups were immediately removed and kept in 10% neutral formalin and processed in paraffin wax. Sections of 5 microns thickness were stained with Hematoxylin and Eosin and examined microscopically according to Bancroft & Gamble [9].
Laboratory assay: 1) Serum biochemical analysis: a) Liver function tests: a. Estimation of alanine transaminase activity of (ALT): b) AL T was estimated according to Reitman &Frankel [10] a. Estimation of Aspartate Transaminase activity of (AST): c) AST was estimated according to Reitman & Frankel [10] a. Estimation of Alkaline phosphatase (ALP): d) Colorimetric determination of ALP was performed according to the method of Kind & King [11] which is based on the following reaction. a. Estimation of serum total protein: e) Total protein was estimated according to Grant, et al.
[12]. a. Estimation of serum albumin : f) Albumin was determined according to Doumas, et al.
[13]. g) = 2) Kidney function tests a. Estimation of serum creatinine: Estimation of serum creatinine is accomplished by photometric colorimetric test for kinetic measurements, without deproteinization according to Henry [14]. b. Determination of serum uric acid : Colorimetric determination of serum uric acid was performed according to the method of Artiss [15]. 3) Antioxidant enzyme activities: a. Estimation of Catalase activity: Catalase activity was determined colorimetrically m tissue homogenate according the method described by Aebi [16]. b. Estimation of Superoxide dismutase activity:
Superoxide dis mutase activity was determined in tissue homogenate according to the method described by Nishikimi, et al. [17]. c. Estimation of glutathione peroxidase activity:
Glutathione peroxidase activity in tissue homogenate was determined according to the method adapted by Paglia & Valentine [18]. d. Estimation of Malondialdhyde (MDA) activity:
Malondialdhyde activities were determined according to the method adapted by Ohkawa, et al. [19]. e. Histopathology: Bancroft & Gambl [9]. Statistical analysis: In order to assess the influence of Vitamin E, Bisoprolol and their combination on some biochemical parameters at 1st, 7th and 14th day post treatment, one-way analysis of variance (ANOV A), followed by Tukey's Honestly Significant Difference (Tukey's HSD) test as post hoc test was used. Analysis was done using Statistical Package for Social Sciences version 22.0 (IBM Corp., Armonk, NY, USA). Results were reported in means ± SEM (Standard Error of Mean). The value of P < 0.05 was used to indicate statistical significance.
Results
Biochemical studies - Liver function test Effect on serum ALT
It was clearly evident from (Table 1) that the administration of Bisoprolol in therapeutic dose for 21 successive days to rats resulting in a significant increase in ALT level after one day post-administration when compared with control group but this elevation decrease gradually by time.
| ALT (U/L) | |||
|---|---|---|---|
| 1st day | 7th day | 14th day | |
| Control | 14.66 c ±.881 | 13.66 c ±.881 | 16.00 c ±.577 |
| Vit. E | 14.33 c ±1.45 | 13.33 c ±1.45 | 15.00 c ±.577 |
| Bisoprolol | 56.33 a ±1.20 | 43.00 a ±1.15 | 34.66 a ±1.45 |
| Bisoprolol + Vitamin E | 43.00 b ±1.15 | 34.33 b ±1.45 | 24.00 b ±2.08 |
Table 1: Effects of Bisoprolol, Vitamin E and their combination on ALT (U/L) at 1st, 7th and 14th day post- administration, (n
One way ANOVA results expressed as means ± SD. The different letters at the same column mean that there was a significant change at p<0.05. Table 1: Effects of Bisoprolol, Vitamin E and their combination on ALT (U/L) at 1st, 7th and 14th day post- administration, (n=5) in rats.
The administration of Bisoprolol and Vit. E combination in their therapeutic dose for 21 successive days to female rat resulting in decrease in ALT level after one day post-administration compared with Bisoprolol group.
Effect on Serum AST
It was clearly evident from (Table 2) that the administration of Bisoprolol in therapeutic dose for 21 successive days to rats resulting in a significant increase in AST level after one day post-administration when compared with control group but this elevation decrease gradually by time. The administration of Bisoprolol and Vit. E combination in their therapeutic dose for 21 successive days to female rat resulting in decrease in AST level after one day post-administration compared with Bisoprolol group.
| AST (U/L) | |||
|---|---|---|---|
| 1st day | 7th day | 14th day | |
| Control | 21.33 c ±.881 | 22.66 c ±.666 | 24.00 b ±1.52 |
| Vit. E | 21.33 c ±1.76 | 23.33 c ±1.45 | 22.66 b ±2.18 |
| Bisoprolol | 46.00 a ±1.52 | 37.66 a ±.881 | 30.66 a ±.333 |
| Bisoprolol + Vitamin E | 34.66 b ±1.76 | 29.66 b ±1.20 | 24.33 b ±1.20 |
Table 2: Effects of Bisoprolol, Vitamin E and their combination on AST (U/L) at 1st, 7th and 14th day post-administration, (n=
One way ANOVA results expressed as means ±SD. The different letters at the same column mean that there was a significant change at p<0.05. Table 2: Effects of Bisoprolol, Vitamin E and their combination on AST (U/L) at 1st, 7th and 14th day post-administration, (n=5) in rats. Effect on serum ALP: It was clearly evident from (Table 3) that the administration of Bisoprolol in therapeutic dose for 21 successive days to rats resulting in a significant increase in ALP level after one day post- administration when compared with control group but this elevatation decrease gradually by time.
| ALP (U/L) | |||
|---|---|---|---|
| 1st day | 7th day | 14th day | |
| Control | 123.33 c ±1.20 | 124.33 c ±2.40 | 123.66 b ±.881 |
| Vit. E | 123.00 c ±1.73 | 124.66 c ±2.027 | 123.66 b ±1.20 |
| Bisoprolol | 153.66 a ±1.76 | 145.33 a ±2.60 | 138.00 a ±2.30 |
| Bisoprolol + Vitamin E | 146.66 b ±1.76 | 133.66 b ±2.72 | 128.66 b ±1.20 |
Table 3: Effects of Bisoprolol, Vitamin E and their combination on ALP (U/L) at 1st, 7th and 14th day post-administration, (n=
One way ANOVA results expressed as means ±SD. The different letters at the same column mean that there was a significant change at p<0.05 Table 3: Effects of Bisoprolol, Vitamin E and their combination on ALP (U/L) at 1st, 7th and 14th day post-administration, (n=5) in rats.
The administration of Bisoprolol and Vit. E combination in their therapeutic dose for 21 successive days to rat resulting in decrease in ALP level after one day post-administration compared with Bisoprolol group. Effect on Total Protein: It was clearly evident from (Table 4) that the administration of Bisoprolol in therapeutic dose for 21 successive days to rats resulting in a significant decrease in total protein level after one day post-administration when compared with control group but this decrease elevate gradually by time. The administration of Bisoprolol and Vit. E combination in their therapeutic dose for 21 successive days to female rat resulting in increase in total protein level after one day post-administration compared with Bisoprolol group.
| Total protein (g/dl) | |||
|---|---|---|---|
| 1st day | 7th day | 14th day | |
| Control | 7.56 a ±.04 | 7.80 a ±.034 | 7.84 a ±.029 |
| Vit. E | 7.49 a ±.104 | 7.8367 a ±.05364 | 7.83 a ±.040 |
| Bisoprolol | 5.25 c ±.086 | 6.02 c ±.040 | 6.68 c ±.063 |
| Bisoprolol + Vitamin E | 6.33 b ±.073 | 6.89 b ±.097 | 7.11 b ±.106 |
Table 4: Effects of Bisoprolol, Vitamin E and their combination on Albumin (g/dl) at 1st, 7th and 14th day post- administratio
this decrease elevate gradually by time. The administration of Bisoprolol and Vit. E combination in their therapeutic dose for 21 successive days to rat resulting in increase in albumin level after one day post- administration compared with Bisoprolol group (Table 5).
| Albumin (g/dI) | |||
|---|---|---|---|
| 1st day | 7th day | 14th day | |
| Control | 5.00 a ±.057 | 4.94 a ±.041 | 4.98 a ±.026 |
| Vit. E | 5.01 a ±.043 | 4.94 a ±.094 | 5.02 a ±.020 |
| Bisoprolol | 3.11 c ±.031 | 3.86 c ±.040 | 4.12 c ±.070 |
| Bisoprolol + Vitamin E | 3.90 b ±.023 | 4.14 b ±.078 | 4.50 b ±.040 |
Table 5: Effects of Bisoprolol, Vitamin E and their combination on Albumin (g/dl) at 1st, 7th and 14th day post- administratio
One way ANOVA results expressed as means ±SD. The different letters at the same column mean that there was a significant change at p<o.os Table 5: Effects of Bisoprolol, Vitamin E and their combination on Albumin (g/dl) at 1st, 7th and 14th day post- administration, (n=5) in rats. Effect on Globulin: It was clearly evident from (Table 6) that the administration of Bisoprolol in therapeutic dose for 21 successive days to rats resulting in a significant decrease in globulin level after one day post- administration when compared with control group but this decrease elevate gradually by time. The administration of Bisoprolol and Vit. E combination in their therapeutic dose for 21 successive days to rat resulting in increase in globulin level after one day post- administration compared with Bisoprolol group.
| 1st day | 7th day | 14th day | |
| Control | 2.56 a | 2.86 a | 2.86 a |
| Control | ±.090 | ±.070 | ±.034 |
| Vit. E | 2.48 a | 2.89 a | 2.81 a |
| Vit. E | ±.101 | ±.145 | ±.055 |
| Bisoprolol | 2.13 b | 2.16 b | 2.56 a |
| ±.054 | ±.070 | ±.011 | |
| Bisoprolol + Vitamin E | 2.42 a | 2.75 a | 2.60 a |
| Bisoprolol + Vitamin E | ±.073 | ±.147 | ±.068 |
Table 6: Effects of Bisoprolol, Vitamin E and their combination on creatinine (mg/dl) at 1st, 7th and 14th day post- administr
Kidney Function Test
Effect on Serum Creatinine: It was clearly evident from (Tables 7) that the administration of Bisoprolol in therapeutic dose for 21 successive days to rats resulting in a significant increase in serum creatinine level after one day post-administration when compared with control group but this decrease elevate gradually by time. The administration of Bisoprolol and Vit. E combination in their therapeutic dose for 21 successive days to rat resulting in decrease in serum creatinine level after one day post-administration compared with Bisoprolol group.
Effect on Serum Uric Acid: It was clearly evident from (Table 8) that the administration of Bisoprolol in therapeutic dose for 21 successive days to rats resulting in a significant increase in serum uric acid level after one day post-administration when compared with control group but this decrease elevate gradually by time. The administration of Bisoprolol and Vit. E combination in their therapeutic dose for 21 successive days to rat resulting in decrease in serum uric acid level after one day post-administration compared with Bisoprolol group.
| Creatinine (mg/dI) | |||
|---|---|---|---|
| 1st day | 7th day | 14th day | |
| Control | 0.633 c ±.020 | 0.710 b ±.011 | 0.756 b ±.012 |
| Vit. E | 0.646 c ±0.017 | 0.723 b ±0.008 | 0.756 b ±0.017 |
| Bisoprolol | 1.39 a ±0.094 | 1.14 a ±0.037 | 1.01 a ±0.032 |
| Bisoprolol + Vitamin E | 1.05 b ±0.029 | 0.863 b ±0.024 | 0.800 b ±0.020 |
Table 7: Effects of Bisoprolol, Vitamin E and their combination on creatinine (mg/dl) at 1st, 7th and 14th day post- administr
One way ANOVA results expressed as means ±SD. The different letters at the same column mean that there was a significant change at p<0.05. Table 7: Effects of Bisoprolol, Vitamin E and their combination on creatinine (mg/dl) at 1st, 7th and 14th day post- administration, (n=5) in rats.
| Uric acid (mg/dl) | |||
|---|---|---|---|
| 1st day | 7th day | 14th day | |
| Control | 6.13 c ±0.228 | 5.18 c ±0.044 | 5.51 b ±0.081 |
| Vit. E | 5.91 c ±0.610 | 5.12 c ±0.064 | 5.66 b ±0.059 |
| Bisoprolol | 18.48 a ±0.379 | 12.95 a ±0.439 | 9.20 a ±0.430 |
| Bisoprolol + Vitamin E | 12.57 b ±0.700 | 8.96 b ±0.424 | 6.90 b ±0.290 |
Table 8: Effects of Bisoprolol, Vitamin E and their combination on uric acid (mg/dl) at 1st, 7th and 14th day post- administra
One way ANOVA results expressed as means ±SD. The different letters at the same column mean that there was a significant change at p<0.05 Table 8: Effects of Bisoprolol, Vitamin E and their combination on uric acid (mg/dl) at 1st, 7th and 14th day post- administration, (n=5) in rats.
Antioxidant Enzymes Activity
Effect on Catalase Activity (CAT): It was clearly evident from (Table 9) that the administration of Bisoprolol in therapeutic dose for 21 successive days to rats resulting in a significant decrease in catalase activity after one day post-administration when compared with control group but this decrease elevate gradually by time. The administration of Bisoprolol and Vit. E combination in their therapeutic dose for 21 successive days to rat resulting in increase in catalase activity after one day post-administration compared with Bisoprolol group. Effect on Superoxide Dismutase Activity (SOD): It was clearly evident from (Table 10) that the administration of Bisoprolol in therapeutic dose for 21 successive days to rats resulting in a significant decrease in superoxide dismutase activity after one day post-administration when compared with control group but this decrease elevate gradually by time. The administration of Bisoprolol and Vit. E combination in their therapeutic dose for 21 successive days to rat resulting in decrease in superoxide dismutase activity after one day post- administration compared with Bisoprolol group. Effect on Glutathione peroxidase activity (GPX): It was clearly evident from (Table 11) that the administration of Bisoprolol in therapeutic dose for 21 successive days to rats resulting in a significant decrease in glutathione peroxidase activity after one day post-administration when compared with control group but this decrease elevate gradually by time.
| CAT (U/L) | |||
|---|---|---|---|
| 1st day | 7th day | 14th day | |
| Control | 206.66 a ±2.38 | 214.86 a ±1.22 | 216.42 a ±0.890 |
| Vit. E | 208.74 a ±2.58 | 216.97 a ±0.931 | 218.17 a ±1.16 |
| Bisoprolol | 171.51 c ±0.965 | 189.84 c ±.763 | 201.54 c ±2.77 |
| Bisoprolol + Vitamin E | 185.83 b ±0.534 | 201.77 b ±3.67 | 209.55 b ±1.23 |
Table 9: Effects of Bisoprolol, Vitamin E and their combination on catalase (U/L) at 1st, 7th and 14th day post- administratio
One way ANOVA results expressed as means ±SD. The different letters at the same column mean that there was a significant change at p<0.05. Table 9: Effects of Bisoprolol, Vitamin E and their combination on catalase (U/L) at 1st, 7th and 14th day post- administration, (n=5) in rats.
| 1st day | 7th day | 14th day | |
| Control | 3.26 a | 3.84 a | 3.11 a |
| Control | ±.433 | ±.043 | ±.012 |
| Vit. E | 3.88 a | 3.81 a | 3.23 a |
| Vit. E | ±.053 | ±.138 | ±.088 |
| Bisoprolol | .95 b | 1.65 c | 2.05 c |
| Bisoprolol | ±.035 | ±.076 | ±.081 |
| Bisoprolol + Vitamin E | 1.20 b | 2.10 b | 2.42 b |
| Bisoprolol + Vitamin E | ±.049 | ±.120 | ±.104 |
Table 10: Effects of Bisoprolol, Vitamin E and their combination on superoxide dismutase (U/ml) at 1st, 7th and 14th day post-a
One way ANOVA results expressed as means ±SD. The different letters at the same column mean that there was a significant change at p<0.05. Table 10: Effects of Bisoprolol, Vitamin E and their combination on superoxide dismutase (U/ml) at 1st, 7th and 14th day post-administration, (n=5) in rats.
| GPX ( U /ml) | |||
|---|---|---|---|
| 1st day | 7th day | 14th day | |
| Control | 134.31 a ±2.53 | 134.83 a ±1.81 | 134.83 a ±.815 |
| Vit. E | 134.96 a ±1.38 | 134.10 a ±1.81 | 133.88 a ±1.52 |
| Bisoprolol | 89.55 c ±1.52 | 101.54 c ±5.54 | 115.03 c ±4.41 |
| Bisoprolol + Vitamin E | 104.89 b ±3.29 | 113.69 b ±2.47 | 124.34 b ±1.67 |
Table 11: Effects of Bisoprolol, Vitamin E and their combination on glutathione peroxidase (U /ml) at 1st, 7th and 14th day pos
One way ANOVA results expressed as means ±SD. The different letters at the same column mean that there was a significant change at p<0.05. Table 11: Effects of Bisoprolol, Vitamin E and their combination on glutathione peroxidase (U /ml) at 1st, 7th and 14th day post-administration, (n=5) in rats.
The administration of Bisoprolol and Vit. E combination in their therapeutic dose for 21 successive days to rat resulting in decrease in glutathione peroxidase activity after one day post-administration compared with Bisoprolol group. Effect on MDA Activity: It was clearly evident from (Table 12) that the administration of Bisoprolol in therapeutic dose for 21 successive days to rats resulting in a significant increase in MDA activity after one day post-administration when compared with control group but this decrease elevate gradually by time. The administration of Bisoprolol and Vit. E combination in their therapeutic dose for 21 successive days to rat resulting in decrease in MDA activity after one day post- administration compared with Bisoprolol group (Table 12).
| MDA (nmol/ml) | |||
|---|---|---|---|
| 1st day | 7th day | 14th day | |
| Control | 10.77 c ±0.865 | 12.63 c ±0.538 | 13.52 c ±0.487 |
| Vit. E | 10.01 c ±0.661 | 11.71 c ±1.24 | 12.57 c ±0.786 |
| Bisoprolol | 33.92 ±2.38 | 26.04 a ±2.64 | 21.29 a ±0.705 |
| Bisoprolol + Vitamin E | 24.01 b ±1.74 | 16.77 bc ±2.10 | 15.97 bc ±0.482 |
Table 12: Effects of Bisoprolol, Vitamin E and their combination on MDA (nmol/ml) at 1st, 7th and 14th day post- administration
One way ANOVA results expressed as means ±SD. The different letters at the same column mean that there was a significant change at p<0.05 Table 12: Effects of Bisoprolol, Vitamin E and their combination on MDA (nmol/ml) at 1st, 7th and 14th day post- administration, (n=5) in rats.
sinusoids, portal triads structures and stromal components. 2. Kidney: Sections from kidney revealed normal nephron units with preserved renal papillae, renal pelvis and stromal structures (Figure 3).
B- Histopathologic studies (7th day)
Rats Of Control Group (Not Treated): 1. Liver: Examined sections from liver showing apparently normal hepatic parenchyma with preserved lobular pattern, cords arrangement, central veins,
![Figure 2: Structural formula of Vitamin E [7]_._ • Molecular Formula: C29H50O2. • Molecular weight: 430.717 g/moL • Dose: oral intake of (100 mg/kg b.wt.) for human dissolved in corn oil once daily for 21 successive days [8].](/fulltextimages/4248/fig_2.jpeg)
Rats Treated with Vitamin E: 1. Liver: Examined sections from liver showing apparently normal hepatic parenchyma with preserved lobular pattern, cords arrangement, central veins, sinusoids, portal triads structures and stromal components. 2. Kidney: Sections from kidney revealed normal nephron units with preserved renal papillae, renal pelvis and stromal structures (Figure 4).
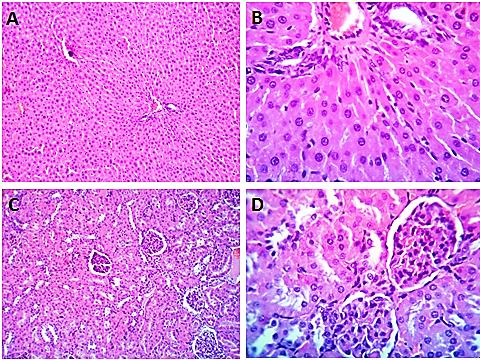
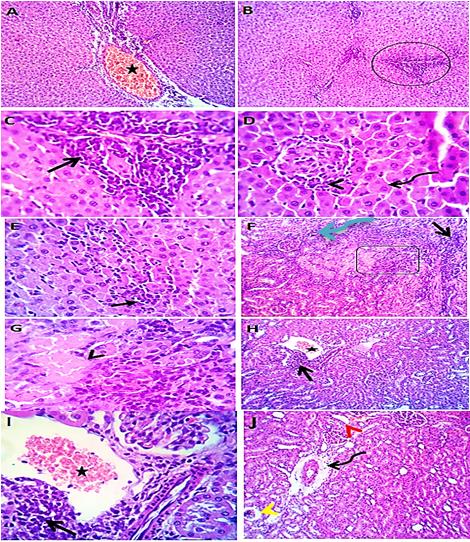
Rats Treated with Bisoprolol 1. Liver: Liver sections revealed moderate to severe congestion of hepatic blood vessels, portal biliary hyperplasia and round cells aggregations, the latter were seen also in the interstitial tissue. The kupffer cells were prominently hypertrophied. Some hepatic cells showed cloudy swelling or hydropic degeneration. 2. Kidney: Characterstic renal lesions were seen in the form of congested renal blood vessels with perivascular edema, multifocal interstitial round cells aggregations and focal co-agulative necrosis of the renal tubules.
Perivascular and periglomerular round cells aggregations were also detected. Some glomeruli were lobulated or shrinked. Some tubules particularly in the cortex were cystically dilated and others showed hyaline casts (Figure 5)
Rats treated with Bisoprolol + vitamin E: 1. Liver: Liver sections revealed normal hepatic parenchyma. However, mild congestion of portal blood vessels with biliary proliferation and round cells aggregations were seen. The kupffur cells were prominantanly hypertrophied.
2. Kideny: Examined sections from kidney showed apparently normal renal parenchyma with focal interstitial round cells aggregation, mild degenerative changes in some renal tubular epithelium and intratubular hyaline casts in some tubules (Figure 6).
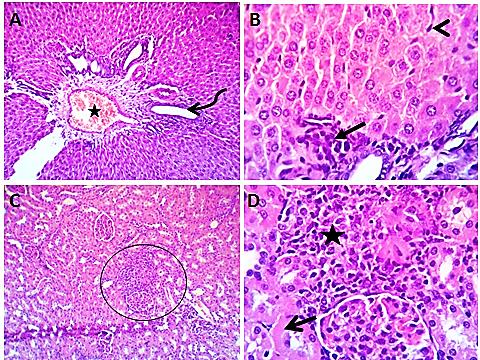
Figure 6: Photomicrograph of liver (A & B) showing normal hepatic parenchyma with mild congestion of portal blood vessels (star), biliary proliferation (curved arrow), round cells aggregations (closed arrow) and hypertrophied kupffur cells (arrow head). Kidney (C & D) showing apparently normal renal parenchyma with focal interstitial round cells aggregation (star), mild degenerative changes in some renal tubular epithelium (open arrows). H&E X 100 (A,C), 400 (B,D).
Discussion
The present study was designed to investigate the adverse effect of Bisoprolol and protective effect of vitamin E against hepatic and renal disturbance included in rats by Bisoprolol. In this study Bisoprolol is used in dose (1.8mg/kg b.wt.) once daily for successive 21 days. Liver enzymes such as ALT, AST and ALP are known marker enzymes for the assessment of the functional integrity of the liver cells. The results suggested that the administration of Bisoprolol in therapeutic dose for 21 successive days to rats resulting in a significant increase in ALT level after one day post-administration when compared with control group but this elevation decrease gradually by time. The administration of Bisoprolol in therapeutic dose for 21 successive days to rats resulting in a significant increase in AST level after one day post- administration when compared with control group. The administration of Bisoprolol in therapeutic dose for 21 successive days to rats resulting in a significant increase in ALP level after one day post-administration when compared with control group. The administration of bisoprolol in therapeutic dose for 21 successive days to female rats resulting in a significant decrease in total protein level after one day post-administration when compared with control group. The administration of bisoprolol in therapeutic dose for 21 successive days to rats resulting in a significant decrease in albumin level after one day post-administration when compared with control group. The administration of bisoprolol in therapeutic dose for 21 successive days to rats induced a significant decrease in Globulin level after one day post- administration when compared with control group. Our results are in harmony with the results reported by Allen, et al. [20]. who found that the effect of bisoprolol included decrease in albumin. Histopathological Results in 1st day after administration with bisoprolol showing mild to moderate congestion of hepatic blood vessels, portal biliary proliferation, round cells aggregations and fibro plasia in addition to minute interstitial aggregation of round cells. In 7th day after administration showing sever congestion of hepatic blood vessels, portal biliary/ hyperplasia and round cells aggregations. In 14th day after administration showing multi focal interstitial round cells aggregations with replacement of hepatocyte. Multi focal necrosis of hepatic parenchyma. The results suggested that administration of bisoprolol in the therapeutic dose for 21 successive days to rats resulting in a significant increase in serum creatinine level after one day post- administration when compared with control group. The administration of bisoprolol in therapeutic dose for 21 successive days to rats resulting in a significant increase in serum uric acid level after one day post-administration when compared with control group. Our results are in harmony with the results reported by Allen, et al. [20]. Who found that the effect of bisoprolol included increase creatinine and uric acid. Histopathological results in 1st day after administration with bisoprolol showing moderate congestion of the renal blood vessels, perivascular edema and degenerative changes in a moderate number of renal tubular. In 7th day after administration showing congested renal blood vessels with perivascular edema, multi focal necrosis of renal tubules. In 14th day week after administration showing moderate congestion of renal blood vessels and capillaries, perivascular edma, degenerative changes in the renal tubular epithlium mainly cloudy swelling and hydropic degeneration beside hyaline casts in some renal tubules. Our results are in harmony with the results reported by Reubi. Who found that the general mechanisms that cause renal disturbance included change in renal blood vessels, renal tubular epithelium capillaries. The results suggested that administration of bisoprolol in therapeutic dose for 21 successive days to rats resulting in a significant decrease in catalase activity after one day post-administration when compared with control group.
The administration of bisoprolol in therapeutic dose for 21 successive days to rats resulting in a significant decrease in superoxide dismutase activity after one day post-administration when compared with control group. The administration of bisoprolol in therapeutic dose for 21 successive days to rats resulting in a significant decrease in Glutathione peroxidase activity after one day post-administration when compared with control group. The administration of bisoprolol in therapeutic dose for 21 successive days to rats resulting in a significant increase in MDA activity after one day post- administration when compared with control group. Drugs and some chemical agents are known to induce hepatic and renal disturbance in human. Chemical agent are screened daily for their hepatoprotective and nephro- protective properities, for example Vit. E. It is one of the most important antioxidant drugs due to its hepato- nephroprotective properties as reported by researches. This study demonstrated the hepato- nephroprotective effect of Vit. E. Vit. E has hepatoprotective effect as it expresses important functions in the membranes;
preventing ROS damage in polyunsaturated fatty acids a lipid soluble antioxidant and acting against damage caused to phospholipids as a membrane – stabilizing agent. Additionally, Vit. E is known to act by breaking the antioxidant chain that prevent ROS- produced cell membrane. It decreases lipid peroxidation and protects against liver injury. It decrease liver fibrosis, tumor necrosis factors, inflammation and hepatic porphyrin [21].
The previous observation explained the hepatoprotective effects of Vit. E. observed in the present study. Vit. E. normalized levels of alanine amintransferase, aspartate aminotransferase, alkaline phosphatase, serum bilirubin, glutathione peroxidase superoxide dismutase, malondialdehyde and improved histopathological changes in the liver induced by chemical agents in the control group. The possible pathway can be explained through the structure of Vit. E, the side chain in the 2- position facilitates the incorporation and retention of Vit. E in bio membranes so that the 6- position is optimal for scavenging free radicals and terminating lipid peroxidation. Furthermore, its antioxidant activity is exhibited through protection of poly unsaturated fatty acid from oxidation by reactive oxygen species, stabilization of membrane and breaking of antioxidant chains that prevent reactive oxygen species damage to membranes. In the present study, Vit. E used in a dose (1.8 mg/kg b.wt.) once daily for 21 days. The administration of bisoprolol and Vit. E combination in their therapeutic dose for 21 successive days to rat resulting in decrease in ALT level after one day post- administration compared with bisoprolol group. The administration of bisoprolol and Vit. E combination in their therapeutic dose for 21 successive days to rat resulting in decrease in AST level after one day post- administration compared with group. The administration of bisoprolol and Vit. E combination in their therapeutic dose for 21 successive days to rat resulting in decrease in ALP level after one day post-administration compared with bisoprolol. The administration of bisoprolol and Vit. E combination in their therapeutic dose for 21 successive days to rat resulting in increase in total protein level after one day post-administration compared with bisoprolol. The administration of bisoprolol and Vit. E combination in their therapeutic dose for 21 successive days to rat resulting in increase in albumin level after one day post- administration compared with bisoprolol. The administration of bisoprolol and Vit. E combination in their therapeutic dose for 21 successive days to rats induced a significant increase in globulin level after one week post-administration when compared with control and bisoprolol group. Sanchez-Valle, et al. [22] reported the anti- oxidative therapy, mainly using natural and syntestic antioxidants, represents a reasonable therapeutic approach for the prevention and administration of liver diseases due to the role of oxidative stress in contributing to initiation and progression of hepatic damage.
Medina & Moreno Otera [23] reported that the antioxidant therapy has been considered to have the possibility of beneficial effects in the management of theses liver diseases; antioxidant have produced mixed results in a number of clinical trials of efficacy. Parola, et al. [24] reported that hepatoprotective effects of Vit. E against malathion- induced mitochondrial dysfunction in rat liver. Meagher, et al. [25] reported that hepatoprotective effects of Vit. E against malathion- induced mitochondrial dysfunction in rat liver. The results suggested that the administration of bisoprolol and Vit. E Combination in their their therapeutic dose for 21 successive days to rat resulting in decrease in serum creatinine level after one day post-administration compared with bisoprolol group. The administration of bisoprolol and Vit. E combination in their therapeutic dose for 21 successive days to rat resulting in decrease in serum uric acied level after one day administration compared with bisoprolol. Histopathological results in 1st day post-administration with bisoprolol showing moderate degenerative changes in renal tubular epithelium. In 7th day showing mild degenerative changes in renal tubular epithelium. In 14th day showing normal with mild congestion in renal bl.Vs.
The administration of bisoprolol and Vit. E Combination in their therapeutic dose for 21 Successive days to female rat resulting in increase in glutathione peroxidase activity afer one day post-administration compared with bisoprolol. The administration of bisoprolol and Vit. E Combination in their therapeutic dose for 21 successive days to rat resulting in decrease in MDA activity after one day administration compared with bisoprolol group. Beytut, et al. [26] reported that the increased level of antioxidant enzymes, CAT, SOD, GPX resulted from administration of Vit. E might normalized the lipid peroxidation reaction and related biochemical changes which in turn protects the cells from the increased risk of peroxidative damage as a result of administration of cytotoxic drugs. Kagan & Tyurins [27] reported that one of the ways in which a- tocopherol was believed to stabilize membranes to form a complex with the membrane lipids components that have ateendency to destabilize the bilayer structure theraby countering their effects and rendering the membrane more stable as also supported by the observed reduction of MDA and nitric oxide as well as increased glutathione. Another explanation of the action of Vit. E is the decrease of lipid peroxidation redical was suggested by Halliwell, et al. [28], [29] which suggested that administration of α- tocopherol averted oxidative damage, probably through its capacity to quickly and efficiently scavenge lipid peroxide radicals before they attack the membrane lipid. This ability might be related to the fact that lipid peroxy1 radicals react more rapidly (by four orders of magnitude) with α- tocopherol than with membrane lipids.
Conclusion
From the obtained results it could be concluded that bisoprolol has hepatic and renal disturbance effect in rats; Vit. E has a protective effect against hepatic and renal adverse effect of bisoprolol, which may attribute to decrease the harmful effects of bisoprolol inhibiting free radical formation and by restoration of the antioxidant systems. The combination of Vit.E and bisorprolol showed better results than Bisoprolol alone. So, bisoprolol should be used with caution in people with liver or kidney problems.
References
-
Du Y, Huang X, Wang T, Han K, Zhang J, et al. (2007) Downregulation of neuronal sodium channel subunits Navl.l and Navl.6 in the sinoatrial node from volume- overloaded heart failure rat. Pflugers Arch 454(3): 451-459.
-
Klein L, Hsia H (2014) Sudden cardiac death in heart failure. Cardiol Clin 32((1): 135-144.
-
Packer DL, Pmtkin JM, Hellkamp AS, Mitchell LB, Bernstein RC, et al. (2009) Impact of implantable cardioverter-defibrillator, amiodarone, and placebo on the mode of death in stable patients with heart failure: analysis from the sudden cardiac death in heart failure trial. Circulation 120: 2170-2176.
-
Verkerk AO, Wilders R, Coronel R, Ravesloot JH, Verheijck EE (2003) Ionic remodeling of sinoatrial node cells by heart failure. Circulation 108: 760-766.
-
Sanders P, Kistler, PM, Morton JB, Spence SJ, Kalman JM (2004) Remodeling of sinus node function in patients with congestive heart failure: reduction in sinus node reserve. Circulation 110(8): 897-903.
-
Harting JK, Hashikawa T, Vanliwshout D (1986) La Minar distribution of tectal parabigerinal and pretectal in puts to the primate dorsal lateral geaculate nucleus. Connetiosal studies in Galuga crascicawlagies. Brain Res 366: 358-363.
-
Richard AH (1995) Veterinary pharmacology and therapeutics. 7th (Edn.), Iowa state University Press, Ames.
-
Campo GM, Squadrito F, Ceccarell S, Calo M, Avenoso A, et al. (2001) Reduction of carbon tetrachloride- induced rat live injury by IRFI 042, a novel dual Vitamin E-like antioxidant. Free Radic Res 34(4): 379- 393.
-
Bancroft JD, Gamble M (2008) Theory and practice of histological techniques. 6th (Edn.), churchilliving stone, London.
-
Reitman S, Frankel S (1957) A colorimetric method for determination of serum glutamate oxaloacetate and glutamic pyruvate transaminase. Amer J Clin Path 28: 56-58.
-
Kind and King (1954) BRN and King EG: Colorimetric determination of ALP activity. J Clin Path 1: 322.
-
Grant GH, Siluerman LM, Christenson RH (1987) Amino acid and protein: fundamental of clinical chemistery 3rd (Edn.), Philadelphia WB Saunders Company.
-
Doumas BT, Basya DD, Carler RJ, Peler T, Schaffer R (1981) determination of serum albumin Clin Chern 27: 1642.
-
Henry TJ (1974) Determination of serum creatinine. Clin. Chern. Principles and Techniques 2nd (Edn.), Harper and Row Publishers. New York.
-
Artiss JD (1981) Colorimetric determination of uric acid Clio. Chern Acta 116: 301: 309.
-
Aebi H (1984) Colourimetrical determination of catalase activity. Methods enzymol 105: 121-126.
-
Nishikimi M, Roa NA, Yogi K (1972) Measurment of superoxide dismutase. Bioch Btoph Res Commun 46: 849-850.
-
Paglia DE, Valentine WN (1967) Studies on quantitative and qualitative characterization of erythrocyte glutathione peroxidase .J Lab Clin Med 70(1): 158-169.
-
Ohkawa H, Obisbi N, Yagi K (1979) Assay for lipid peroxidase in animal tissues by thiobarbituric acid reaction. Anal Biochemic 95(2): 351-358.
-
Allen LA, Felker GM, Pocock S, McMurray JJ, Pfeffer MA (2009) Liver function abnormalities and outcome in patients with chronic heart failure data from candes artan in heart failure. Assessment in morialily and morbidity (CHARM) program. Eur J Heart fail 11(2):170-177.
-
Bradford A, Atkinson J, Fuller N, Rand RP (2003) The effect of vitamin E on the structure of membrane lipid assemblies. J Lipid Res 44(10): 1940-1945.
-
Sanchez-Valle V, Chavez-Tapia NC, Uribe M, Mendez- Sanchez N (2012) Role of oxidative stress and molecular changes in liver fibrosis: Areview. Curr Med Chem 19(28): 4850-4860.
-
Medina J, Moreno-Otero R (2005) Pathophysiological basis for antioxidant therapy in chronic liver disease. Drugs 65(17): 2445-2461.
-
Parola M, Leonarduzzi G, Biasi F, Albano E, Biocca ME, et al. (1992) Vitamin E dietary supplementation protects against carbon tetrachloride-induced chronic liver damage and cirrhosis. Hepatol 16: 1014-1021.
-
Meagher EA, Barry OP, Lawson JA, Rokach J, Fitzgerald GA (2001) Effects of vitamin E on lipid peroxidation in healthy persons. JAMA 285(9): 1178- 1182.
-
Beytut E, Erisir M, Ahsakal M (2003) Effects of additional, Vitamin E and selenium supply on antioxidative defense mechanisms in the kidney of rats treated with high doses of giucocorticoid. Cell Biochem. Funct 22(1): 59-65.
-
Kagan VE, Tyurina YY (1998) Recycling and redox cycling of phenolic antioxidants, towards prolongation of the healthy life span. Ann NY Aced Sci 854(1): 425-34.
-
Halliwell B, Gutteridge JMC (2002) Free radicals in biology and medicine. Oxford Universit Press Inc., New York, pp. 105-245.
-
Packer M, Coats A, Fowler M, Michael BF, Hugo AK (2001). Effect of carvedilol on survival in severe chronic heart failure (COPERNICUS trial). N Engl J Med 344:1651-1658.
- Gallic and Citric Acid Present in the Peels of Tropical Fruits as an Alternative in the Fight against Cancer
- Treating the Forehead Lines with Combination of Forehead and Glabellar Botulinum Toxin Among Japanese Patients
- Clinical Evaluation of Patients Suffering from Breast Cancer & Determination of Treatment Therapies and Better Strategies Related to Breast Cancer
- Medieval Recipes by Al-Zahrāwī for Heart Palpitations Treatment
- Etiology and Prescription Errors of Myocardial Infarction in Different Health Care Systems of Azad Kashmir
- Early Diagnosis and Multidisciplinary Management of Turner Syndrome: A Paediatric Case Study