Adverse Effects of Ezapril in Rats
The present study was conducted to throw light on the adverse effect of Ezapril and the protective effect of vit. E and to show the result of the combination between Ezapril and Vit.E on nephrotoxicity and hepatotoxicity induced by Ezapril in rats. Experimental design: After one week of acclimatization, eighty albino rats randomly allocated into 4 equal groups, each of 20 rats. First group (control): rats werte in this group not medicated and served as a control and received normal saline. Second group (Ezapril): rats in this group received oral doses of Ezapril (0.36 mg/kg, P.O. once daily) for successive 21 days. Third group (Vit E): rats in this group received oral doses of Vit.E (1mg/kg, P.O. once daily) for successive21 days as standard anti oxidant. Fourth group (Vit.E +E): rats in this group received acombination of Vit.E (1mg /kg, P.O. once daily) with Ezapril (0.36 mg/kg, P.O. once daily for successive 21 days. At the end of the experiment, all rats were sacrificed, liver and kidney samples were taken and blood was taken and centrifuged to gain serum for liver parameters, kidney parameters and antioxidant enzymes investigations. The result was summarized as follow: 1.Effect of Ezapril, Vit.E and their combination on liver parameters (ALT, AST, ALP, total proteins and serum albumin). Oral administration of Ezapril (0.36 mg/kg, P.O. once daily for successive 21 days ) and administration of Vit.E (1mg /kg, P.O. once daily for successive 21 days showed non significant change in ALT, AST, ALP,Serum albumin but serum proteins showed asignificant decrease. 2. Effect of Ezapril, Vit.E and their combination on kidney parameters (urea and creatinine ). Oral administration of Ezapril (0.36 mg/kg, P.O. once daily for successive 21 days) showed asignificant increase in creatinine and urea level compared with control group. Administration of Vit.E (1mg/kg, P.O. once daily for successive 21 days showed a decrease in creatinine and urea compared with Ezapril group. 3. Effect of Ezapril and Vit.E on antioxidant enzyme activities. Oral administration of Ezapril (0.36 mg/kg, P.O. once daily for successive 21 days) produced asignificant decrease in CAT, SOD and GPX activity compared with control group. Administration of Vit.E (1mg/kg, P.O. once daily for successive 21 days showed a significant increase in CAT, SOD and GPX activity compared with Ezapril group. b) Lipid perioxidation (MDA) Oral Oral administration of Ezapril (0.36 mg/kg, P.O. once daily for successive 21 days) produced asignificant increase in MDA activity compared with control group. Administration of Vit.E (1mg/kg, P.O. once daily for successive 21 days showed a significant decrease in MDA activity compared with Ezapril group. 5. Histopathological findings Regarding to the liver, oral administration of Ezapril Ezapril (0.36 mg/kg, P.O. once daily for successive 21 days ) produced hydropic degeneration in amoderate number of hepatocytes, in the second week,showed degenerative changes in amoderate number of hepatocytes and in third week, showed apparently normal hepatocytes. Connecting to the kidney, Oral Oral administration of Ezapril (0.36 mg/kg, P.O. once daily for successive 21 days) in the first week, showed congestion of the glomerular tufts and mild degenerative changes in the proximal and distal convoluted tubular epithelium and cloudy swelling. In the second week, cystic dilatation of renal tubules and focal interstitial round cell aggregation. In the third week, there was interstitial nephritis. Administration of Vit.E (1mg/kg, P.O. once daily for successive 21 days) and its combination with Ezapril (0.36 mg/kg, P.O. once daily for successive 21 days) on liver showed Most of the hepatocytes were apparently normal a few cells showed degenerative changes mainly cloudy swelling in the first week. As regarded to the kidney, Mild to moderate congestion of renal blood vessles with perivascular edema could be detected cystic dilatation of a moderate number of renal tubules, particularly in the medulla with atrophy of the lining epithelium was observed in the first week.
Introduction
Enalapril: A New Angiotensin Converting Enzyme Inhibitor
Enalapril maleate is a new angiotensin converting enzyme inhibitor marketed in the U.S. by Merck Sharp and Dohme. It has been demonstrated to actively interfere with the renin-angiotensin-aldosterone system. This is reflected by both hemodynamic (decreased blood pressure) and humoral (increased plasma renin, angiotensin I, and decreased angiotensin II) responses to enalapril therapy. Activity in the kallikrein-bradykinin system is still controversial. Enalapril maleate is a prodrug which is quickly absorbed, hydrolyzed by the liver to the active metabolite enalaprilic acid, and excreted 33 percent in the bile and 61 percent in the urine. The therapeutic dosage range is 10-40 mg/d, maximum of 40 mg, given once or twice daily. The onset and duration of action are dose related. Vertigo and headache have been the most commonly reported side effects. Clinical comparison of enalapril to hydrochlorothiazide, beta-adrenergic blockers, and captopril find it efficacious in the treatment of essential hypertension. Efficacy in treating congestive heart failure and hypertension secondary to renal artery stenosis has also been demonstrated for both angiotensin converting enzyme inhibitors. The overall efficacy and safety of enalapril and captopril appear equivalent when used at low doses in patients with uncomplicated hypertension [1]. The chemistry, pharmacology, pharmacokinetics, clinical efficacy, adverse effects, and dosage of enalapril maleate, a nonsulfhydryl angiotensin- converting enzyme (ACE) inhibitor, are reviewed. Enalapril is rapidly converted by ester hydrolysis to enalaprilat, a potent ACE inhibitor; enalapril itself is only a weak ACE inhibitor. Enalapril lowers peripheral vascular resistance without causing an increase in heart rate. In patients with congestive heart failure, enalapril has beneficial hemodynamic effects based on reduction of both cardiac preload and afterload. Approximately 60% of a dose of enalapril is absorbed after oral administration. Excretion of enalaprilat is primarily renal. Accumulation of enalaprilat occurs in patients with creatinine clearances less than 30 mL/min. Enalapril 10-40 mg per day orally has shown efficacy comparable to that of captopril in treating patients with mild, moderate, and severe hypertension, hypertension caused by renal-artery stenosis, and in congestive heart failure resistant to digitalis and diuretics. When given alone for hypertension, enalapril has efficacy comparable to that of thiazide diuretics and beta blockers. Side effects observed with enalapril have generally been minor. Captopril-
associated side effects such as skin rash, loss of taste, and proteinuria have been observed in a small number of patients receiving enalaprilto date; neutropenia less than 300/mm3 has been noted with captopril but not enalapril. The incidence of these side effects has been noted to be greatly decreased in patients on low doses of captopril. Enalapril appears to be similar in efficacy to captopril for treating hypertension and congestive heart failure. Whether enalapril is safer than low-dose captopril in patients at high risk for captopril-associated side effects will require further investigation [2].
Aim of Work
The present study was designed to clarify the adverse effectofezapril and to clarify protective effect of antioxidant vitamin E and its combination against oxidative damage and nephrotoxict and hepatotoxicity induced in rats by using Ezapril through investigation of: 1- Oxidant status in kidney and liver through measuring; a- Catalase (CAT), b- Superoxidase dismutase (SOD), c- Glutathione peroxidase (GPX), Malondialdehyde (MDA) (marker of lipid peroxident), 1- Biochemical Constituents in sera such as; a-serum creatinine and urea levels. b- serum alanine aminotrasferase (ALT), aspatateaminotrasferase (AST), alkaline phosphatase (ALP), total proteins, albumin, total bilirubin,1- Histopathology of liver and kidne.
Material and Methods
Material
A- Drug: VASOTEC® (Enalapril Maleate) is the maleate salt of enalapril, the ethyl ester of a long-acting angiotensin converting enzyme inhibitor, enalaprilat. Enalapril maleate is chemically described as (S)-1 [N-[1- (ethoxycarbonyl)-3-phenylpropyl]-L-alanyl]-L-proline, (Z)-2-butenedioate salt (1:1). Its chemical formula is C20H28N2O5•C4H4O4, Structural formula:
The recommended dose is 20 mg/kg body weight for 21 successive days (Paget and Barnes). 2-Vitamin E (Vitamin E capsule): It was supplied by PHARCO pharmaceutical CO., Alex., Egypt. This product was supplied as capsules (each capsule, 1000 mg vitamin E). Vitamin E dose: 100 mg / kg b. wtintraperitoneally (ip) according to dissolved in corn oil according to Bayad it was administered for successive 13 days.
Structure Formula [3]:
Chemical structure: C29H50O2 B-Experimental animals: The present study was carried on 80 adult female albino rats weight 150-200 g, obtained from laporatory Animal Farm, Faculty of Veterinary Medicine, Zagazig University. All animals were kept under observation for two weeks for acclimation to the laboratory environment before starting the experiments. The animals were kept under hygienic condition in metal cages and fed on barely and milk all over the experimental time and water was provided.
Methods
Experimental Design: All animals were quarantined for aperiod of two weeks to ensure stabilization before use. Eighty Albino rats 6 to 8 months of age (150-200) weight range) were used in the experiment. All rats were housed in polypropylene cages with wood –chip bedding for the duration of the experiments and were maintained on a 12 h light /dark schedule in a temperature –and humidity – controlled room. With the exception of those placed on food restriction, all animals were given acces to food and water. All experimental procedures were approved by the animal studies committee of the Washinton University School of Medicine.The test room temperature was 23±2º C, and with artificial fluorescent light (10-14 hrs of light and dark, respectively). The rats were allocated into four groups and each group contains 20 rats. The 1st group: Rats in this group were not medicated and received normal saline as control. The 2nd group (M): Rats in this group oral dose of ezapril (0.36mg/kg b.wt) P.O. once daily for successive 21 days as standard. The 3rd group (VE): Rats in this group were administrated oral dose of vitamin E (1mg/kg b. wt) P.O. once daily for successive 21 days as standard antioxidant. The4th group (VE+M): Rats in this group were received (VE) 1 mg/kg. b.wt, P.O. once daily) with Ezapril (0.36 mg /kgb.wt, PO. once daily) for successive 21 days. A -Collection of Samples: At the end of experiment (12 hrs after the last dose), rats were sacrified and the following samples were collected: 1-Blood was collected and allowed to clot and serum was separated by centrifugation at 3000 rpm for 15 minutes for determination of liver and kidney function test. 2-Kidneys and liver samples from all groups were immediately removed and kept in 10% neutral formalin for histopathological examination. 3-Antioxidant enzyme activities: a- Determination of Catalase activity: Catalase activity was determined colorimetrically in tissue homogenate according the method described by Aebi [4]. B-Determination of superoxide dismutase activity: Superoxide dismutase activity was determined in tissue homogenate according to the method described by Nishikimi. C-Determination of glutathione peroxidase activity: Glutathione peroxidase activity in tissue homogenate was determined according the method adapted by Paglia & Valentine [5]. d- Determination of malondialdehyde (MDA) activity Malondialdehyde activities were determined according the method adapted by Satoh [6]. 2-Kidney function tests: A-Determination of serum creatinine: Serum creatinine was determined according to henry, et al. [7]. B-Determination of serum urea: Serum urea was determined according to Artiss [8]. 3-Liver Function Tests: A- Alanine Aminotransferase (ALT): Principles of Reaction: The serum activity of Statistical analysis The data were analyzed using prism version 6.Statistical evaluation of the results, except those of histopathology scoring, were carried out by means of one way and two-way analysis of variance (ANOVA) followed by Duncan’s test P< 0.05 was considered statistically significant according to Tamhane & Dunlop [13]. C- Histopathological examination (Table 1).
alanine aminotransferase (ALT) was determined colorimetrically according to the method described by Tietz [9]. B-ASpartate aminotransferase (AST): Principle of reaction: The serum activity of aspartate aminotransferase (AST) was determined calorimetrically according to the method described by Tietz [9]. C- Determination of Alkaline phosphatase activity (ALP): Principles of reaction: Colerimetric determination of alkaline phosphatase activity according to Belfield & Goldberg [10]. D-Determination of serum total proteins and albumin: Serum total proteins and albumin were determined according to Gassbaro, et al. [11]. e) Determination of serum bilirubin (T.B): It is determined in the presence of caffeine, which releases albumin bound bilirubin, by the reaction which diazotized suiphanilic acid Jendrassilk & Grof [12].
| T | Parameters | ALT (U/L) | |||||||||||||||
|---|---|---|---|---|---|---|---|---|---|---|---|---|---|---|---|---|---|
| Groups | |||||||||||||||||
| reatments | 1day | 7 days | 14 days | 21 days | |||||||||||||
| Gp.I | Control | 14.66a±1.76 | 11.67a±1.20 | 15.09a±1.15 | 18.67a±1.85 | ||||||||||||
| Gp.II | Vitamin E | 13.33a±1.45 | 12.66a±1.22 | 15.10a±2.08 | 18.66a±0.88 | ||||||||||||
| Gp.III | Ezapril | 12.00a±1.52 | 14.00a±0.57 | 15.04a±1.15 | 20.00a±1.52 | ||||||||||||
| Gp.IV | Vitamin E + Ezapril | 14.00a±1.52 | 13.33a±2.40 | 14.33a±1.76 | 21.33a±1.76 | ||||||||||||
| F test | NS | NS | NS | NS |
Table 1: Serum ALT of rats in groups (I-IV) after 1, 7, 14, and 21 days of drugs withdrawal (n= 5, mean ± SE). - All data having
significant difference when compared with control group at all experimental period in first, second and third group.
| T | Parameters | AST (U/L) | |||||||||||||||
|---|---|---|---|---|---|---|---|---|---|---|---|---|---|---|---|---|---|
| Groups | |||||||||||||||||
| reatments | 1day | 7 days | 14 days | 21 days | |||||||||||||
| Gp.I | Control | 20.00a±1.15 | 23.33a±1.76 | 25.00a±1.16 | 29.33a±1.76 | ||||||||||||
| Gp.II | Vitamin E | 19.66a±1.45 | 22.00a±1.52 | 24.00a±1.15 | 31.30a±1.45 | ||||||||||||
| Gp.III | Ezapril | 20.66a±2.96 | 22.66a±2.02 | 25.33a±1.45 | 29.23a±1.85 | ||||||||||||
| Gp.IV | Vitamin E + Ezapril | 21.33a±2.18 | 22.00a±2.08 | 25.00a±0.57 | 31.00a±1.15 | ||||||||||||
| F test | NS | NS | NS | NS |
Table 2: Serum albumin of rats in groups (I-IV) after 1, 7, 14, and 21 days of drugs withdrawal (n= 5, mean ± SE. - All data havi
According to the result administration of Ezapril, Vit. E and their combination showed non-significant difference when compared with control group at all experimental period in first, second and third group.
| T | Parameters | ALP (IU/L) | ||||||||||||||
|---|---|---|---|---|---|---|---|---|---|---|---|---|---|---|---|---|
| Groups | ||||||||||||||||
| reatments | 1day | 7 days | 14 days | 21 days | ||||||||||||
| Gp.I | Control | 142.00a±1.52 | 150.33a±1.45 | 155.67a±4.09 | 154.33a±2.02 | |||||||||||
| Gp.II | Vitamin E | 141.33a±4.48 | 151.00a±4.72 | 156.00a±5.56 | 153.30a±3.52 | |||||||||||
| Gp.III | Ezapril | 143.67a±3.84 | 150.33a±9.83 | 155.00a±6.50 | 157.67a±3.28 | |||||||||||
| Gp.IV | Vitamin E + Ezapril | 144.00a±4.61 | 152.67a±4.66 | 154.17a±4.25 | 152.00a±1.52 | |||||||||||
| F test | NS | NS | NS | NS |
Table 3: Serum albumin of rats in groups (I-IV) after 1, 7, 14, and 21 days of drugs withdrawal (n= 5, mean ± SE. - All data havi
resulted in a significant decrease in total protein activity (7.72±014g/ dl) compared with (8.18±0.10g/ dl) for the control group group. In the third week, resulted in significant decrease in total protein activity (8.00±0.15g/ dl) compared with for the control group (8.30±0.03g/ dl). Administration of Vit. E (1 mg /kg, P.O. once daily) In the first, second and third week showed non-significant difference at all experimental period.
There was decrease in level of total serum proteins was observed compared with control group Treatment with Ezapril (0.36mg/kg, P.O. once daily) In first week, resulted in a significant decrease in total protein activity (7.25±0.15g/ dl) compared with (8.00 ±0.05g/ dl) for the control group. In the second week,
| T | Parameters | Total proteins (g/dl) | |||||||||||||
|---|---|---|---|---|---|---|---|---|---|---|---|---|---|---|---|
| Groups | |||||||||||||||
| reatments | 1day | 7 days | 14 days | 21 days | |||||||||||
| Gp.I | Control | 7.80a±0.11 | 8.00a±0.05 | 8.18a±0.10 | 8.30a±0.03 | ||||||||||
| Gp.II | Vitamin E | 7.85a±0.05 | 7.93a±0.02 | 8.20a±0.13 | 8.36a±0.02 | ||||||||||
| Gp.III | Ezapril | 5.08c±0.33 | 7.25b±0.15 | 7.72b±0.14 | 8.00b±0.15 | ||||||||||
| Gp.IV | Vitamin E + Ezapril | 6.89b±0.05 | 7.58ab±0.22 | 7.95ab±0.07 | 8.21a±0.05 | ||||||||||
| F test | ** | * | * | * |
Table 4: Serum albumin of rats in groups (I-IV) after 1, 7, 14, and 21 days of drugs withdrawal (n= 5, mean ± SE. - All data havi
The combination between Ezapril and Vit.E.
withdrawal comparing with Ezapril group and completely return to the normal level at the third week.
| T | Parameters | Albumin (g/dl) | |||||||||||||
|---|---|---|---|---|---|---|---|---|---|---|---|---|---|---|---|
| Groups | |||||||||||||||
| reatments | 1day | 7 days | 14 days | 21 days | |||||||||||
| Gp.I | Control | 5.31a±0.07 | 5.44a±0.02 | 5.53a±0.02 | 5.47a±0.01 | ||||||||||
| Gp.II | Vitamin E | 5.33a±0.04 | 5.47a±0.02 | 5.49a±0.05 | 5.43a±0.06 | ||||||||||
| Gp.III | Ezapril | 2.26c±0.23 | 4.16c±0.08 | 5.05b±0.07 | 5.26a±0.03 | ||||||||||
| Gp.IV | Vitamin E + Ezapril | 4.16b±0.12 | 5.13b±0.43 | 5.31a±0.12 | 5.35a±0.02 | ||||||||||
| F test | ** | ** | * | NS |
Table 5: Serum albumin of rats in groups (I-IV) after 1, 7, 14, and 21 days of drugs withdrawal (n= 5, mean ± SE. - All data havi
Table 5: Serum albumin of rats in groups (I-IV) after 1, 7, 14, and 21 days of drugs withdrawal (n= 5, mean ± SE. - All data having different letters are differ significantly at p < 0.05. - : Highly significant at 0.01 probability. - *: Significant at 0.01 probability. –NS:Non-significant difference. The effect of Ezapril (0.36 mg/kg, P.O. once daily) on successive 21 days There was highly significant decrease in level of serum albumin was observed in the first week (4.16±0.08 g/ dl mg/ dl and second week (5.05±0.07g/ dl) compared with non-significant difference in the third week (5.26±0.03 g/ dl). Treatment with Ezapril (0.36 mg /kg, P.O. once daily) In first week, resulted in decrease albumin activity (4.16±0.08g/ dl) compared with (5.44±0.02 g/ dl) for the control group. In the second week, resulted in decrease in albumin activity (5.05±0.07 g/ dl) compared with (5.53±0.02g/ dl) for the control group group. In the third week, resulted in non significant difference in albumin activity (5.26 ±0.03g/ dl) compared with for the control group (5.47±0.01g/ dl). Administration of Vit. E (1 mg /kg, P.O. once daily) In the first, second and third week resulted in Vit.E administration restored albumin activity to almost normal level as as no significant variation were detected (5.43±0.06g/ dl) compared with (5.47 ±0.01g/ dl) for the cotrol group. The combiation between Ezapril and Vit.E** In the first week, resulted in an increase in albumin activity (5.13±0.43g/ dl) compared with (4.06±0.08g/ dl) for Ezapril group.
In the second week, resulted in an increase in albumin activity (5.31 ±0.12g/ dl) compared with (5.05 ±0.07g/ dl) for Ezapril group.
In the third week, resulted in non significant difference in albumin activity (5.35±0.02g/ dl) compared with (5.26 ±0.03g/ dl) for Ezapril group.
According to the results, in the third week, Ezapril not effect on albumin activity.
| T | Parameters | Total globulins (g/dl) | ||||||||||||||
|---|---|---|---|---|---|---|---|---|---|---|---|---|---|---|---|---|
| Groups | ||||||||||||||||
| reatments | 1day | 7 days | 14 days | 21 days | ||||||||||||
| Gp.I | Control | 2.48a±0.04 | 2.56a±0.08 | 2.64a±0.13 | 2.83a±0.02 | |||||||||||
| Gp.II | Vitamin E | 2.51a±0.01 | 2.46a±0.04 | 2.71a±0.12 | 2.93a±0.08 | |||||||||||
| Gp.III | Ezapril | 2.81a±0.24 | 2.79a±0.39 | 2.67a±0.15 | 2.73a±0.14 | |||||||||||
| Gp.IV | Vitamin E + Ezapril | 2.72a±0.16 | 2.45a±0.25 | 2.63a±0.18 | 2.86a±0.08 | |||||||||||
| F test | NS | NS | NS | NS |
Table 6: Serum total globulins of rats in groups (I-IV) after 1, 7, 14, and 21 days of drugs withdrawal (n= 5, mean ± SE). - All
when compared with control group at all experimental period in first,second and third group.
| Parameters Treatments | Urea (mg/dl) | |||||||||||||||
|---|---|---|---|---|---|---|---|---|---|---|---|---|---|---|---|---|
| Groups | ||||||||||||||||
| 1day | 7 days | 14 days | 21 days | |||||||||||||
| Gp.I | Control | 23.08c±1.25 | 25.76c±0.63 | 26.43b±2.84 | 27.86a±0.74 | |||||||||||
| Gp.II | Vitamin E | 24.06c±1.16 | 25.45c±1.05 | 26.69b±1.87 | 27.22a±0.67 | |||||||||||
| Gp.III | Ezapril | 74.67a±7.14 | 55.46a±2.91 | 40.94a±2.47 | 32.32a±1.59 | |||||||||||
| Gp.IV | Vitamin E + Ezapril | 51.35b±2.98 | 41.90b±5.67 | 30.79b±2.92 | 27.19a±1.50 | |||||||||||
| F test | ** | ** | * | NS |
Table 7: Serum urea of rats in groups (I-IV) after 1, 7, 14, and 21 days of drugs withdrawal (n= 5, mean ± SE). - All data having
Table 7: Serum urea of rats in groups (I-IV) after 1, 7, 14, and 21 days of drugs withdrawal (n= 5, mean ± SE). - All data having different letters are differ significantly at p < 0.05. - ** : Highly significant at 0.01 probability. - * : Significant at 0.01 probability. –NS:Non-significant difference. The effect of Ezapril (0.36 mg/kg, P.O. once daily) on successive 21 days There was highly significant increase in level of serum urea was observed in the first week(55.46±2.91 mg/ dl) and second week (40.94±2.47 mg/ dl) compared with the third week (32.32±1.59 mg/ dl).
Treatment with Ezapril (0.36 mg /kg, P.O. once daily) In first week, resulted in highly significant increase in urea activity (55.46±2.91 mg/ dl) compared with (25.76±0.63 mg/ dl) for the control group. In the second week, resulted in asignificant increase in urea activity (40.94±2.47 mg/ dl) compared with (26.43±2.84mg/ dl) for the control group group. In the third week, resulted in non significant difference in urea activity (32.32
±1.59mg/ dl) compared with for the control group (27.86±0.74mg/ dl). Administration of Vit. E (1 mg /kg, P.O. once daily ) In the first, second and third week resulted in Vit.E administration restored urea activity to almost normal level as as no significant variation were detected (27.22±0.67mg/ dl) compared with (27.86 ±0.74mg/ dl) for the cotrol group.
The combination between Ezapril and Vit.E In the first week, resulted in decrease in urea level (41.90±5.67 mg/ dl) compared with(55.46±0. mg/ dl) for Ezapril group. In the second week, resulted in decrease in urea level (30.79 ±2.92 mg/ dl) compared with(40.94 ±2.47 mg/ dl) for Ezapril group. In the third week, resulted in non significant difference in urea level (27.19±1.50 mg/ dl) compared with (32.32 ±1.59 mg/ dl) for Ezapril group.
According to the results, the combination between Ezapril and Vit.E was more effective on decrease urea while Ezapril increased it.
| T | Parameters | Creatinine (mg/dl) | |||||||||||||||
|---|---|---|---|---|---|---|---|---|---|---|---|---|---|---|---|---|---|
| Groups | |||||||||||||||||
| reatments | 1day | 7 days | 14 days | 21 days | |||||||||||||
| Gp.I | Control | 0.80b±0.03 | 0.84b±0.03 | 0.86c±0.04 | 0.89b±0.02 | ||||||||||||
| Gp.II | Vitamin E | 0.81b±0.02 | 0.85b±0.02 | 0.90c±0.02 | 0.92b±0.08 | ||||||||||||
| Gp.III | Ezapril | 2.58a±0.44 | 2.36a±0.17 | 1.75a±0.04 | 1.35a±0.07 | ||||||||||||
| Gp.IV | Vitamin E + Ezapril | 2.16a±0.44 | 1.63a±0.23 | 1.20b±0.15 | 1.02ab±0.03 | ||||||||||||
| F test | * | * | ** | * |
Table 8: Serum creatinine of rats in groups (I-IV) after 1, 7, 14, and 21 days of drugs withdrawal (n= 5, mean ± SE). - All data
Table 8: Serum creatinine of rats in groups (I-IV) after 1, 7, 14, and 21 days of drugs withdrawal (n= 5, mean ± SE). - All data having different letters are differ significantly at p < 0.05. - :Highly significant at 0.01 probability. - * : Significant at 0.01 probability. The effect of Ezapril (0.36 mg/kg, P.O. once daily) on successive 21 days There was an increase in level of serum creatinine was observed compared with control group Treatment with Ezapril (0.36mg/kg, P.O. once daily) In first week, resulted in an increase in creatinine activity (2.36±0.17 mg/ dl) compared with (0.84 ±0.03 mg/ dl) for the control group. In the second week, resulted in a significant increase in creatinine activity (1.75±0.04 mg/ dl) compared with (0.86±0.04mg/ dl) for the control group group. In the third week, resulted in an increase in creatinine activity (1.35 ±0.04mg/ dl) compared with for the control group (0.89±0.04mg/ dl). Administration of Vit. E (1 mg /kg, P.O. once daily) In the first, second and third week resulted in Vit.E administration restored creatinine activity to almost normal level as no significant variation were detected (0.92 ±0.08mg/ dl) compared with (0.89 ±0.02mg/ dl) for the cotrol group. The combination between Ezapril and Vit.E** In the first week, resulted in decrease in creatinine level (1.63 ±0.23 mg/ dl) compared with (2.36 ±0.17 mg/ dl) for Ezapril group. In the second week, resulted in decrease in creatinine level (1.20 ±0.15 mg/ dl) compared with (1.75 ±0.04 mg/ dl) for Ezapril group. In the third week, resulted in decrease in creatinine level (1.02±0.23 mg/ dl) compared with (1.35 ±0.17 mg/ dl) for Ezapril group.
According to the results, the combination between Ezapril and Vit.E was more effective on decrease creatinine while Ezapril increased it.
| T | Parameters | CAT (U/L) | |||||||||||||||
|---|---|---|---|---|---|---|---|---|---|---|---|---|---|---|---|---|---|
| Groups | |||||||||||||||||
| reatments | 1day | 7 days | 14 days | 21 days | |||||||||||||
| Gp.I | Control | 268.01a±4.25 | 276.18a±12.61 | 275.25a±8.11 | 276.41a±5.04 | ||||||||||||
| Gp.II | Vitamin E | 269.53a±6.76 | 266.90a±9.55 | 265.48a±2.60 | 279.01a±4.06 | ||||||||||||
| Gp.III | Ezapril | 172.36b±0.13 | 194.20c±4.54 | 207.19c±3.34 | 238.61b±4.68 | ||||||||||||
| Gp.IV | Vitamin E + Ezapril | 195.45b±10.02 | 227.67b±2.15 | 244.26b±2.47 | 261.65a±4.82 | ||||||||||||
| F test | ** | ** | * | * |
The effect of Ezapril (0.36 mg/kg, P.O. once daily) on successive 21 days There was decrease in level of serum catalase was observed compared with control group Treatment with Ezapril (0.36mg/kg, P.O. once daily) In first week, resulted in highly significant decrease in catalase activity (194.20±4.54 mg/ dl) compared with (276.18 ±0.03 mg/ dl) for the control group. In the second week, resulted in highly significant decrease in catalase activity (207.19±3.34 mg/ dl) compared with (275.25±8.11mg/ dl) for the control group group. In the third week, resulted in significant decrease in catalase activity (238.61±4.681mg/ dl) compared with for the control group (276.41±5.04mg/ dl). Administration of Vit. E (1 mg /kg, P.O. once daily ) In the first, resulted in adecrease in catalase activity (266.90±9.55mg/ dl) compared with (276.18 ±12.61mg/ dl) for the cotrol group. In the second week, resulted in a decrease in catalase activity (265.48±2.60mg/ dl) compared with (275.25 ±8.11mg/ dl) for the cotrol group. In the third week, resulted in an increase in catalase activity (279.01±4.06mg/ dl) compared with (276.41 ±5.04mg/ dl) for the cotrol group. The combination between Ezapril and Vit.E In the first week, resulted in an increase in catalase level (227.67±2.15 mg/ dl) compared with (194.20±4.54mg/ dl) for Ezapril group. In the second week, resulted in an increase in catalaselevel (244.26 ±2.47mg/ dl) compared with (207.19 ±3.34mg/ dl) for Ezapril group. In the third week, resulted in an increase in catalase level (261.65±4.82 mg/ dl) compared with (238.61±4.68 mg/ dl ) for Ezapril group.
According to the results, the combination between Ezapril and Vit.E was more effective on increase catalase activity while Ezapril decreased it.
| T | Parameters | SOD (U/ml) | |||||||||||||||
|---|---|---|---|---|---|---|---|---|---|---|---|---|---|---|---|---|---|
| Groups | |||||||||||||||||
| reatments | 1day | 7 days | 14 days | 21 days | |||||||||||||
| Gp.I | Control | 21.99a±1.72 | 25.65a±5.11 | 24.15a±2.14 | 24.58a±0.70 | ||||||||||||
| Gp.II | Vitamin E | 22.85a±0.57 | 28.12a±1.37 | 23.87a±2.14 | 24.43a±2.09 | ||||||||||||
| Gp.III | Ezapril | 7.24c±0.32 | 12.99b±2.29 | 16.80a±1.06 | 19.74a±1.43 | ||||||||||||
| Gp.IV | Vitamin E + Ezapril | 13.48b±1.46 | 16.73b±2.02 | 22.66a±4.94 | 23.63a±2.43 | ||||||||||||
| F test | ** | * | NS | NS |
Table 10: Serum superoxide dismutase (SOD) of rats in groups (I-IV) after 1, 7, 14, and 21 days of drugs withdrawal (n= 5, mean ±
Table 10: Serum superoxide dismutase (SOD) of rats in groups (I-IV) after 1, 7, 14, and 21 days of drugs withdrawal (n= 5, mean ± SE). - All data having different letters are differ significantly at p < 0.05. - :Highly significant at 0.01 probability. - * : Significant at 0.01 probability. –NS:Non-significant difference. The effect of Ezapril (0.36 mg/kg, P.O. once daily) on successive 21 days There was decrease in level of SOD was observed compared with control group Treatment with Ezapril (0.36mg/kg, P.O. once daily) In first week, resulted in significant decrease in SOD activity (12.99±2.29 mg/ dl) compared with (25.65 ±5.11mg/ dl) for the control group. In the second week, resulted in asignificant decrease in SOD activity (16.80±1.06mg/ dl) compared with (24.15±2.14mg/ dl) for the control group group. In the third week, resulted in decrease in SOD activity (19.74 ±1.43mg/ dl) compared with for the control group (24.58±0.70mg/ dl). Administration of Vit. E (1 mg /kg, P.O. once daily ) In the first, second and third week resulted in Vit.E administration restored creatinine activity to almost normal level as as no significant variation were detected (0.92 ±0.08mg/ dl) compared with (0.89 ±0.02mg/ dl) for the cotrol group. The combination between Ezapril and Vit.E** In the first week, resulted in an icrease in SOD level (16.73 ±2.02 mg/ dl) compared with(12.99 ±2.29 mg/ dl) for Ezapril group. In the second week, resulted in an increase in SOD level (22.66 ±4.94 mg/ dl) compared with (16.80 ±1.06 mg/ dl) for Ezapril group. In the third week, resulted in an increase in SOD level (23.63±2.43 mg/ dl) compared with (19.74 ±1.43mg/ dl) for Ezapril group. According to the results, the combination between Ezapril and Vit.E was more effective on increase SOD while Ezapril decreased it.
| Parameters | GPX (U/L) | ||||||||||||||||
|---|---|---|---|---|---|---|---|---|---|---|---|---|---|---|---|---|---|
| Groups | |||||||||||||||||
| Treatments | 1day | 7 days | 14 days | 21 days | |||||||||||||
| Gp.I | Control | 121.03a±1.38 | 116.66a±3.51 | 119.13a±6.03 | 123.82a±1.50 | ||||||||||||
| Gp.II | Vitamin E | 123.36a±3.97 | 115.73a±2.03 | 121.93a±9.96 | 125.13a±2.66 | ||||||||||||
| Gp.III | Ezapril | 69.09c±5.27 | 85.94c±3.63 | 100.76a±3.21 | 114.86a±3.06 | ||||||||||||
| Gp.IV | Vitamin E + Ezapril | 90.20b±5.21 | 101.55b±3.64 | 108.61a±3.08 | 121.49a±2.83 | ||||||||||||
| F test | ** | * | NS | NS |
Table11: Serum glutathione peroxidase (GPx) of rats in groups (I-IV) after 1, 7, 14, and 21 days of drugs withdrawal (n= 5, mean ± SE). - All data having different letters are differ significantly at p < 0.05. - : Highly significant at 0.01 probability. - * : Significant at 0.01 probability. –NS:Non-significant difference. The effect of Ezapril (0.36 mg/kg, P.O. once daily) on successive 21 days There was adecrease in level of GPX was observed but asignificant decrease was showing when compared first week result (85.94 ±3.63 U/ml) with the third week (114.86±3.06 U/ml ). Treatment with Ezapril (0.36mg/kg, P.O. once daily) In first week, there is adecrease in GPX activity (85.94 ±3.63 U/ml) compared with (116.66 ±3.51 U/ml) for the control group. In the second week, resulted in asignificant decrease in GPX activity (100.76±3.21 U/ml) compared with (119.13±6.03U/ml) for the control group group. In the third week, resulted in asignificant decrease in GPX activity (114.86 ±3.06U/mll) compared with for the control group (132.82±1.50U/ml). Administration of Vit. E (1 mg /kg, P.O. once daily) In the first week, there is non-significant difference when compared with the control group.In the second week,resulted in an increase in GPX activity (121.93 ±9.96U/ml) compared with (119.13 ±6.03U/ml) for the control group and In the third week resulted in an increase in GPX activity (125.13 ±2.66U/ml) compared with (123.82 ±1.50U/mll) for the cotrol group. The combination between Ezapril and Vit.E** In the first week, resulted in an increase in GPX activity (101.55 ±3.64U/ml) compared with(85.94 ±3.63U/ml) for Ezapril group. In the second week, resulted in an increase in GPX activity (108.61±3.08U/ml) compared with (100.76 ±3.21U/ml) for Ezapril group. In the third week, resulted in an increase in GPX activity (121.49±2.83U/ml) compared with (114.86 ±3.06U/ml) for Ezapril group. According to the results, the combination between Ezapril and Vit.E was more effective on increasing GPX activity while Ezapril decreased it.
| MDA | |||||||||||||||||
|---|---|---|---|---|---|---|---|---|---|---|---|---|---|---|---|---|---|
| Parameters | |||||||||||||||||
| Groups | (nmol/ml) | ||||||||||||||||
| Treatments | |||||||||||||||||
| 1day | 7 days | 14 days | 21 days | ||||||||||||||
| Gp.I | Control | 6.07c±0.23 | 6.22c±0.45 | 5.03b±0.92 | 6.04a±0.81 | ||||||||||||
| Gp.II | Vitamin E | 5.43c±1.27 | 5.98c±0.18 | 5.30b±0.56 | 6.10a±0.15 | ||||||||||||
| Gp.III | Ezapril | 24.46a±2.37 | 17.46a±0.66 | 12.42a±1.71 | 8.49a±1.22 | ||||||||||||
| Gp.IV | Vitamin E + Ezapril | 18.36b±0.87 | 10.14b±0.67 | 8.06b±0.58 | 6.92a±0.56 | ||||||||||||
| F test | ** | ** | * | NS |
Table 12: Serum malonaldehyde (MDA) of rats in groups (I-IV) after 1, 7, 14, and 21 days of drugs withdrawal (n= 5, mean ± SE). -
Table 12: Serum malonaldehyde (MDA) of rats in groups (I-IV) after 1, 7, 14, and 21 days of drugs withdrawal (n= 5, mean ± SE). - All data having different letters are differ significantly at p < 0.05. - : Highly significant at 0.01 probability. - *: Significant at 0.01 probability. –NS:Non-significant difference The effect of Ezapril (0.36mg/kg, P.O. once daily) on successive 21 days There was gradual significant decrease in level of MDA was observed (17.46±0.66mm/l), (12.42±1.71mm/l) and (8.49±1.22mm/l) Treatment with Ezapril (0.36mg/kg, P.O. once daily)** In first week, resulted in an increase in MDA activity (17.46±0.66mm/l) compared with (6.22 ±0.45mm/l) for the control group. In the second week, resulted in asignificant increase in MDA activity (12.42±1.71mm/l) compared with (5.03±0.92mm/l) for the control group group. In the third week, resulted in an increase in MDA
activity (8.49 ±1.22mm/l) compared with for the control group (6.04±0.81mm/l). Administration of Vit. E (1 mg /kg, P.O. once daily ) In the first, second and third week resulted in Vit.E administration restored MDA activity to almost normal level as as no significant variation were detected (6.10 ±0.15mm/l) compared with (6.04 ±0.81mm/l) for the cotrol group. The combination between Ezapril and Vit.E In the first week, resulted in decrease in MDA activity (10.14 ±0.67mm/l) compared with (17.46 ±0.66mm/l) for Ezapril group. In the second week, resulted in decrease in MDA activity (8.06±0.58mm/l) compared with (12.42 ±1.71mm/l) for Ezapril group. In the third week, resulted in decrease in MDA activity (6.92±0.56mm/l) compared with (8.49 ±1.22mm/l) for Ezapril group.
According to the results, the combination between Ezapril and Vit.E was more effective on decreasing MDA activity while Ezapril increased it.
Histopathological Results
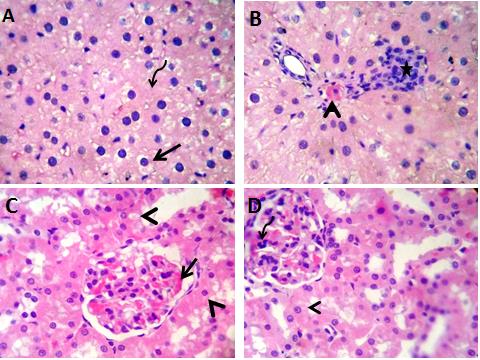
Ezapril 7 days (Figure 1) Liver: Examined sections showed hydropic degeneration in a moderate number of hepatocytes and apoptotic changes in a few cells (0.25 -0.5%). Periportal round cell aggregation was seen. The hepatic sinusoids were completely or partially obliterated. Kidney: Mild congestion of the glomerular tufts and mild degenerative changes in the proximal and distal convoluted tubular epithelium, mostly cloudy swelling and hydropic degeneration were seen. Hypertrophy of the glomerular mesangial cells could also be detected.
dilatation of a moderate number of renal tubules; particularly in the medulla with atrophy of the lining epithelium was observed. Moderate number of the tubular epithelium especially in the cortex showed degenerative changes mostly cloudy swelling and hydropic degeneration.
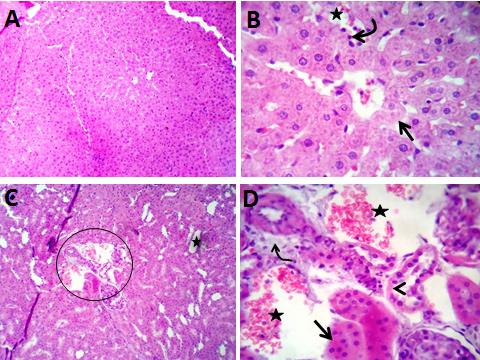
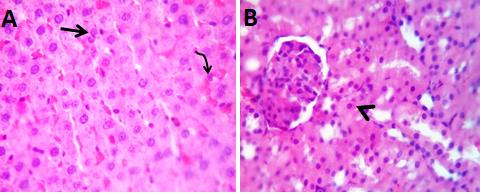
Kidney: Apparently normal renal functional units and normal stroma with preserved tubular epithelium, glomerular structures and intertubular vascular tributaries were seen. A few renal tubules showed degenerative changes mostly cloudy swelling. (Plate 5).
Discussion
This present study was designed to clarify the toxic effect of Ezapril and protective effects of antioxidant Vit.E against nephrotoxicity and hepatotoxicity induced in rats by Ezapril. In this study, Ezapril is used in adose (0.36mg/kg,P.O.) once daily for successive 21 days Paget & Barnes [14] to induce oxidative stress in rat liver and kidneys, as evidenced by ahigh significant decline in antioxidant enzyme activities CAT, SOD, GPX and ahigh significant rise in MDA production. Ezapril significantly produced nephrotoxicity as evidenced by the increase in the kidney parameters like urea and creatinine as compared with control group. The results show non- significant effect on liver as non-significant difference occur in the activities of ALT,AST and ALP. In addition, our histopathological results in the first week showed congetion of the glomerular tufts and mild degenerative changes in the proximal and distal convoluted tubular epithelium, cloudy swelling and hydrpic degeneration, Hypertrophy of the glomerular mesangial cells. In the second week, the results showed cystic dilatation of some renal tubules. Focal interstitial round cells aggregation with atrophy of the surrounding tubular epithelium.In the third week, cystic dilatation of renal tubules, atrophy of lining epithelium cogetion of renal blood vessels with perivascular edema. These results coincided with those obtained by Sidorenkov & Navis [15]. Who found that Renal impairment is a significant potential adverse effect of rats administered Ezapril. Drugs and some chemical agents are known to induce hepatotoxicity in humans. Chemical agents are screened daily for their hepatoprotective and nephroprotective properties, for example, Vit.E. It is one of the most important antioxidant drugs due to its hepato-nephroprotective properties as reported by researchers Pryor, et al. [16]. This study demonstrated the hepato-nephroprotective effect of Vit.E. Vit.E has hepatoprotective effect of as it expresses important functions in the membranes: preventing ROS damage in polyunsaturated fatty acids as alipid soluble antioxidant and acting against damage caused to phospholipids as amembrane stabilizing agent. Additionally, Vit.E is known to act by breaking the antioxidant chain that prevents ROS- produced by cell membrane. It decreases lipid peroxidation and protects against liver injury. It decreases liver fibrosis, tumor necrosis factors, inflammation and hepatic porphyrin [17]. The previous observations explained the hepatoprotective effects of Vit.E observed in the present study.
Vit.E normalized levels of alanine aminotransferase, aspartate aminotransferase, alkaline phosphatase, serum bilirubin, glutathione superoxide dismutase, malondialdehyde and improved histopathological changes in the liver induced by chemical agents in the control group. The possible pathway can be explained through the structure of Vit.E, the side chain in the 2- position facilitates the incorporation and retention of Vit.E in bio membranes so that the 6-position is optimal for scavenging free radicals and terminating lipid peroxidation. Furthermore, its antioxidant activity is exhibited through protection of poly unsaturated fatty acid from oxidation by reactive oxygen species, stabilization of membrane and breaking of antioxidant chains that prevent reactive oxygen species damage to membranes. In the present study, Vit.E used in adose (1 mg/kg, p.o. once daily for 21 days) to clarify the hepatic- nephroprotective effect on rats. We noticed that there is an increase in the activities of antioxidant enzymes (GPX, CAT, and SOD) and asignificant decrease MDA activity. The administration of Vit.E with Ezapril showed asignificant decline in activities of serum ALT, AST, and ALP when compared with Ezapril group. Sanchez-Valle, et al. [18] reported the antioxidative therapy, mainly using natural and synthetic antioxidants, represents areasonable therapeutic approach for the prevention and treatment of liver diseases due to the role of oxidative stress in contributing to intiation and progression of hepatic damage. Beytut, et al. [19] reported that the increased level of antioxidant enzymes, SOD, CAT, GPX resulted from the treatment with vit E might normalize the lipid peroxidation reaction and related biochemical changes which in turn protects the cells from the increased risk of peroxidative damage as a result of administration of cytotoxic drugs [20, 21, 22, 23].
Conclusion
It could be concluded that the combination of Vit. E. and Ezapril showed better results than Ezapril alone. So, Ezapril should be used with caution in people with kidney disorders.
References
-
Cleary JD, Jalor JW (1986) 20(3): 177-186.
-
Valsses PH, LariJani GE, Conner DP, Ferquson RK (1985) Clinical Pharmacology 4(1): 27-40.
-
Richard AH (1995) Veterinary pharmacology and therapeutics. 7th (Edn.), Iowa state University Press, Ames.
-
Aebi H (1984) Colourimetrical determination of catalase activity. Methods enzymol 105: 121-126.
-
Paglia DE, Valentine WN (1967) Studies on quantitative and qualitative characterization of erythrocyte glutathione peroxidase. J Lab Clin Med 70(1): 158-169.
-
Satoh K (1978) Serum lipid peroxidase in cerebrovascular disorders determined by new colorimetric method. Clin Chimica Acta 90(1): 37-43.
-
Henry, Richard J (1974) Clinical Chimistry : principles and Techniques. 2th (Edn.), pp: 1354-1369.
-
Artiss JD (1981) Colorimetric determination of uric acid Clio. Chern Acta 116: 301: 309.
-
Tietz NW (1976) Fundamentals of clinical chemistry, 2nd (Edn.), WB Saunders Company, Philadelphia, pp: 873-944.
-
Befield A, Goldberg DM (1971) Revised assay for serum phenyl phosphate activity using 4-amino- antipyrine. Enzyme J Clin Path 12(5): 561-573.
-
Gassbaro L, Bendinelli R, Tomassini G (1972) Colourmetrical determination of total proteins and albumin. Clin Chem Acta 36: 225.
-
Jendrassik L, Grrof P (1938) Acolorimetric method for quantitative determination of total and direct bilirubin Biochem 297: 81.
-
Tamhane AC, Dunlop DD (2000) Statistics and data analysis from elementary to intermediate. Upper saddle River, USA.
-
Paget S, Parnes R (1964) Evaluation of drug activities, pharmacometrics. (Edn.), Laurance, Bacharach, Academic press, Newyork. 1: 456.
-
Sidorenkov, Navis (2014) Safety of ACE inhibitor therapies in patients with chronic kidney disease. Expert opinion in Drug safety 13(10): 1383-1393.
-
Pryor WA, Cornicelli JA, Devall LJ, Tait B, Trivedi BK, et al. (1993) Arapid screening test to determine the antioxidant potencies of natural and synthetic antioxidant. J Org Chem 58(13): 3521-3532.
-
Bradford A, Atkinson J, Fuller N, Rand RP (2003) The effect of vitamin E on the structure of membrane lipid assemblies. J Lipid Res 44(10):1940-1945.
-
Sanchez-Valle V, Chavez-Tapia NC, Uribe M, Mendez- Sanchez N (2012) Role of oxidative stress and molecular changes in liver fibrosis: Areview. Curr Med Chem 19(28): 4850-4860.
-
Beytut E, Erisir M, Ahsakal M (2003) Effects of additional, Vitamin E and selenium supply on antioxidative defense mechanisms in the kidney of rats treated with high doses of giucocorticoid. Cell Biochem. Funct 22(1): 59-65.
-
Ajayir A, Campbell BC, Howie CA, Reid JL (1985) Acute and chronic effects of the converting enzyme inhibitors Enalapril and lisinopril on Reflex control of heart rate in normotensive man. Journal of Hypertension 3(1): 44-53.
-
Naziroglu M, Cay M, Ustundag B, Aksakal M, Yekeler H (1999) Ischemic and reperfusion injury of cyanotic myocardial in chronic hypoxic rat model-changes in cyanotic myocardial antioxidant system. J Thorac Cardiovasc Surg 114(6): 1088-1096.
-
Orbo O (2010) ACE inhibitors Medicine Net. com. Medicine Net inc, Archieved from the original on 26 March.
-
Parola M, Leonarduzzi G, Biasi F, Albano E, Biocca ME, et al. (1992) Vitamin E dietary supplementation protects against carbon tetrachloride-induced chronic liver damage and cirrhosis. Hepatol 16(4): 1014- 1021.
- Gallic and Citric Acid Present in the Peels of Tropical Fruits as an Alternative in the Fight against Cancer
- Treating the Forehead Lines with Combination of Forehead and Glabellar Botulinum Toxin Among Japanese Patients
- Clinical Evaluation of Patients Suffering from Breast Cancer & Determination of Treatment Therapies and Better Strategies Related to Breast Cancer
- Medieval Recipes by Al-Zahrāwī for Heart Palpitations Treatment
- Etiology and Prescription Errors of Myocardial Infarction in Different Health Care Systems of Azad Kashmir
- Early Diagnosis and Multidisciplinary Management of Turner Syndrome: A Paediatric Case Study