The Safety, Toleration, and Pharmacokinetics Comparison of Two Intravenous Voriconazole Formulations in Healthy Chinese Volunteers after Three Ascending Doses
Voriconazole is a triazole antifungal agent with potent activity against a broad spectrum of clinically significant pathogens to treat infections and invasive aspergillosis and immunocompromised patients as prophylactic drug. The large variability of plasma exposure of voriconazole for injection is related with adverse drug reactions (ADRs), including visual impairment, rash and abnormal liver function test. Because the poorly dissolution of voriconazole in aqueous media, the toxicity of the excipient accumulation of sulfobutyl ether-beta-cyclodextrin sodium salt (SBECD) contained in the intravenous voriconazole may occur in renally impaired patients. The Betadex sulfobutyl ether sodium and SBECD as a solubilizer in the new formulation of intravenous voriconazole injection may improve the related ADRs. The present article evaluate the safety, toleration, and pharmacokinetics (PKs) comparison of two intravenous voriconazole injection formulations after three ascending dose administrations in healthy Chinese subjects by a randomized, double-blind, placebo- and positive-controlled trial.
Introduction
Voriconazole, available in intravenous, tablet, and oral suspension forms, is a new-generation triazole antifungal agent with potent activity against a broad spectrum of clinically significant pathogens, including Aspergillus, Cryptococcus, and Candida species [1, 2]. It is an antifungal medicine that is used to treat infections and the first-line treatment agent for invasive aspergillosis (IA), serious Candida infections, and infections caused by Scedosporium species and Fusarium species, as indicated by the United States Food and Drug Administration (FDA) [3], as recommended by the Infectious Diseases Society of America guidelines in 2008 [4]. At plasma concentrations, voriconazole is known to demonstrate highly variable, nonlinear pharmacokinetic characteristics related to the polymorphic drug-metabolizing enzyme CYP2C19 and adverse events (AEs) [5, 6, 7, 8]. Wide intraindividual and interindividual variability has been reported for voriconazole plasma concentrations in healthy subjects [9].
Although the clinical pharmacokinetics of voriconazole following i.v. dosing have been well characterized, many hospitalized critical patients require treatment with an intravenous regimen initially, followed by a continuous regimen by b.i.d. for 5 days. Owing to the large variability of plasma exposure and the wide clinical applications of voriconazole for injection, adverse reactions include visual impairment, fever, rash, vomiting, nausea, diarrhea, headache, peripheral edema, abnormal liver function test, respiratory distress, and abdominal pain [10, 11]. Because the poorly dissolution of voriconazole in aqueous media, sulfobutyl ether beta cyclodextrin sodium (SBECD) as a solubilizer is contained in the currently marketed intravenous formulation of voriconazole [12, 13]. While SBECD could be accumulated in renally impaired patients as the renal toxicity [12].
For the development of this test voriconazole injections, the excipient contains Betadex sulfobutyl ether sodium and sulfobutyl ether-beta-cyclodextrin sodium salt (SBECD) as a solubilizer. Given to the toxicity of the excipient accumulation of Betadex sulfobutyl ether sodium and SBECD, as declared by the Center for Drug Evaluation (CDE), NMPA (CYHS1900527), it need to evaluate the safety, tolerability, and pharmacokinetics of test formulations compared with original drugs (reference). To this end, a blinded, randomized, controlled, single-, and multiple-dose study was conducted in this study after the intravenous administration of voriconazole [Center for Drug Evaluation (CDE) identifier: CTR20201060.].In addition, for voriconazole injection, the price of the original drug is approximately three times greater than that of the domestic generic drug. Therefore, there is a need to reduce the economic burden on individuals, families, and society and improve drug accessibility for patients.
Materials and Methods
Participants and formulations
A total of 42 healthy Chinese male and female volunteers (sex ratio, 1:1) aged 18-45 years, weighing 45 (female) or 50 (male) to 75 kg with a body mass index of 19- 26 according to Quetelet’s index [weight (kg)/height2 (m)] were enrolled in this study. Volunteers with any physical or laboratory abnormalities, abnormal chest imaging and ophthalmic examination, a history of clinically significant disease (especially drug sensitivity) in response to medical treatment, or a history of clinically significant visual impairment (e.g., vision, visual field, or color abnormality) were excluded.
The test formulation (voriconazole injection, 0.2 g, lot no. PFL180101 with a voriconazole content of 100.5% and expiration date in December 2020) and placebo formulation (lot no. PFLK200501 with expiration date in April 2021) used in this study were obtained from Suzhou Borui Pharmaceutical Co., Ltd. (Suzhou, Jiangsu, China). The reference formulation (Vfend®, 0.2 g, lot no. Z594801 with a voriconazole content of 104.1% and expiration date in December 2021) was produced by Pharmacia & Upjohn Company.
Study Design
This randomized, placebo-controlled, positive- controlled, parallel-group, double-blinded study was approved on May 21, 2020 by the Ethics Committee of the Aerospace Center Hospital (No: EC2020-16). Among 42 subjects, every 14 subjects enrolled in the study were successively assigned to one of three escalation cohorts (3 mg/kg, 4 mg/kg, and 6 mg/kg) when the tolerability assessment for previous administration was good. The subjects of each cohort were randomized 4:2:1 to test formulation, positive control, or placebo. Each subject was administered one single dose (day 1), followed by multiple doses (on days 4-8) every 12 h i.v. for nine doses after three- day washout (Table 1).
| Cohort(n) | Group | Dose on day | |||||
|---|---|---|---|---|---|---|---|
| (n) | 1(i.v.) | 1-3* | 4-7 (i.v.) | 6-7* | 8 (i.v.) | 8-10(or 13)* | |
| 1(14) | Test drug(8) | 3 mg/kg q.d. | PK(time):-1 h | 3 mg/kg b.i.d. | PK(time): | 3 mg/kg q.d. | PKcollection time: |
| Positive drug(4) | (predose)、0.5 h、1 h、1.5 h、2 h(end time)、2.5 h、3 h、4 h、6 h、8 h、12 h、24 h and 48 h | -1 h(predose) and 2 h (end time) | -1 h(predose) 、0.5 h、1 h、1.5 h、2 h(end time) 、2.5 h、3 h、4 h、6 h、8 h、12 h、24 h and 48 h | ||||
| Placebo(2) | |||||||
| 2(14) | Test drug(8) | 4 mg/kg q.d. | The same as above | 4 mg/kg b.i.d. | The same above | 4 mg/kg q.d. | The same as above |
| Positive drug(4) | |||||||
| Placebo(2) | |||||||
| 3(14) | Test drug(8) | 6 mg/kg q.d. | The same as above | 6 mg/kg b.i.d. | The same above | 6 mg/kg q.d. | PK collection time: |
| Positive drug(4) | -1 h(predose) 、0.5 h、1 h、1.5 h、2 h(end time) 、2.5 h、3 h、4 h、6 h、8 h、12 h、24 h、48 h、72 h、96 h and 120 h | ||||||
| Placebo(2) |
Table 1: Dosing regimens* and PK* collection time.
*Voriconazole was infused intravenously (i.v.) at a constant rate for a fixed time (2 hours ±3 min) by dosage design in each cohort. If the 3 mg/kg single dosage was well tolerated, after the three-day washout, the participant was administered the 3 mg/ kg dosage every 12 h i.v. thereafter until the morning of day 8, as well as the 4 mg/kg and 6 mg/kg cohorts. *In the cohort of 6 mg/kg, 72 h, 96 h and 120 h PK collection times were added in the design after day 8 administration. *PK: Plasma pharmacokinetic sampling Table 1: Dosing regimens* and PK* collection time.
PK Assessment
Venous blood samples (sufficient to provide 0.8 ml of plasma) were collected in 3 ml EDTA tubes at the PK collection times shown in Table 1. In the cohort of 3 mg/ kg and 4 mg/kg, sampling was conducted predose and at frequent intervals (on day 1 and day 8) until 216 hours postdose. For the 6 mg/kg, the additional sample at the 240 h, 264 h and 288 h post-dose were collected after the last dose. Plasma was separated by centrifugation (2500 g for 10 min at 4°C) and stored immediately at -80°C until analysis.
The plasma concentrations of voriconazole were quantified by LC–MS/MS. Liquid chromatography was performed on an ExionLCTM UHPLC system (SCIEX) with a Venusil MP C18 column (50 mm×2.1 mm, 5.0 µm; Agela Technologies). An API 4000 triple quadruple mass spectrometer equipped with an electrospray ionization (ESI) source (SCIEX) was used for mass spectrometric detection. The quantitative analysis of voriconazole and IS in human plasma was performed in multiple reaction monitoring (MRM) mode. The detection method was fully validated according to US FDA guidelines. The lower limit of quantification (LLOQ) was 15.0ng/mL, and the method was linear in the concentration range of 15.0–15000 ng/mL.
Pharmacokinetic parameters
Individual PK parameters were calculated by a noncompartmental method using WinNonlin 8.3.1. The maximum observed plasma concentration (Cmax), the plasma concentration immediately before the following dose (Ctrough), and the time to achieve Cmax (Tmax) were determined by directly inspecting the individual plasma concentration–time profiles. The area under the plasma concentration–time curve (AUC) from dosing to the time of the last quantifiable concentration (AUC0-last) and the AUC
up to the time point of the next dosing (12 h) (AUC0-τ) were calculated using the linear-up/log-down trapezoidal method. The terminal elimination constant (λz) was estimated from the natural logarithmic-transformed plasma concentration– time curve using linear regression, and the terminal elimination half-life (t1/2) was calculated as ln2/λz. The AUC from dosing to time infinity (AUCinf) was determined using AUC0-last + C last/λz.
Multiple-dose pharmacokinetics include more parameters in addition to those described above. The average steady-state plasma concentration (Cav, ss) was calculated as AUC0-τ, ss/τ, where AUC0-τ, ss is the AUC in a dosing interval at steady state, which is calculated from 0 to τ h post-dose on Day 8, and τ is the dosing interval (12 h). The minimum plasma concentration (Cmin, ss) is the plasma concentration predose on day 8. The degree of fluctuation (DF) was determined as (Cmax, ss–Cmin, ss)/Cav, ss. The accumulation ratio (RAUC) was calculated from AUC0-τ/ AUC0-12, where AUC0-12 is the AUC calculated from 0 to 12 h postdose on Day 1.
Safety and tolerability assessments
All adverse events (including SAE) that occurred during the trial were recorded, particularly the time of onset, duration, and severity, and their relationship to treatment according to the assessment. City Universal Color Test (2nd ed.) (color vision), Snellen chart (visual acuity), and evaluation of visual impairment observation and follow- up were used to assess visual disturbance during or after drug infusion based on the common adverse reactions to voriconazole. In addition, routine blood and urine tests and clinical chemistry tests (including liver function) were performed at screening, baseline, before the morning dose on days 9 and 11, withdrawal visit, and follow-up visit. Depending on the symptoms and signs during the infusion, further clinical chemistry tests were performed. A 12-lead electrocardiogram was performed once at 2 h after the morning dose infusion when screening, at baseline, at day 9, at day 11, and at the withdrawal visit. If ECG was abnormal with clinical significance, it was performed twice at least 1-minute intervals. Vital signs were measured throughout the study, including at screening, baseline, 1 h prior to the morning dose, 2 h and 8 h after the morning dose on days 1 to 8, 1 h prior to the evening dose, 2 h after the evening dose on days 4 to 7, and 8:00‒10:00 am and 20:00‒22:00 pm on days 2, 3, 9 and 10.
Statistical Analysis
Statistical analysis of the demographics of the subjects and safety was performed using SAS V9.4 (SAS Institute Inc., Cary, NC, USA). The software package Phoenix WinNonlin 8.3 was used to analyze the pharmacokinetic parameters of the test and reference formulation without a placebo group using descriptive statistics (mean, SD, medium, CV, min, and max). A pharmacokinetic analysis of the plasma concentration data was conducted using a nonlinear mixed-effects modeling approach. The power model was used to evaluate the linear relationship between AUC, Cmax, and the dose of voriconazole in plasma, as well as dose-proportional analysis between the single-dose and multiple-dose studies.
The AUCinf, AUC0-t, and C max of voriconazole for the single-dose administration and AUCtau and Cmax,ss of voriconazole for the multiple-dose administration were analyzed for dose proportionality using a power model. The following model was fitted: log e (AUC or Cmax) = μ + β*log e (dose). The estimation obtained for β was a measure of the dose proportionality, which was assessed separately for Chinese subjects. No formal statistical inference was performed for the β estimate. This model was fitted with a simple linear regression (using SAS PROC REG) to estimate the slope of the regression line and a two-sided 95% confidence interval (CI) for the slope coefficient β. The estimated values of the slope close to 1 are considered evidence of dose proportionality.
Results
Participants
A total of 42 subjects were enrolled with a 1:1 sex ratio. These subjects were enrolled into three cohorts (3mg/kg, 4mg/kg and 6mg/kg) (n=14). The demographic characteristics of the 42 subjects in the three cohorts are shown in Table 2. There were no significant differences in age, height, weight, or BMI among the groups. All subjects completed the study, except for one individual who withdrew from the 3 mg/kg cohort on day 4 after the morning infusion of multiple doses as a result of an abnormality in the 12-lead electrocardiogram. All subjects were included in the safety evaluation, and all subjects who received the test formulation of voriconazole or the positive voriconazole were included in the pharmacokinetic analysis.
Safety and tolerability
| 3 mg/kg | 4 mg/kg | 6 mg/kg | ||||||
|---|---|---|---|---|---|---|---|---|
| Test drug | Positive drug | Test drug | Positive drug | Test drug | Positive drug | Placebo | Sum | |
| (n=8) | (n=4) | (n=8) | (n=4) | (n=8) | (n=4) | (n=6) | ||
| Age(year) | ||||||||
| Mean(SD) | 27.25±5.5 | 33.5±4.12 | 35±3.66 | 29.75±7.41 | 31.5±7.27 | 29.5±2.38 | 27.17±4.12 | 30.57±5.75 |
| Height(cm) | ||||||||
| Mean(SD) | 159.88±6.35) | 161.50±4.08 | 162.63±10.01 | 165.63±6.02 | 164.13±6.8 | 165.25±8.61 | 163.50±7.96 | 162.94±7.25 |
| Weight(kg) | ||||||||
| Mean(SD) | 56.49±6.14) | 56.43±4.32 | 60.85±7.31 | 59.55±8.26 | 60.08±6.47 | 62.63±6.78 | 57.78±5.79 | 59.06±6.39 |
| BMI(kg/m2) | ||||||||
| Mean(SD) | 22.08±1.76) | 21.60±0.81 | 22.96±0.65 | 21.63±1.84 | 22.31±2.06 | 22.92±2.12 | 21.58±1.11 | 22.21±1.55 |
Table 2: Demographic characteristics
One subject (female) dropped out from the study due to a multifocal ventricular premature heartbeat observed in the 2 h ECG after the first morning dose infusion of multiple doses compared with the baseline ECG in the 3 mg/ kg cohort. After her withdrawal, a follow-up ECG showed that the multifocal ventricular premature heartbeat had disappeared. Investigators considered it unlikely to be drug-related based on the subject’s past medical history of premature beat but without true disclosure to the investigator at that time during screening. All thirty-six of the subjects receiving voriconazole and six subjects in the placebo group experienced 83 treatment-emergent adverse events (TEAEs) (Table 3). Among them, in the highest-dose regimen (6 mg/kg), one subject experienced a severe rash in Grade 3, three subjects experienced five moderate adverse reactions in Grade 2 (two serum aspartate aminotransferase (AST) elevation, one alanine aminotransferase (ALT) elevation, and one dizziness and one ear stuffiness). Other adverse events were associated with laboratory tests, ECG, hallucinations, insomnia, and visual disturbance; however, all were mild in Grade 1 without SAE. All 35 mild visual disturbances, including 8 flash hallucinations, 13 yellow vision, 8 photophobia, 6 blurred vision, and 1 green vision, were spontaneously reported by a total of nine subjects administered voriconazole. All 41 subjects were generally well tolerated at 10 or 13 days during the SAD and MAD studies.
| 3 mg/kg | 4 mg/kg | 6 mg/kg | |||||||
|---|---|---|---|---|---|---|---|---|---|
| Test drug | Positive drug | Test drug | Positive drug | Test drug | Positive drug | Placebo | Total | ||
| (n=8)n/ cases | (n=4) n/ cases | (n=8) n/ cases | (n=4) n/ cases | (n=8) n/ cases | (n=4) n/ cases | (N=6) n/ cases | (N=42) n/cases | ||
| Body system(SOC) | Adverse event(PT) | 2-Feb | 4-Mar | 9-Jun | 2-Feb | 15/54 | 9-Mar | 3-Feb | 33/83 |
| Ear and Labyrinth disorders | 0/0 | 0/0 | 0/0 | 0/0 | 1-Jan | 0/0 | 0/0 | 1-Jan | |
| Ear discomfort | 0/0 | 0/0 | 0/0 | 0/0 | 1-Jan | 0/0 | 0/0 | 1-Jan | |
| Infection and infestations | 0/0 | 0/0 | 0/0 | 0/0 | 1-Jan | 0/0 | 0/0 | 1-Jan | |
| Herpesvirus infections | 0/0 | 0/0 | 0/0 | 0/0 | 1-Jan | 0/0 | 0/0 | 1-Jan | |
| Investigations | 2-Feb | 4-Mar | 5-Mar | 2-Feb | 8-May | 1-Jan | 1-Jan | 17/23 | |
| White blood cell decreased | 0/0 | 1-Jan | 0/0 | 0/0 | 0/0 | 0/0 | 0/0 | 1-Jan | |
| *ALT increased | 0/0 | 1-Jan | 2-Feb | 0/0 | 2-Feb | 0/0 | 0/0 | 5-May | |
| Urine leukocyte | 0/0 | 0/0 | 0/0 | 0/0 | 1-Jan | 0/0 | 0/0 | 1-Jan | |
| Proteinuria | 0/0 | 0/0 | 0/0 | 1-Jan | 0/0 | 0/0 | 0/0 | 1-Jan | |
| Eosinophil percentage increased | 0/0 | 0/0 | 0/0 | 0/0 | 0/0 | 0/0 | 1-Jan | 1-Jan | |
| *AST increased | 0/0 | 2-Feb | 3-Mar | 0/0 | 2-Feb | 0/0 | 0/0 | 7-Jul | |
| Electrocardiogram QT interval prolonged | 0/0 | 0/0 | 0/0 | 1-Jan | 0/0 | 1-Jan | 0/0 | 2-Feb | |
| Electrocardiogram abnormal | 1-Jan | 0/0 | 0/0 | 0/0 | 0/0 | 0/0 | 0/0 | 1-Jan | |
| Hypokalemia | 0/0 | 0/0 | 0/0 | 0/0 | 3-Mar | 0/0 | 0/0 | 3-Mar | |
| Hypotension | 1-Jan | 0/0 | 0/0 | 0/0 | 0/0 | 0/0 | 0/0 | 1-Jan | |
| Nevous System Disorders | 0/0 | 0/0 | 1-Jan | 0/0 | 5-Mar | 1-Jan | 1-Jan | 8-Jun | |
| Headache | 0/0 | 0/0 | 0/0 | 0/0 | 0/0 | 0/0 | 1-Jan | 1-Jan | |
| Dizziness | 0/0 | 0/0 | 1-Jan | 0/0 | 1-Jan | 1-Jan | 0/0 | 3-Mar | |
| Vertigo | 0/0 | 0/0 | 0/0 | 0/0 | 4-Mar | 0/0 | 0/0 | 4-Mar | |
| Psychiatric Disorders | 0/0 | 0/0 | 1-Jan | 0/0 | 7-Jul | 0/0 | 0/0 | 8-Aug | |
| Hallucination | 0/0 | 0/0 | 0/0 | 0/0 | 2-Feb | 0/0 | 0/0 | 2-Feb | |
| Insomnia | 0/0 | 0/0 | 1-Jan | 0/0 | 5-May | 0/0 | 0/0 | 6-Jun | |
| Skin and Subcutaneous Tissue disorders | 0/0 | 0/0 | 0/0 | 0/0 | 1-Jan | 0/0 | 0/0 | 1-Jan | |
| Urticaria | 0/0 | 0/0 | 0/0 | 0/0 | 1-Jan | 0/0 | 0/0 | 1-Jan | |
| Gastrointestinal Disorders | 0/0 | 0/0 | 0/0 | 0/0 | 0/0 | 0/0 | 1-Jan | 1-Jan | |
| Oral ulcer | 0/0 | 0/0 | 0/0 | 0/0 | 0/0 | 0/0 | 1-Jan | 1-Jan | |
| Cardiac Disorders | 0/0 | 0/0 | 0/0 | 0/0 | 4-Feb | 0/0 | 0/0 | 4-Feb | |
| Infranodal extrasystole | 0/0 | 0/0 | 0/0 | 0/0 | 1-Jan | 0/0 | 0/0 | 1-Jan | |
| First Degree A-V block | 0/0 | 0/0 | 0/0 | 0/0 | 3-Jan | 0/0 | 0/0 | 3-Jan | |
| Eye Disorders | 0/0 | 0/0 | 2-Jan | 0/0 | 27-Sep | 7-Feb | 0/0 | Dec-36 | |
| Xanthopia | 0/0 | 0/0 | 0/0 | 0/0 | 11-Feb | 1-Jan | 0/0 | 12-Mar | |
| Periorbital swelling | 0/0 | 0/0 | 0/0 | 0/0 | 1-Jan | 0/0 | 0/0 | 1-Jan | |
| Chloropia | 0/0 | 0/0 | 0/0 | 0/0 | 1-Jan | 0/0 | 0/0 | 1-Jan | |
| Photopsia | 0/0 | 0/0 | 1-Jan | 0/0 | 3-Feb | 4-Jan | 0/0 | 8-Apr | |
| Blurred vision | 0/0 | 0/0 | 0/0 | 0/0 | 4-Feb | 2-Jan | 0/0 | 6-Mar | |
| Photophoby | 0/0 | 0/0 | 1-Jan | 0/0 | 7-Feb | 0/0 | 0/0 | 8-Mar |
Table 3: Treatment Emergent Adverse events.
Pharmacokinetics
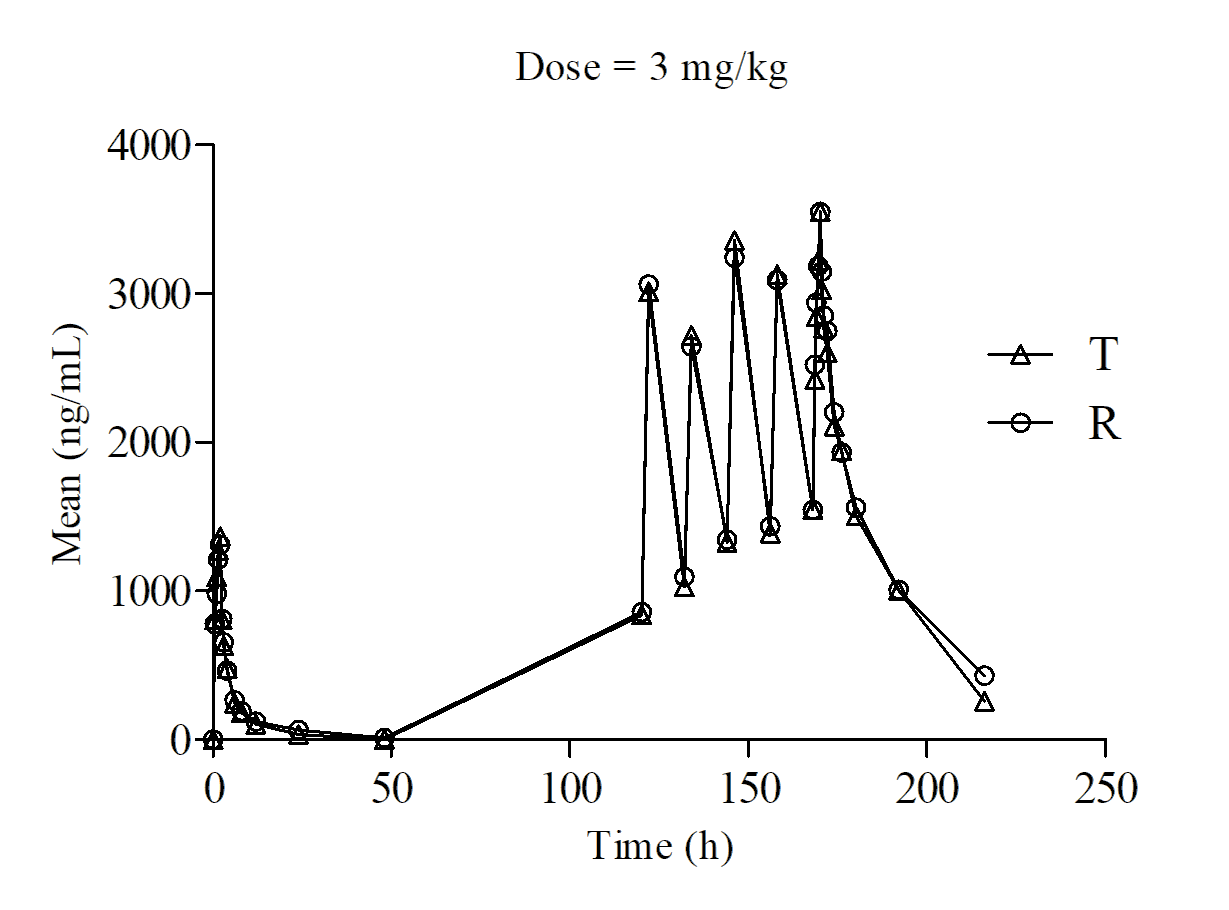
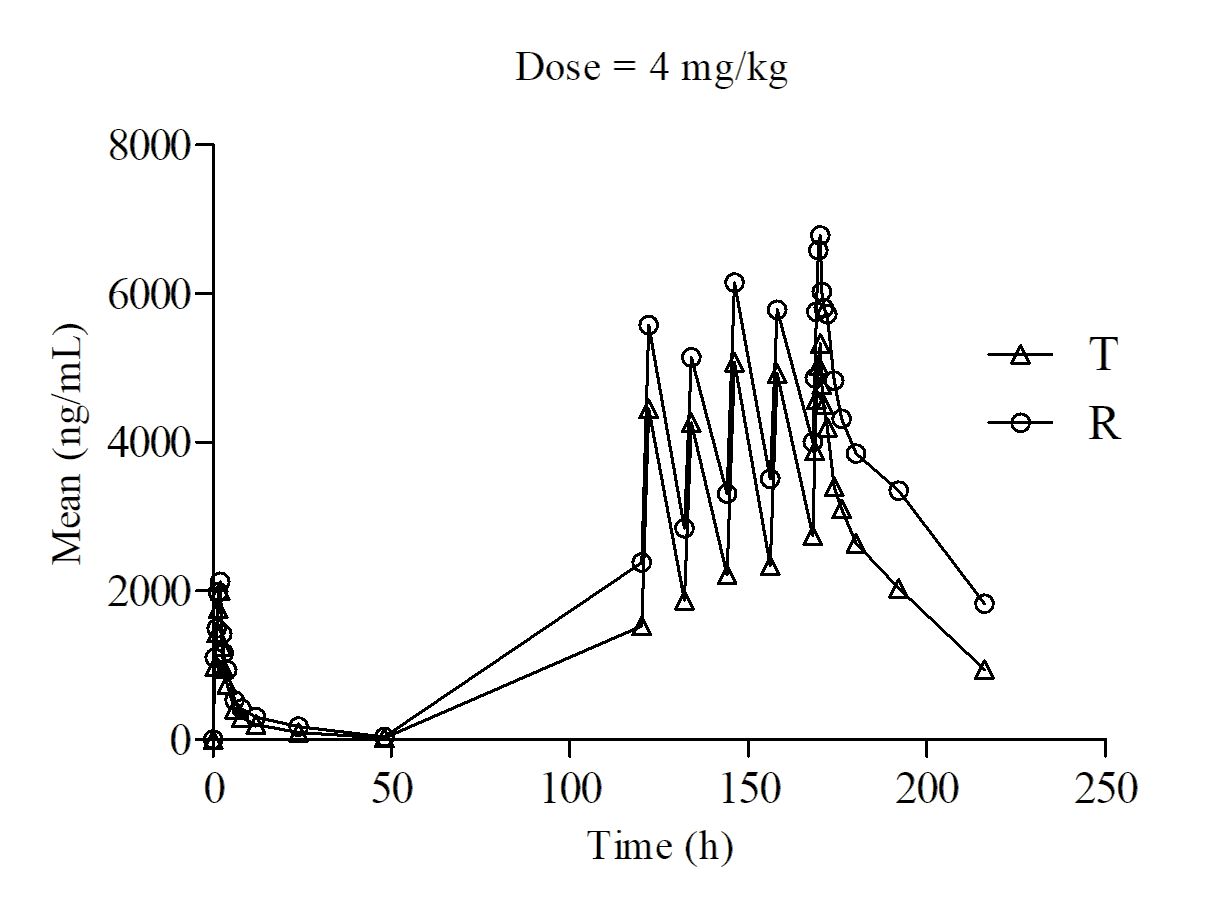
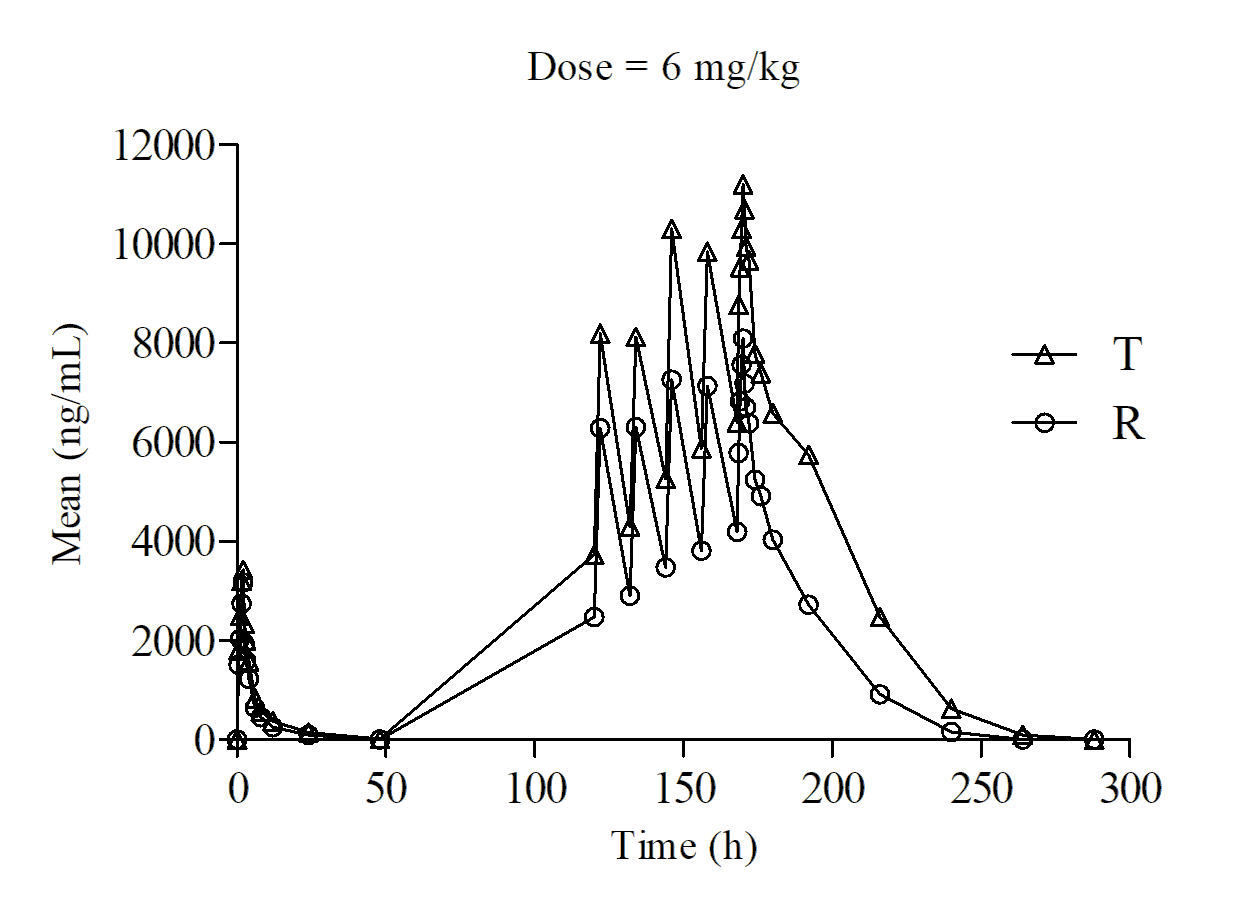
The mean plasma concentration‒time profiles of the test and positive voriconazole in the subjects of the three cohorts after the SAD study are displayed in Figure 1 (3 mg/ kg), Figure 2 (4 mg/kg), and Figure 3 (6 mg/kg). The main pharmacokinetic parameters are summarized in Tables 4 & 5.
| Parameter | t (h) 1/2 | T (h)* max | C (ng/ml) max | AUC (h•ng/mL) 0-48h* | AUC (h•ng/mL) 0-∞ | λ z | ||
|---|---|---|---|---|---|---|---|---|
| Day1-3 | Test drug | Mean±SD | 5.91±2.19 | 2 (1.5,2) | 1395±226.21 (1150~1890) | 5882.41±2504.46 (3349.85~11501) | 6307.86±2962.08 ,(3456.03~13071.9) | 0.08±0.04 |
| 3 mg/ kg(N=8) | CV% | 37.07 | 9.12 | 16.22 | 42.58 | 46.96 | 48.05 | |
| Test drug | Mean±SD | 7.38±4.37 | 2(1.5, 2) | 2001.25±314.48 ,(1670~2580) | 10569.15±6747.11 ,(5541.15~24185) | 11204.44±7550.59 ,(5735.59~26694.37) | 0.08±0.04 | |
| 4 mg/ kg(N=8) | CV% | 59.3 | 9.12 | 15.71 | 63.84 | 67.39 | 62.09 | |
| Test drug | Mean±SD | 7.74±1.14 | 2(1.5,2) | 3461.25±558.99 ,(2870~4580) | 19050.06±4201.76 ,(11517.10~25026.4) | 19723.31±4073.39 ,(12029.60~25282.36) | 0.08±0.04 | |
| 6 mg/ kg(N=8) | CV% | 14.79 | 12.34 | 16.15 | 22.06 | 20.65 | 13.83 | |
| Positive drug 3 mg/ kg(N=4) | Mean±SD | 4.10±1.91 | 2(2,2) | 1312.50±188.39 ,(1130~1560) | 6973.43±4738.70 ,(4363.4~14069.35) | 7325.64±5139.63 ,(4486.09~15020.82) | 0.14±0.08 | |
| CV% | 0 | 14.35 | 67.95 | 70.16 | 42.09 | 61.34 | ||
| Positive drug 4 mg/ kg(N=4) | Mean±SD | 9.48±6.05 | 2(1.5,2) | 2162.50±400.53 ,(1640~2510) | 14283.35±7439.36 ,(5190.6~22745) | 15505.65±8539.06 ,(5397.83~25923.7) | 0.11±0.08 | |
| CV% | 63.81 | 13.33 | 18.52 | 52.08 | 55.07 | 77.55 | ||
| Positive drug 6 mg/ kg(N=4) | Mean±SD | 7.56±1.41 | 2(2,2) | 3177.50±736.13 ,(2170~3920) | 13968.63±3998.84 ,(10285.7~17468) | 14938.04±4144.66 ,(11325.73~18768.51) | 0.09±0.02 | |
| CV% | 18.69 | 0 | 23.17 | 28.63 | 27.75 | 18.39 |
Table 4: PK parameters after single doses of 3 mg/kg, 4 mg/kg and 6 mg/kg administration.
$$ \text{Pk parameter Mean} \pm \text{SD} \quad \text{unit CV\%} \quad \begin{array}{c c c c c} \text{3 mg/kg} & \text{4 mg/kg} & \text{6 mg/kg} \\ \text{Mean} \pm \text{SD} & \text{CV\%} & \text{Mean} \pm \text{SD} & \text{CV\%} \\ \end{array} $$ Test drug (3 mg/kgN=7 ,others $$ \begin{array}{l} \mathrm {N} = 8) \quad * \mathrm {T} _ {\max , \mathrm {s s}} \quad \mathrm {h} \quad 1 7 0 (1 7 0, 1 7 0) \quad 0 \quad 1 7 0 (1 6 9. 5, 1 7 0) \quad 0. 1 \quad 1 7 0 (1 6 9. 5, 1 7 0) \quad 0. 1 4 \\ \end{array} $$ day8- 10(6 mg/ kg: day 8-13 ) #AUC0-12h, ss h*ng/ mL $$
^ {\#} \mathrm {A U C} _ {0 - \infty} \quad \mathrm {h} ^ {*} \mathrm {n g} / \mathrm {m L} \quad 6 3 9 5 0. 3 8 \pm 4 5 1 1 0. 5 5 (2 6 2 6 8. 9 5 \sim 1 3 3 3 8
$$ \text{Pk parameter Mean} \pm \text{SD} \quad \text{unit CV\%} \quad \begin{array}{c c c c c} \text{3 mg/kg} & \text{4 mg/kg} & \text{6 mg/kg} \\ \text{Mean} \pm \text{SD} & \text{CV\%} & \text{Mean} \pm \text{SD} & \text{CV\%} \\ \end{array} $$ Test drug (3 mg/kgN=7 ,others $$ \begin{array}{l} \mathrm {N} = 8) \quad * \mathrm {T} _ {\max , \mathrm {s s}} \quad \mathrm {h} \quad 1 7 0 (1 7 0, 1 7 0) \quad 0 \quad 1 7 0 (1 6 9. 5, 1 7 0) \quad 0. 1 \quad 1 7 0 (1 6 9. 5, 1 7 0) \quad 0. 1 4 \\ \end{array} $$ day8- 10(6 mg/ kg: day 8-13 ) #AUC0-12h, ss h*ng/ mL $$ ^ {\#} \mathrm {A U C} _ {0 - \infty} \quad \mathrm {h} ^ {*} \mathrm {n g} / \mathrm {m L} \quad 6 3 9 5 0. 3 8 \pm 4 5 1 1 0. 5 5 (2 6 2 6 8. 9 5 \sim 1 3 3 3 8 1. 1 3) \quad 7 0. 5 4 \quad 1 7 8 0 4 9. 9 4 \pm 2 2 2 9 4 3. 0 5 (3 1 5 3 3. 2 3 \sim 6 8 8 0 5 0. 6 7) \quad 1 2 5. 2 1 $$ AUC_%Extrap_ Day 8-10 (6 mg/ kg:day 8-13 ) Positive drug\(N=4 in each dose) $$ \left| \begin{array}{c c c} ^ {\#} \mathrm {A U C} _ {0 - \infty} & \mathrm {h} ^ {*} \mathrm {n g} / \\ & \mathrm {m L} & \left| \begin{array}{c c} 1 6 6 0 5 4. 7 9 \pm 9 3 4 9 9. 6 4 \\ (7 2 5 7 3. 2 7 \sim 2 7 3 1 5 3. 3 9) \end{array} \right| 1 1 3. 4 5 \end{array} \right| $$ AUC_%Extrap_ $$ \begin{array}{l l l l} \mathrm {M e a n} \pm \mathrm {S D} & \mathrm {C V} \% & \mathrm {M e a n} \pm \mathrm {S D} & \mathrm {C V} \% \\ \hline \end{array} $$ $$ t _ {1 / 2} \quad \mathrm {h} \quad 1 1. 7 9 \pm 5. 7 7 \quad 4 8. 9 4 \quad 2 1. 4 \pm 2 1. 8 8 \quad 1 0 2. 2 3 \quad 9. 4 5 \pm 0. 9 5 \quad 1 0. 0 6 $$ $$ C _ {\max , \mathrm {s s}} \mathrm {ng} / \mathrm {m L} \quad 3 5 5 0 \pm 8 9 1. 8 7 \quad 2 5. 1 2 \quad 5 3 3 7. 5 0 \pm 1 6 2 6. 2 3 \quad 3 0. 4 7 \quad 9 6 1 7. 5 \pm 1 5 4 5. 0 1 \quad 1 6. 0 6 $$ $$ C _ {\min , \mathrm {s s}} \mathrm {ng} / \mathrm {m L} 1 4 8 6. 2 9 \pm 7 8 3. 4 7 5 2. 7 1 2 6 1 6. 1 3 \pm 1 6 2 7. 4 8 6 2. 2 1 5 3 7 8. 7 5 \pm 1 1 9 3. 6 1 2 2. 1 9 $$ $$ C _ {\mathrm {a v}, \mathrm {s s}} \quad \mathrm {n g / m L} \quad 2 2 4 5. 3 2 \pm 8 4 7. 8 9 \quad 3 7. 7 6 \quad 3 6 3 1. 0 5 \pm 1 6 5 7. 0 9 \quad 4 5. 6 4 \quad 7 0 7 5. 5 2 \pm 1 2 8 1. 9 6 \quad 1 8. 1 2 $$ $$ \begin{array}{l} 2 6 9 4 3. 8 6 \pm 1 0 1 7 4. 6 7 \\ 3 7. 7 6 \quad 5 9 2 2 6. 2 5 \pm 2 1 1 0 2. 3 4 \\ 4 5. 6 4 \\ \end{array} $$ $$ \begin{array}{l l l l l l} 2 6 9 4 3. 8 6 \pm 1 0 1 7 4. 6 7 \\ (1 6 4 1 8. 2 5 \sim 4 2 4 8 7. 5 0) \end{array} \quad 3 7. 7 6 \quad \begin{array}{l l l l l l} 5 9 2 2 6. 2 5 \pm 2 1 1 0 2. 3 4 \\ (2 8 2 3 7. 5 \sim 7 2 6 7 7. 5) \end{array} \quad 4 5. 6 4 \quad \begin{array}{l l l l l l} 8 4 9 0 6. 2 5 \pm 1 5 3 8 3. 5, (5 9 1 6 5 \sim 1 0 5 2 4 2. 5) \end{array} \quad 1 8. 1 2 $$ $$ \begin{array}{c} 2 7 2 0 1 7. 8 1 \pm \\ 6 3 1 0 3. 6 8 \\ (1 4 2 3 2 1. 1 7 \sim \\ 3 3 5 9 4 0. 3) \end{array} $$
23.2 $$ C _ {_ {\%} \mathrm {Extrap} _ {_ {o b s}}} \% 7. 4 6 \pm 7. 0 7 9 4. 8 1 1 5. 6 2 \pm 2 2. 6 5 1 4 4. 9 8 0. 3 1 \pm 0. 1 3 4 3. 7 $$ $$
V z, s s / F \quad L \quad 1 1
23.2 $$ C _ {_ {\%} \mathrm {Extrap} _ {_ {o b s}}} \% 7. 4 6 \pm 7. 0 7 9 4. 8 1 1 5. 6 2 \pm 2 2. 6 5 1 4 4. 9 8 0. 3 1 \pm 0. 1 3 4 3. 7 $$ $$ V z, s s / F \quad L \quad 1 1 1. 5 5 \pm 2 3. 9 9 \quad 2 1. 5 \quad 1 5 6. 0 1 \pm 7 9. 3 3 \quad 5 0. 8 5 \quad 1 3 2. 4 4 \pm 2 4. 3 6 \quad 1 8. 4 $$ $$ \mathrm {C l} _ {\mathrm {s s}} / \mathrm {F} \quad \mathrm {L} / \mathrm {h} \quad 6. 9 3 \pm 1. 9 3 \quad 2 7. 8 4 \quad 6. 6 0 \pm 2. 8 1 \quad 4 2. 5 7 \quad 4. 3 5 \pm 0. 5 8 \quad 1 3. 3 6 $$ $$ R _ {\mathrm {A U C}} / \quad 5. 1 8 \pm 1. 0 7 \quad 2 0. 5 8 \quad 5. 5 9 \pm 1. 1 5 \quad 2 0. 6 3 \quad 5. 8 2 \pm 0. 4 7 \quad 8. 1 4 $$ $$ R _ {\mathrm {C} \max } / \quad 2. 5 0 \pm 0. 4 4 \quad 1 7. 4 6 \quad 2. 6 3 \pm 0. 4 6 \quad 1 7. 4 7 \quad 2. 7 9 \pm 0. 2 8 \quad 1 0. 1 1 $$ $$ t _ {1 / 2} \mathrm {h} 1 5. 2 7 \pm 1 6. 2 2 1 0 6. 2 1 2 9. 5 5 \pm 1 8. 0 4 6 1. 0 5 9. 8 4 \pm 2. 7 2 2 7. 5 9 $$ *Tmax,ss h 170(170,170) 0 170(169.5,170) 0.15 170(170,170) 0 $$ C _ {\max , \mathrm {s s}} \quad \mathrm {n g / m L} \quad \begin{array}{l l l l l l l} 8 0 9 0. 0 0 \pm 2 1 0 1. 8 2 \\ (5 7 1 0. 0 0 \sim 1 0 2 0 0. 0 0) \end{array} \quad 3 2. 8 8 \quad \begin{array}{l l l l l l l} 6 8 0 7. 5 \pm 1 9 2 0. 7 \\ (3 9 3 0 \sim 7 8 7 0) \end{array} \quad 2 8. 2 1 \quad \begin{array}{l l l l l l l} 8 0 9 0. 0 0 \pm 2 1 0 1. 8 2 \\ (5 7 1 0 \sim 1 0 2 0 0) \end{array} \quad 2 5. 9 8 $$ $$ C _ {\min , \mathrm {s s}} \mathrm {ng} / \mathrm {m L} 1 4 9 8. 2 5 \pm 1 0 0 9. 2 6 6 7. 3 6 3 8 4 7. 5 0 \pm 1 6 8 6. 3 1 4 3. 8 3 4 0 2 0. 0 0 \pm 1 9 1 0. 2 9 4 7. 5 2 $$ $$ C _ {\mathrm {a v}, \mathrm {s s}} \mathrm {n g / m L} \quad 2 3 0 2. 6 6 \pm 1 0 5 6. 5 6 \quad 4 5. 8 8 \quad 4 9 3 5. 5 2 \pm 1 7 5 8. 5 3 \quad 3 5. 6 3 \quad 5 5 5 2. 8 1 \pm 1 9 4 1. 2 7 \quad 3 4. 9 6 $$ $$ ^ {\#} \mathrm {A U C} _ {0 - 1 2 \mathrm {h}, \mathrm {s s}} \quad \mathrm {h} ^ {*} \mathrm {n g} / \mathrm {m L} \quad 6 6 6 3 3. 7 5 \pm 2 3 2 9 5. 2 9 (3 9 9 3 2. 5 0 \sim 9 1 6 5 5) \quad 4 5. 8 8 \quad 5 9 2 2 6. 2 5 \pm 2 1 1 0 2. 3 4 (2 8 2 3 7. 5 \sim 7 2 6 7 7. 5) \quad 3 5. 6 3 \quad 6 6 6 3 3. 7 5 \pm 2 3 2 9 5. 2 9 (3 9 9 3 2. 5 0 \sim 9 1 6 5 5) \quad 3 4. 9 6 $$ $$ \begin{array}{l} 1 6 6 0 5 4. 7 9 \pm \\ 9 3 4 9 9. 6 4 \\ (7 2 5 7 3. 2 7 \sim \\ 2 7 3 1 5 3. 3 9) \\ \end{array} $$ $$ \begin{array}{l} 2 6 8 1 9 3. 5 0 \pm \\ 1 6 8 7 0 9. 0 2 \\ (4 8 8 5 4. 7 3 \sim \\ 4 5 0 8 7 3. 8 3) \\ \end{array} $$
56.31
62.91 $$
C {- \% \mathrm {Extrap} {o b s}} \% 10. 9 8 \pm 2 0. 3 5 1 8 5. 3 6 2 8. 7 6 \pm 2 0. 9 4 7 2. 8 1
62.91 $$ C _ {- \% \mathrm {Extrap} _ {o b s}} \% 10. 9 8 \pm 2 0. 3 5 1 8 5. 3 6 2 8. 7 6 \pm 2 0. 9 4 7 2. 8 1 1. 4 0 \pm 0. 9 1 6 4. 8 1 $$ $$ V z, \mathrm {s s} / F \quad L \quad 1 1 8. 9 4 \pm 4 4. 6 1 \quad 3 7. 5 1 \quad 1 5 9. 8 0 \pm 5 0. 1 6 \quad 3 1. 3 9 \quad 1 1 6. 2 8 \pm 1 3. 6 2 \quad 1 1. 7 2 $$ $$ \mathrm {C l} _ {\mathrm {s s}} / \mathrm {F} \quad \mathrm {L} / \mathrm {h} \quad 7. 2 1 \pm 3. 0 7 \quad 4 2. 5 9 \quad 4. 5 6 \pm 1. 8 2 \quad 3 9. 9 2 \quad 6. 4 1 \pm 2. 8 5 \quad 4 4. 3 7 $$ RAUC / 5.26±0.99 42.59 5.26±0.99 9.19 5.52±0.76 13.7 RCmax / 2.68±0.72 26.98 3.11±0.57 18.35 2.55±0.34 13.33
- *Tmax medium(min, max) #: Mean±SD(min,max), one subject withdraw due to adverse reaction before
Table 5: PK parameters after multiple doses of 3 mg/kg, 4 mg/kg and 6 mg/kg administration.
In the SAD study, the median Tmax was 2 h for the test drug and positive drug with different doses of 3 mg/ kg, 4 mg/kg, and 6 mg/kg. The average range of T1/2 was 5.91~7.74 h and 6.85~9.48 h for the test drug and positive drug with a dose of 3~6 mg/kg, respectively, with slight differences between the two drugs. The Cmax, AUC0–t, and AUC0–∞ of the test and positive voriconazole were 1395.00 ± 226.21 and 1312.50±188.39 ng/mL, 5882.41±2504.46 and 6973.43±4738.70 h*ng/mL, and 6307.86 ± 2962.08 and 7325.64 ± 5139.63 h*ng/mL at 3 mg/kg, respectively; 2001.25 ± 314.48 and 2162.50 ± 400.53 ng/mL, 10569.15 ± 6747.11 and 14283.35 ± 7439.36 h*ng/mL, 11204.44 ± 7550.59 and 15505.65 ± 8539.06 h*ng/mL at 4 mg/kg, respectively; and 3461.25 ± 558.99 and 3177.50 ± 736.13 ng/mL, 19050.06 ± 4201.76 and 13968.63 ± 3998.84 h*ng/ mL, 19723.31 ± 4073.39 and 14938.04 ± 4144.66 h*ng/mL at 6 mg/kg, respectively.
In the MAD study with different doses of 3 mg/kg, 4 mg/ kg, and 6 mg/kg, test and positive drugs were administered intravenously nine times, q12 h from day 4 to day 7, and once in the morning of day 8. On day 4 and 5, both drugs reached steady state. The average Tmax in the steady state was 170.00 h for the two drugs. The Cmax, AUC0–t, and AUC0–∞ of the test and positive voriconazole was 3550.00 ± 891.87 and 3547.50 ± 1166.37 ng/mL, 26943.86 ± 10174.67 and 27631.88 ± 12678.71 h*ng/mL, and 63950.38 ± 45110.55 and 83980.04 ± 95273.34 h*ng/mL at 3 mg/kg, respectively; 5337.50 ± 1626.23 and 6807.50 ± 1920.70 ng/mL, 43572.63 ± 19885.07 and 59226.25 ± 21102.34 h*ng/mL, and 178049.94 ± 222943.05 and 268193.50 ± 168709.02 h*ng/mL at 4 mg/kg, respectively; and 9617.50 ± 1545.01 and 8090.00 ± 2101.82 ng/mL, 43572.63 ± 19885.07 and 59226.25 ± 21102.34 h*ng/mL, and 272017.81 ± 63103.68 and 166054.79 ± 93499.64 h*ng/mL at 6 mg/kg, respectively.
In the steady state after multiple administration, RAuc (mean±SD)of test drug vs positive control drug of 3 mg/ kg, 4 mg/kg, and 6 mg/kg was 5.18 ± 1.07 and5.26 ± 0.99, 5.59 ± 1.15 and 6.27 ± 0.58, and5.82 ± 0.47and 5.52 ± 0.76, respectively; and Rcmax (mean ± SD) were 2.50 ± 0.44 and 2.68 ± 0.72, 2.63 ± 0.46 and 3.11 ± 0.57,and 2.79 ± 0.28 and 2.55 ± 0.34, respectively.
For the test intravenous voriconazole, a 2-fold increase in the single dose from 3 mg/kg to 6 mg/kg resulted in a 2.5- and 3.2-fold increase in Cmax and AUC0-t, respectively. The pharmacokinetics of the test intravenous voriconazole are characterized by high interindividual variability with a coefficient of variance of Cmax up to 67.95% and AUC0-τ up to 70.16% at a single dose and nonlinear pharmacokinetics with a regression coefficient of Cmax of 1.31 and AUC0-τ of 1.75 at a single dose and Cmax of 1.39 and AUC0-τ of 1.57 at multiple doses. There was a greater proportion of drug exposure increase than dose increase.
Discussion
The safety, toleration, and pharmacokinetics of intravenous voriconazole in healthy Chinese subjects were evaluated in three cohorts of different dose regimens after SAD and MAD administration at 3 mg/kg, 4 mg/kg, and 6 mg/ kg. A total of 42 healthy subjects were enrolled in this study, 41 of whom completed all the drug administration tests according to the requirements of the scheme; one subject was withdrawn due to an AE after completing a single dose of PK.
In general, this pharmacokinetic study showed high intersubject variability. As a consequence of this high variability, different patients treated with voriconazole at the same dose can exhibit a wide range of drug concentrations in their plasma. The results of this study showed that voriconazole exhibits nonlinear pharmacokinetics in healthy Chinese adults, which is consistent with the original voriconazole. This nonlinearity may be due to saturable systemic clearance (CL) [9]. In a single intravenous infusion, the PK parameters of different doses were essentially the same, with a consistent trend of dose escalation between the test drug and the positive drug.
After multiple doses of voriconazole were administered, in each dose cohort, significant accumulation of voriconazole in plasma was observed in the body of the subjects for the test drug and the positive-controlled drug voriconazole due to the nonlinear phamacokinetics. It showed a steady state on day 8 (D8) with significant dose-dependent accumulation and decreased systemic CL, showing a slightly increasing trend with increasing dose, with no significant difference in this study for either the test drug or positive drug. The accumulation index of RAUC and Rcmax in the test formulation group increased slightly with an increase in the dose. An atypical linear relationship was observed between single-dose and multiple-dose studies. Exposure, in terms of peak plasma concentration (Cmax) and AUC, increased in a disproportionate manner with dosage. The proportion of increased drug exposure was greater than that of the increased dose.
For the test formulations, a 2-fold increase in the single dose from 3 mg/kg to 6 mg/kg resulted in a 2.5- and 3.2-fold increase in Cmax and AUC0-t, respectively. After multiple dosing with 3 mg/kg IV bid, the Cmax and AUC0-t values increased approximately 2.5- and 4.5-fold, respectively, after a single dosing, which was similar to 4 mg/kg and 6 mg/ kg respectively. In general, these pharmacokinetic studies showed high intersubject variability in the estimates of Cmax and AUC following SAD and MAD studies. Intersubject
variability (expressed as CV %) ranged from approximately 15% to greater than 100%.
The AEs of the test drug and positive drug groups increased with an increase in dose. Multiple doses of voriconazole were well tolerated in these studies, and no serious adverse events were observed. The main AEs, such as elevated aspartate aminotransferase, insomnia, elevated alanine aminotransferase, flash hallucination, yellow vision, photophobia, blurred vision, vertigo, decreased serum potassium, and prolonged QT interval of ECG, all reported adverse reactions according to the instructions for positive- controlled drugs. The overall safety of the test formulation and placebo were tolerable. The excipient Betadex sulfobutyl ether sodium and SBECD as a solubilizer was accepted and should be monitored in the future clinical therapeutic drug monitoring. Therefore, in the clinical therapeutic drug monitoring, the investigator should monitor cardiovascular system, infusion related reactions, hepatotoxicity, monitoring of liver function, visual adverse reactions, renal adverse reactions, monitoring of renal function, skin adverse reactions, embryo fetal toxicity and laboratory examination, etc.
In this study, the most frequent TEAEs of voriconazole were transient visual disturbances without structural or functional sequelae. None of the subjects discontinued the study due to visual adverse events. Several studies of voriconazole have shown that the most distinctive visual reaction to the drug is an altered or enhanced perception of light [7, 14, 15, 16, 17]. Other reactions have included blurred vision, color vision change, and photophobia [18]. The visual reactions observed in this study were similar to those previously reported and were all classified as mild in nature, transient, and spontaneously resolved [19].
In summary, the pharmacokinetic parameters of healthy Chinese volunteers showed nonlinear characteristics after single and multiple intravenous infusions of different doses of voriconazole (3 mg/kg, 4 mg/kg and 6 mg/kg). Significant dose-dependent accumulation in the bodies of the subjects was observed after repeated administration in each cohort. The accumulation index RAUC and RCmax increased slightly with an increase in the dose. Adverse events were mainly mild (grade 1), and the main drug-related AEs in the study were expected. The frequency of AE increased with an increase in dose. The overall safety was tolerable. In conclusion, the pharmacokinetics, safety, and tolerability of test voriconazole were comparable to those of Vfend® after SAD and MAD intravenous infusion. The generic test voriconazole can be further verified as a clinically effective alternative to Vfend® in a bioequivalent study in healthy Chinese adults.
References
-
Perfect JR, Marr KA, Walsh TJ, Greenberg RN, Bertrand DP, et al. (2003) Voriconazole Treatment for Less-Common, Emerging, or Refractory Fungal Infections. Clin Infect Dis 36(9): 1122-1131.
-
Radford SA, Johnson EM, Warnock DW (1997) In Vitro Studies of Activity of Voriconazole (UK-109,496), a New Triazole Antifungal Agent, Against Emerging and Less-Common Mold Pathogens. Antimicrob Agents Chemother 41(4): 841-843.
-
Kontoyiannis DP, Marr KA, Park BJ, Alexander BD, Anaissie EJ, et al. (2010) Prospective Surveillance for Invasive Fungal Infections in Hematopoietic Stem Cell Transplant Recipients, 2001–2006: Overview Of the Transplant-Associated Infection Surveillance Network (TRANSNET) Database. Clin Infect Dis 50(8): 1091-1100.
-
Walsh TJ, Anaissie EJ, Denning DW, Raoul H, Kontoyiannis DP, et al. (2008) Treatment of Aspergillosis: Clinical Practice Guidelines of the Infectious Diseases Society of America. Clin Infect Dis 46(3): 327-360.
-
Weiss J, Ten Hoevel MM, Burhenne J, Walter Sack I, Hoffmann M, et al. (2009) CYP2C19 Genotype is a Major Factor Contributing to the Highly Variable Pharmacokinetics of Voriconazole. J Clin Pharmacol 49(2): 196-204.
-
Saravolatz LD, Johnson LB, Kauffman CA (2003) Voriconazole: A New Triazole Anti-Fungal Agent. Clinical Infectious Diseases 36(5): 630-637.
-
Denning DW, Ribaud P, Milpied N, Caillot D, Herbrecht R, et al. (2002) Efficacy and Safety of Voriconazole in the Treatment of Acute Invasive Aspergillosis. Clin Infect Dis 34(5): 563-571.
-
Zonios DI, Gea Banacloche J, Childs R, Bennett JE (2008) Hallucinations during Voriconazole Therapy. Clin Infect Dis 47(1): 7-10.
-
Lee S, Kim BH, Nam WS, Yoon SH, Cho JY, et al. (2012) Effect of CYP2C19 Polymorphism on the Pharmacokinetics of Voriconazole after Single and Multiple Doses in Healthy Volunteers. J Clin Pharmacol 52(2): 195-203.
-
Vfend IP (2017) Prescribing information. Revis March.
-
Benitez LL, Carver PL (2019) Adverse Effects Associated with Long-Term Administration of Azole. Anti AG Drugs 79(9): 833-853.
-
von Mach MA, Burhenne J, Weilemann LS (2006) Accumulation of the Solvent Vehicle Sulphobutylether Beta Cyclodextrin Sodium in Critically Ill Patients Treated with Intravenous Voriconazole Under Renal Replacement Therapy. BMC Clin Pharmacol 6: 6.
-
Hyewon C, Howard L, Han HK, Hyungmi A, Soo LK, et al. (2015) A Pharmacokinetic Comparison of Two Voriconazole Formulations and the Effect of CYP2C19 Polymorphism on their Pharmacokinetic Profiles[J]. Drug Des Devel Ther 9: 2609-2616.
-
Walsh TJ, Lutsar I, Driscoll T, Dupont B, Roden M, et al. (2002) Voriconazole in the Treatment of Aspergillosis, Scedosporiosis and other Invasive Fungal Infections in Children. Pediatr. Infect Dis J 21(3): 240-248.
-
Herbrecht R, Denning DW, Patterson TF, Bennett JE, Greene RE, et al. (2002) Voriconazole Versus Amphotericin B for Primary Therapy of Invasive Aspergillosis. N Engl J Med 347(6): 408-415.
-
Andes D, Marchillo K, Stamstad T, Conklin R (2003) In Vivo Pharmacokinetics and Pharmacodynamics of a New Triazole, Voriconazole, In a Murine Candidiasis Model. Antimicrob Agents Chemother 47(10): 3165-3169.
-
Walsh TJ, Pappas P, Winston DJ, Lazarus HM, Petersen F, et al. (2002) Voriconazole Versus Liposomal Amphotericin B for Empirical Antifungal Therapy in Persistently Febrile Neutropenic Patients: A Prospective, Randomized, Multicenter, International Trial. N Engl J Med 346(22): 225-234.
-
Walsh TJ, Pappas P, Winston DJ, Karlsson MO, Driscoll T, et al. (2004) Pharmacokinetics And Safety Of Intravenous Voriconazole In Children After Single- Or Multiple-Dose Administration. Antimicrob Agents Chemother 48(6): 2166-2172.
-
Purkins L, Wood N, Ghahramani P, Greenhalgh K, Kleinermans D, et al. (2002) Pharmacokinetics and Safety of Voriconazole Following Intravenous- To Oral-Dose Escalation Regimens. Antimicrob Agents Chemother 46(8): 2546-2553.
- Gallic and Citric Acid Present in the Peels of Tropical Fruits as an Alternative in the Fight against Cancer
- Treating the Forehead Lines with Combination of Forehead and Glabellar Botulinum Toxin Among Japanese Patients
- Clinical Evaluation of Patients Suffering from Breast Cancer & Determination of Treatment Therapies and Better Strategies Related to Breast Cancer
- Medieval Recipes by Al-Zahrāwī for Heart Palpitations Treatment
- Etiology and Prescription Errors of Myocardial Infarction in Different Health Care Systems of Azad Kashmir
- Early Diagnosis and Multidisciplinary Management of Turner Syndrome: A Paediatric Case Study