MR Perfusion-Diffusion Mismatch in Acute-Recurrent Ischemic Stroke: Quantitative and Qualitative Progression from Malignant to Misery Profile
We report the use magnetic resonance perfusion to image penumbra, in a patient with acute ischemic stroke as a tool to differentiate candidates for endovascular therapy. A 62-year-old man with three episodes of acute-recurrent ischemic stroke related to infective endocarditis underwent brain MRI on days 1st, 8th and 15th; his perfusion profiles evolve from malignant to misery on days 8th and 15th. Because conventional MRI is relatively insensitive to changes of acute ischemia, it should be supplemented with DWI-PWI sequences to identify patients in the hyperacute-ischemic phase that would benefit from thrombolysis.
Introduction
Current magnetic resonance imaging (MRI) of ischemic penumbra is performed using perfusion- weighted imaging (PWI) and diffusion-weighted imaging (DWI); these techniques allows a quantitative evaluation of stroke [1]. It is possible to calculate the cerebral blood flow (CBV), cerebral blood volume (CBF), time to peak (TTP), mean transit time and apparent diffusion coefficient (ADC) values. This assessment helps to identify patients who would benefit from endovascular therapy in acute ischemic stroke [2]. The mismatch, between areas of decreased diffusion-weighted imaging (DWI), subtracted from regions of hypoperfusion on PWI, and has been accepted as the penumbra zone.
Case Report
A 62-year-old male arrived at the emergency room presenting bradypsychia, ideomotor apraxia, and ataxic gait; NIH Stroke Scale (NIHSS) score was 18. Vascular risk factors included: hypertension (ongoing treatment with athiazidic diuretic agent) and type 2 diabetes mellitus (controlled with anoral hypoglycemic agent). Other relevant medical history included: metastatic urothelial carcinoma (treated with surgical removal and dual chemotherapy).
A brain MRI performed 3 hours after symptoms onset revealed a focal area of infarcted brain tissue. There were hyperintensity areas on the DWI sequence exceeding the DWI signal intensity of the contralateral hemisphere by more than two standard deviations [3]. Lesions comprised the supramarginal and angular gyri of the right cerebral hemisphere (a small left parietooccipital region with signs of subacute ischemia was not considered in the evaluation, as it did not depict alteration of its PWI parameters). The lesion was observed on DWI (b-value: 1000 s/mm2; 91.3/6500 TE/TR; 2.0 NEX, 22cm FOV), T2- w and fluid-attenuated inversion recovery (Flair); with T1-w post-gadolinium confined to the supramarginal gyrus. Regions of interest (ROIs) were outlined using a pixel-wise application of the software-package Func Tool 9.4.04b (GE Medical Systems, Wisconsin, USA) to calculate the infarcted-tissue volumes in cm3 and obtain ADC maps. The outlined brain tissue on DWI was considered the core, amass already dead at the time of imaging. The infarcted-tissue volume on DWI was 36.16cm3, ADC value decreased to 50%, 0.452(10)-3mm2/s (the first brain’s evaluation did not include PWI and MR angiography), Figure 1a. We established the diagnosis of focal acute ischemic infarct in the middle cerebral artery (MCA) territory, probably due to atherosclerosis, treatment was initiated anticoagulation. His laboratory tests, electrocardiogram, transthoracic echocardiogram and Holter monitoring were unremarkable. Patient’s symptoms improved and he was discharged without additional medication by day 4th.
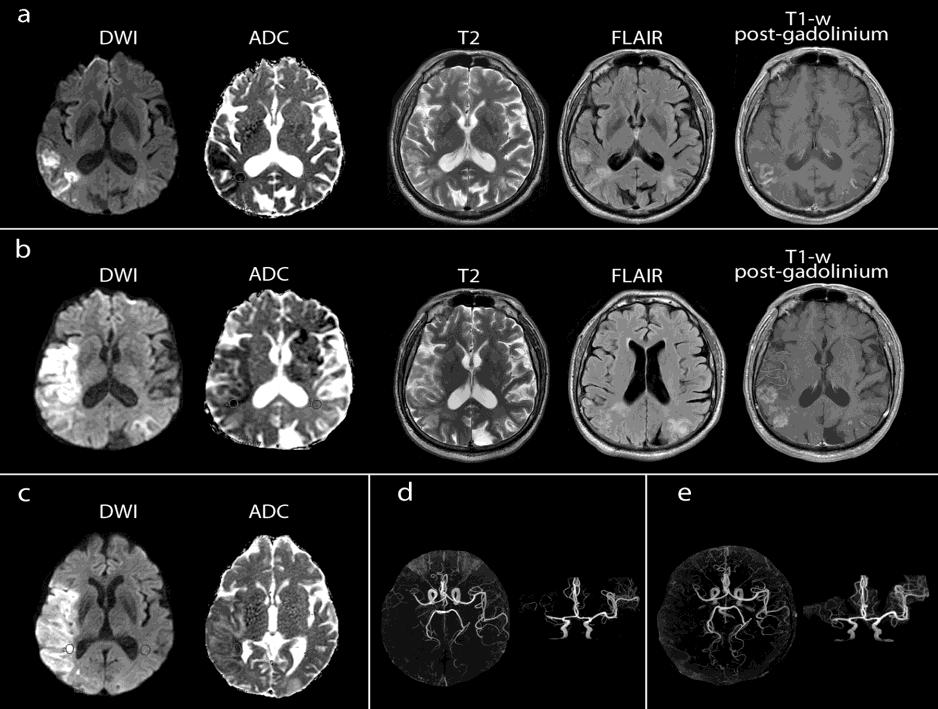
Figures 1a-e: Conventional axial MR images from days 1st (a), 8th (b), and15th (c) showing the acute-recurrent ischemic strokes. MRI Angiogram (d and e) depicts the persistent occlusion of the distal M1 segment of the middle cerebral artery.
On the 8th day, the patient was readmitted to the emergency room after a fall on the floor without loss of consciousness but with complaints of hemibody weakness. Physical examination revealed left facial paralysis, sixth cranial nerve palsy, deviation of the horizontal gaze to the right, anisocoric pupils with a reflexia of the left one, weakness of the left arm and leg, and a right positive Babinski sign; the precordial examination was unremarkable, and his NIHSS score remained 18.
Dynamic susceptibility-contrast enhanced PWI (gradient echo 17/50 TE/TR; 1.0 NEX, 22cm FOV) showed a penumbra volume of 53.579cm3, fulfilling the definition of the malignant profile (CBV and CBF were decreased to 25% and 23% respectively) and a 19.8s delay on the TTP maps, Figure 2a. The patient received citicoline, cerebrolysin, enoxaparin, nicergoline, atorvastatin, and acetaminophen.
A 2nd MRI showed an increase of the brain infarct to 191.42cm3; lesion was hyperintense on DWI, hypointense on ADC maps, not conspicuous on T2-w and Flair, and with enhancement extending to the supramarginal and angular gyri. The ADC value decreased to 38%, 0.377(10)-
3mm2/s and a 3D time-of-flight (TOF) MR angiography evidenced signal loss at the distal M1 segment of the right MCA, Figure 1b.
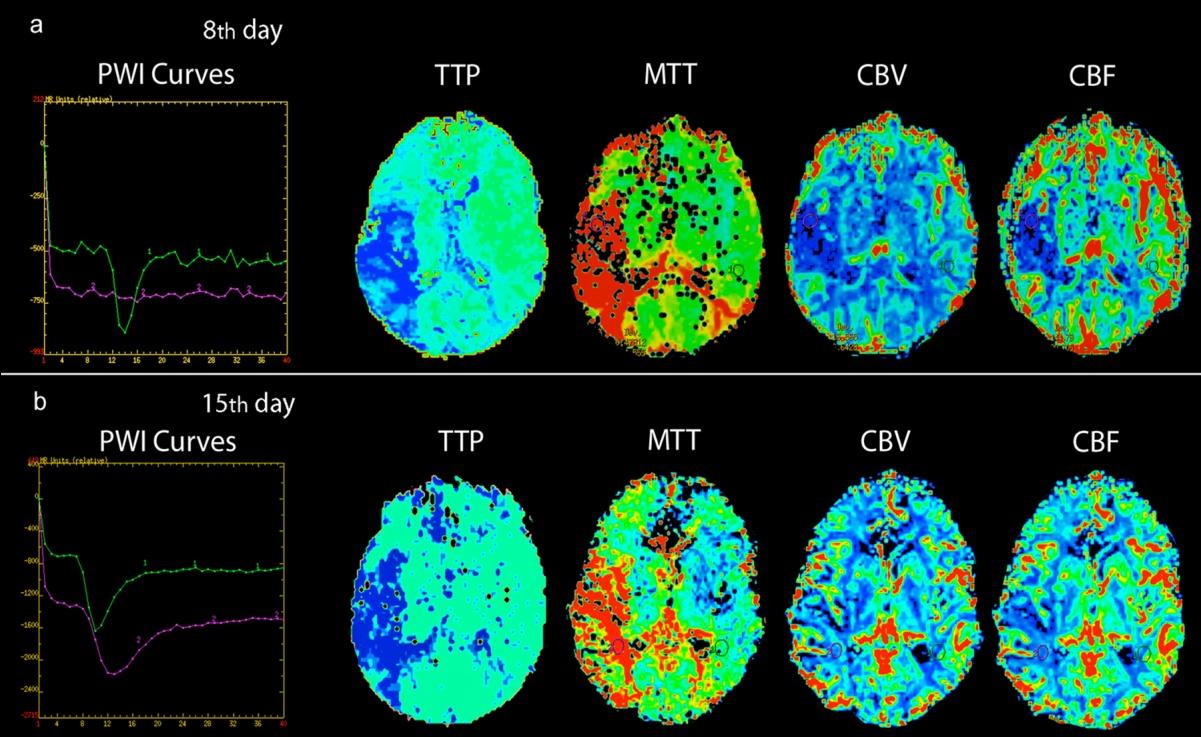
Figures 2a,b: PWI parameters on day 8th (a) and 15th (b). The MTT and TTP maps showed the mismatch between the volume of brain ischemia in perfusion, compared with the volume of the infarcted tissue on diffusion images (Figure 1) supporting the diagnosis of the penumbra in both examinations.
On day 10th intermittent fever and cardiac murmurs, according to Duke Criteria [4], a risen suspicion of bacterial infective endocarditis; a transesophageal echocardiogram (TEE) reported vegetation on the posterior leaflet of the mitral valve, the patient underwent instalment of antibiotic therapy (ceftriaxone and vancomycin).
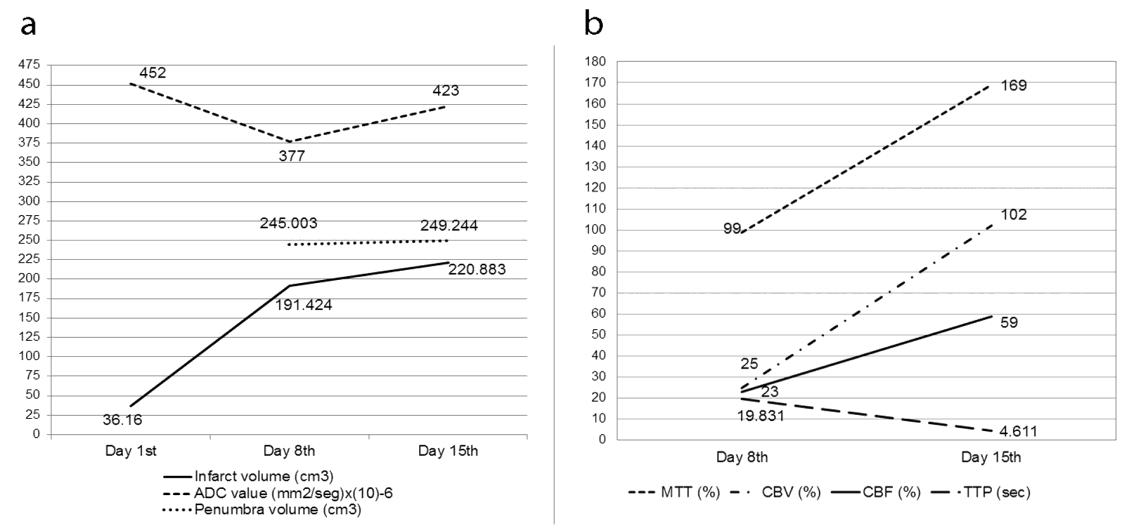
On day 15th a 3rd brain MRI showed an additional increase in the infarct volume to 220.88mm3 with ADC value to 47%, 0.423 (10)-3 mm2/s, Figure 1c. The penumbra volume decreased to 28.361cm3, values of hemodynamic variables corresponded with a misery profile (CBV increased to 102% and CBF continued lowered at 59%), with 4.611s delays on TTP maps. MR angiography showed persistent M1-segment occlusion in right MCA, Figure 2b. Graphical progression of the DWI and PWI data is presentedin Figure 3.
By day 32th a new TEE did not report vegetation or nodular images, and the precordial auscultation did not reveal heart murmurs. By day 48th, the patient was discharged and continued his treatment in the outpatient clinics.
Discussion
This report allows a brief mentioning on several topics related to stroke. First, in patients with infectious endocarditis, the increase in vegetation’s size and mobility increases the chances of embolism, systemic embolisation occurs from 22% to 50% of cases; 65% involving the central nervous system and affecting the MCA in 90% [5]. Second, the conventional MRI sequences (T1-weighted, T2-weighted, and FLAIR) are relatively insensitive to the changes of acute ischemia they have to be complemented with DWI and PWI [6]. DWI-derived ADC values can be used as reference data in acute stroke- specific populations [7].
The frequency of DWI lesion recurrence in cardioembolic stroke has been estimated up to 46.7% [8], with symptomatic lesions more strongly correlated with poor outcome (functional disability at three months after stroke). Third, in hospitals with stroke-centre facilities, PWI should complement the stroke evaluation to calculate regional mapping of cerebral hemodynamics. TTP can identify patients in the hyperacute-ischemic phase that will benefit from thrombolysis [9].
Fourth, the DEFUSE group [10] defined a malignant profile as a baseline lesion on DWI greater than 100cm3. It is associated with more significant infarct growth, lower frequency of reperfusion and less likelihood to have good neurological and functional outcomes [11]. In this case, the patient’s PWI-profiles evolved from malignant to misery (decreased CBF, with elevated CBV, underlying ischemic territories with the poor collateral flow) [12] indicating the brain’s auto-regulation was meagre to overcome the CBF demand.
In conclusion, a multiparametric assessment using volumes of DWI-PWI maps combined with PWI hemodynamics of infarcted and penumbral tissue can document the progression of PWI profiles in patients with acute ischemic stroke; these biomarkers might have prognostic value for patient outcomes.
Acknowledgments
Mariana Lopez-Mejia, M.D., was enrolled as a research fellow at the MRI unit of Medica Sur Clinic & Foundation from 2013 to 2014.
Conflicts of Interest and Source of Funding
The authors have no conflicts of interests to declare. This study was supported in part by the Medica Sur Clinic & Foundation.
References
-
Roldan-Valadez E, Lopez-Mejia M (2014) Current concepts on magnetic resonance imaging (MRI) perfusion-diffusion assessment in acute ischaemic stroke: a review & an update for the clinicians. Indian J Med Res 140(6): 717-728.
-
Kidwell CS, Jahan R, Gornbein J, Alger JR, Nenov V, et al. (2013) A trial of imaging selection and endovascular treatment for ischemic stroke. N Engl J Med 368(10): 914-923.
-
Latchaw RE, Alberts MJ, Lev MH, Connors JJ, Harbaugh RE, et al. (2009) Recommendations for imaging of acute ischemic stroke: a scientific statement from the American Heart Association. Stroke 40(11): 3646-3678.
-
Li JS, Sexton DJ, Mick N, Nettles R, Ryan T, et al. (2000) Proposed modifications to the Duke criteria for the diagnosis of infective endocarditis. Clin Infect Dis 30(4): 633-638.
-
Johnson MD, Johnson CD (2010) Neurologic presentations of infective endocarditis. Neurol Clin 28(1): 311-321.
-
Fiebach JB, Schellinger PD, Jansen O, Meyer M, Wilde P, et al. (2002) CT and diffusion-weighted MR imaging in randomized order: diffusion-weighted imaging results in higher accuracy and lower interrater variability in the diagnosis of hyperacute ischemic stroke. Stroke 33(9): 2206-2210.
-
Lopez-Mejia M, Roldan-Valadez E (2016) Comparisons of Apparent Diffusion Coefficient Values in Penumbra, Infarct, and Normal Brain Regions in Acute Ischemic Stroke: Confirmatory Data Using Bootstrap Confidence Intervals, Analysis of Variance, and Analysis of Means. J Stroke Cerebrovasc Dis 25(3): 515-522.
-
Kim WJ, Kim JH, Youngchai K, Park JH, Yang MH, et al. (2010) Can early ischemic lesion recurrence on diffusion-weighted MRI affect functional outcome after acute ischemic stroke? Journal of clinical neurology 6(1): 19-26.
-
Roldan-Valadez E, Gonzalez-Gutierrez O, Martinez- Lopez M (2012) Diagnostic performance of PWI/DWI MRI parameters in discriminating hyperacute versus acute ischaemic stroke: finding the best thresholds. Clinical radiology 67(3): 250-257.
-
Albers GW, Thijs VN, Wechsler L, Kemp S, Schlaug G, et al. (2006) Magnetic resonance imaging profiles predict clinical response to early reperfusion: the diffusion and perfusion imaging evaluation for understanding stroke evolution (DEFUSE) study. Ann Neurol 60(5): 508-517.
-
Davis SM, Donnan GA, Parsons MW, Levi C, Butcher KS, et al. (2008) Effects of alteplase beyond 3 h after stroke in the Echoplanar Imaging Thrombolytic Evaluation Trial (EPITHET): a placebo-controlled randomised trial. Lancet Neurol 7(4): 299-309.
-
Lev MH (2013) Perfusion imaging of acute stroke: its role in current and future clinical practice. Radiology 266(1): 22-27.
- Ultrasound Guided Therapeutic Nerve Blocks
- Cyclops Lesion Without ACL Reconstruction: A Rare Case in a Patient with Intact Anterior Cruciate Ligament and Tibial Plateau Fracture
- Dosimetric Comparison between Two Dose Calculation Algorithms in SBRT Treatment of Lung Cancer in Ring-based and C-arm Radiation Therapy Equipment
- Adolescent Testicular Adrenal Rest Tumors: A Case Report and Review of the Literature
- Giant Intrathoracic Lipoma: A Rare Presentation
- Image of a Right Renal Angiomyolipoma Complicated by Hemorrhage