MRI Patterns of Brain Toxicity
Toxic and metabolic encephalopathies are important to be recognized timely as if not identified and treated correctly, they can lead to catastrophic outcomes and sequelae. MRI can play an important role in determining the patterns of encephalopathies caused by various metabolites and toxins resulting in determination of most probable diagnosis, leading towards the better management and outcomes of the disease.
Introduction
Brain is highly susceptible to damage from products of and various toxins altered metabolism [1]. MRI can often show the damage and impact to brain parenchyma at both early and delayed phases of disease. In the acute phase, it detects brain areas which are acutely injured and responsible for sudden onset of neurologic dysfunction and symptoms. In the delayed phase, MRI allows identification of neurologic sequelae secondary to prior insult [1]. Basic understanding of imaging appearances of various toxic and metabolic injuries to brain may help narrow differential diagnosis in case of acute encephalopathy [2]. In patient with known exposure to toxic agent, topographic distribution of lesions within the brain parenchyma and their characteristic appearance can help exclude other causes of neurologic impairment [2].
Discussion
This includes typical MRI features of major toxic and metabolic encephalopathies a. Hepatic encephalopathy b. Hypoglycemic encephalopathy c. Acute toxic leukoencephalopathy d. Hypoxic ischemic encephalopathy e. Post ictal encephalopathy Hepatic Encephalopathy It can occur in acute settings with fulminant hepatic failure, or as long standing process in patients with chronic hepatocellular dysfunction that leads to portosystemic shunting [3]. Pathophysiologic basis include cerebral edema caused by increased intracellular osmolytes underlying both acute and delayed forms of Hepatic encephalopathy. Varieties of clinical features are seen, and diagnosis may not be readily manifested in some patients.
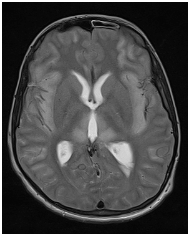
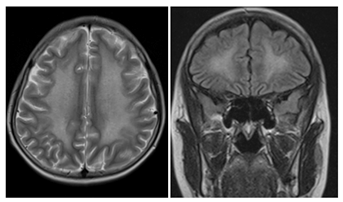
MRI Findings Acute Hepatic Encephalopathy: Bilateral swollen T2/FLAIR hyperintense gyri (most severe insular cortex, cingulate gyri) with diffusion restriction. Perirolandic/occipital regions are relatively spared. ↓ mI/Cr and Cho/Cr ratios and ↑ Glx/Cr ratios (Figure 1).
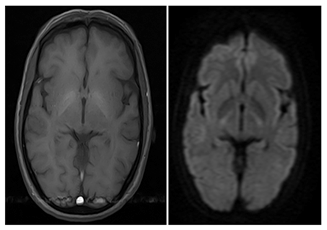
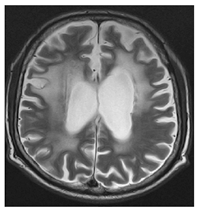
Chronic Encephalopathy: Bilateral T1WI hyperintensity in basal ganglia. ↑ T1WI signal intensity in pituitary gland and hypothalamus, less common (Figure 2).
Hypoglycemic Encephalopathy
Prolonged and persistent hypoglycemic coma can be lethal and causes severe consequences [4]. Topograhic distribution of disease in brain parenchyma involves temporal, occipital, insular cortex; hippocampus and basal ganglia. There is relative sparing of thalami. Deep white matter may be involved, with hypoglycemic injury as evident by symmetric hyperintensity involving internal capsule, corona radiata, and splenium on T2-weighted images [4]. Diffusion restriction may be present within these lesions.
Acute Toxic Leukoencephalopathy
It can be caused by Endogenous and Exogenous causes. Endogenous source primarily include inborn errors of metabolism. Exogenous causes are usually resulting from External and Internal sources I. External source include predominantly toxic substances or deficiencies of various nutrients. II. Internal source include endotoxins, paraneoplastic toxins, uremia and ion balance disorders. There are few basic principles of neurotoxicity which are: a. 1st, There is always dose-response relationship in majority of toxic encephalopathies. That is higher the dose, more is the severity of case and symptoms. b. 2nd, Toxic encephalopathy typically manifests as symmetrical neurological syndrome. If there is asymmetry, alternate cause should be suggested. c. 3rd, There is usually strong relationship between exposure and time of onset of symptoms. After acute exposure, immediate symptoms are often resulting from physiological effects of toxin. These symptoms typically resolve after chemical is eliminated from body. However, delayed or persistent neurological deficits sometimes occur after the resolution of acute symptoms. d. 4th, Due to limited capability of nervous system to regenerate, more chronic sequelae persist after removal of neurotoxic agent, as compared to toxic diseases of other organs. e. 5th, Single neurotoxin may cause multiple neurological syndrome, depending on the amount and duration of the exposure. f. 6th, Variable presentations of clinical disorders of CNS have been observed and they may be mimicked by various other diseases of nervous system. Therefore, good occupational history and perform detailed neurological examination play significantly important part in the evaluation of particular disease. g. 7th, Timing of exposure relative to critical periods of CNS development may play a role in explanation of some of variations in susceptibility. h. 8th, Neurotoxins make the cells more vulnerable to effects of aging, leading to accelerated senescence [5].
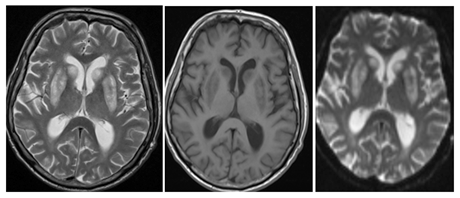
Carbonmonoxide Poisoning: Bilateral and symmetrical involvement of Globus pallidus is seen resulting in necrosis. However, rarely involvement of Caudate and putamen may also be seen. These lesions appear hypointense on T1- weighted and hyperintense on T2-weighted images [6] (Figure 3).
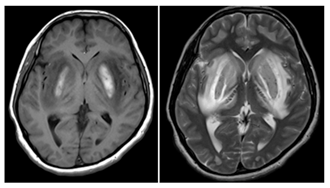
Methanol Poisoning: Bilateral and symmetrical involvement of putamen is seen with necrosis. Presence of hemorrhage is associated with poor prognosis. Lesions appear hyperintense on T2-weighted images and show variable T1-weighted signal, depending on the presence and stage of hemorrhage. Variable enhancement can also be appreciated [7] (Figure 4).
Ethylene Glycol Poisoning: There is symmetric involvement of basal ganglia, thalami, amygdala, hippocampus, and brainstem. Involvement of the white matter tracts with restricted diffusion may also be seen [8].
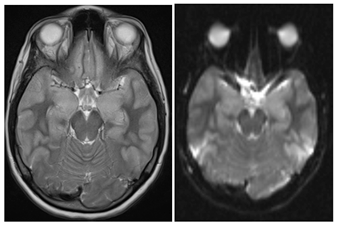
Metronidazole Poisoning: Dentate nuclei in cerebellum are most commonly affected. However, involvement of tectum, red nucleus, periaqueductal gray matter and dorsal pons may also be appreciated. The pattern of involvement is always bilateral and symmetrical, appear hyperintense on T2- weighted images, do not show enhancement on post contrast images, and the effects are reversible after discontinuation of drug [9].
Chemotherapy induced leukoencephalopathy: Focal or diffuse symmetric involvement of periventricular deep white matter and centrum semiovale is seen bilaterally, showing high intensity on FLAIR images with transient diffusion restriction (Figure 5).
Radiotherapy induced leukoencephalopathy: Radiation induced injury to brain can be classified into acute, early delayed and late delayed phases. In early phase, subcortical U-fibers are relatively spared. However, in delayed phases there is diffuse leukoencephalopathy as evident by T2/ FLAIR hyperintense signals in periventricular white matter. More focal form of radiation-induced injury causes necrosis and enhancement of involved cortex and white matter [10] (Figure 6).
Hyperammonemic Encephalopathy: The most common cause of hyperammonemia is acute liver failure, but it can be associated with nonhepatic conditions, most important of which include drug toxicities (valproate and acetaminophen), sepsis, bone marrow transplant, and parenteral nutrition [11]. On MRI, there is bilateral symmetric involvement of insular and cingulate gyri and thalami with relative sparing of occipital lobes and perirolandic region. Basal ganglia involvement is also seen however, hemispheric white matter is typically spared. The lesions appear hyperintense on T2/ FLAIR images and show strong diffusion restriction on DWI/ ADC images.
Hypoxic Ischemic Encephalopathy
Hypoxic-ischemic cerebral injury can occur at any age, although the cause is significantly different. In older children, drowning and asphyxiation are the most common causes and in adults, it is usually caused by cardiac arrest or cerebrovascular disease, with secondary hypoxemia/hypoperfusion. There are basically two patterns in the pathology of hypoxic ischemic encephalopathy: a. The first is the central pattern with injury to the regions of greatest metabolic demand. In this pattern, there is involvement of basal ganglia and brain stem. It is associated with more severe encephalopathy and more severe motor/cognitive outcomes. b. The second pattern is peripheral pattern, in which regions of greatest metabolic demand are relatively preserved. In this pattern, there is injury to watershed zones of cerebral hemispheres. It is associated with prolonged partial ischemia, less severe encephalopathy & seizures and less severe motor/cognitive outcomes.
On MRI, T1 hyperintense signals are identified in Ventrolateral thalamus, ± posterolateral putamen and perirolandic cortex at depths of sulci. There is loss of normal hyperintense signals of corticospinal tract in posterior limb of internal capsule [12]. On T2/FLAIR images, in subacute phase, there is low intensity signal in VLT ± posterolateral putamen and in chronic phase, hyperintense signals ± volume loss in Ventrolateral thalamus ± posterolateral putamen [12]. On DWI/ADC, diffusion restriction may be seen in early phase but the signal usually normalizes in 7-10 days. On MRS, ↓ NAA and ↑ lactate correlate with worse prognosis ↑ α-glutamate/glutamine peaks in basal ganglia correlate with increased severity of injury.
Post Ictal Encephalopathy
Status Epilepticus is defined as greater than 30 minutes of continuous seizures or ≥ 2 seizures without full recovery of consciousness between the episodes of seizures. In patients with already known seizures, the most common causes of status epilepticus are changes in anticonvulsant medication or withdrawal syndrome. In more than 50% cases, there is no prior history of epilepsy and symptoms are usually related to an underlying condition, such as stroke, hypoxia, metabolic derangement, toxicity, encephalitis, alcohol intoxication or withdrawal. On MRI, T1 hpointense and T2 hyperintense signals are appreciated predominantly involving gray matter &/or subcortical white matter with mild mass effect. There may be focal involvement of hippocampus, splenium of corpus callosum, pulvinar of thalamus and occasionally cerebellar involvement is also seen. Affected areas show diffusion restriction on DWI/ADC and variable enhancement on post contrast images. On Perfusion images, marked hyperemia is noted at the site of epileptic focus with elevated rCBE and rCBV maps [13] (Figure 7).
Conclusion
MRI is one of the finest modality in determining different patterns of encephalopathies in brain parenchyma based on their location and imaging characteristics on MRI. Although, many features are shared by multiple etiologies, some findings are characteristic for few conditions. For the diseases sharing common features on MRI, clinical history and laboratory investigations play essential role in the diagnosis of these diseases. Combining clinical findings and other investigations with imaging findings can help to reach a specific diagnosis.
References
-
Sharma P, Eesa M, Scott JN (2009) Toxic and acquired metabolic encephalopathies: MRI appearance. American Journal of Roentgenology 193(3): 879-886.
-
de Oliveira AM, Paulino MV, Vieira APF, McKinney AM, da Rocha AJ, et al. (2019) Imaging Patterns of Toxic and Metabolic Brain Disorders. Radiographics 39(6): 1672- 1695.
-
Haussinger D, Kircheis G, Fischer R, Schliess F, vom Dahl S (2000) Hepatic encephalopathy in chronic liver disease: a clinical manifestation of astrocyte swelling and low- grade cerebral edema? J Hepatol 32(6): 1035-1038.
-
Lo L, Tan AC, Umapathi T, Lim CC (2006) Diffusion- weighted MR imaging in early diagnosis and prognosis of hypoglycemia. Am J Neuroradiol 27(6): 1222-1224.
-
Dobbs MR (2011) Toxic encephalopathy. Semin Neurology 31(2): 184-193.
-
Donnell OP, Buxton PJ, Pitkin A, Jarvis LJ (2000) The magnetic resonance imaging appearances of the brain in acute carbon monoxide poisoning. Clin Radiol 55(4): 273-280.
-
Sefidbakht S, Rasekhi AR, Kamali K, Haghighi AB, Salooti A, et al. (2007) Methanol poisoning: acute MR and CT findings in nine patients. Neuroradiology 49(5): 427- 435.
-
Moore MM, Kanekar SG, Dhamija R (2008) Ethylene glycol toxicity: chemistry, pathogenesis, and imaging. Radiol Case Rep 3(1): 122.
-
Kim E, Na DG, Kim EY, Kim JH, Son KR, et al. (2007) MR imaging of metronidazole-induced encephalopathy: lesion distribution and diffusion-weighted imaging findings. Am J Neuroradiol 28(9): 1652-1658.
-
Espagnet MC, Carducci C, Galassi S, Bernardi B, Cacchione A, et al. (2016) MRI patterns of brain toxicity in children. European Congress of Radiology.
-
Pulivarthi S, Gurram MK (2016) Magnetic resonance imaging of brain findings in hyperammonemic encephalopathy. J Neurosci Rural Pract 7(3): 469-471.
-
Trivedi SB, Vesoulis ZA, Rao R, Liao SM, Shimony JS, et al. (2017) A validated clinical MRI injury scoring system in neonatal hypoxic-ischemic encephalopathy. Pediatr Radiol 47(11): 1491-1499.
-
Betjemann JP, Lowenstein DH (2015) Status epilepticus in adults. The Lancet Neurology 14(6): 615-624.
- Ultrasound Guided Therapeutic Nerve Blocks
- Cyclops Lesion Without ACL Reconstruction: A Rare Case in a Patient with Intact Anterior Cruciate Ligament and Tibial Plateau Fracture
- Dosimetric Comparison between Two Dose Calculation Algorithms in SBRT Treatment of Lung Cancer in Ring-based and C-arm Radiation Therapy Equipment
- Adolescent Testicular Adrenal Rest Tumors: A Case Report and Review of the Literature
- Giant Intrathoracic Lipoma: A Rare Presentation
- Image of a Right Renal Angiomyolipoma Complicated by Hemorrhage