T2 Relaxation Time Mapping of the Lumbar Spine at 3T MRI-Different Protocols Comparison
Aim: Different pulse sequences in magnetic resonance imaging have been developed for the quantification of T2 relaxation time of tissues. Quantitative T2 relaxation time measurement is proposed to be valuable in detecting the early sign of disc degeneration. The purpose of this study was to evaluate the consistency of T2 relaxation time quantification in the spine tissues, including disc, bone and fat using different sequences and to assess the MultiTransmit technology effect on T2 quantification at 3.0T MR scanner. Materials and Methods: T2 relaxation times were first measured on eleven commercial phantoms with different T2 relaxation time in the range from around 50ms to 150 ms. Pulse sequences used for the measurement of the T2 relaxation time included with the traditional spin echo (SE), multi spin echo, turbo spin echo with various echo train length (ETL), gradient and spin echo (GRASE) sequences with single-slice on 3.0 T MR unit. Same series of pulse sequences were applied to lumbar spine of 15 healthy volunteers. T2 relaxation times of disc, vertebral body and fat were then measured. In addition, the B1 effect on T2 quantification was assessed by switching on or off the multi-transmitter (MT) of the MR scanner. Coefficients of variation (CV) of T2 from each sequence were calculated for reproducibility assessment. The differences between these T2 measurements from each sequence were statistically analysed using student’s t test. Results: A good reproducibility in all five phantoms was demonstrated by the CVs of T2 measurement which was lower than 4% for all sequences. The CVs is lower for MT switching on than those for MT switching off for all phantoms. The T2 relaxation times obtained from protocols with MT switching off were higher than those obtained from the same protocols with MT switching on in all phantoms and fat tissue except for the SE protocols in spine discs and marrows. There is significant difference (p<0.02) for all sequences in both phantoms and healthy volunteers obtained with MT switching on from with MT switching off. With MT switching off, the average T2 relaxation time was 127.26±18.94ms (ranging from 95ms to 170ms) in discs, 88.10±28.34ms (ranging from 41ms to 157ms) in vertebral bone and 132.97±46.69ms (ranging from 39ms to 194ms) in subcutaneous fat respectively. With MT switching on, the average T2 relaxation time was 121.22±15.27ms (ranging from 93ms to 159ms) in discs, 83.04±27.96ms (ranging from 41ms to 145ms) in vertebral bone and 126.09±49.19ms (ranging from 41ms to 196ms) in fat respectively. The times for fat and marrow varied more for both MT switching on and off. The SE sequence yielded the lowest T2 values for all in vivo tissues and phantoms, which was significantly lower than those obtained from other sequences (P<0.006). In TSE protocols, T2 relaxation time increases as ETL increases and there is significant difference (P<0.05) whatever MT switching on or off. T2 values from GRASE sequence were lower than those from TSE protocols but the difference were not significant (P>0.05). Conclusion: T2 mapping was viewed as one of the valuable methods for the diagnosis of intervertebral disc degeneration. There are different pulse sequences for the T2 relaxation time measurement. It is more appropriate to compare the trends of relaxation times rather than the actual relaxation time especially for comparing studies because many factors affect T2 values
Introduction
It is estimated that 60 to 90% of adult suffer from low back pain in industrialized countries [1, 2]. Structures such as vertebral body, intervertebral discs, muscles, ligaments, fascia and joints capsules could be the potential sources for pain development [3, 4, 5, 6]. However, intervertebral disc degeneration (IVDD) has been viewed as the leading cause of pain and disability in adults [7, 8, 9]. The relationship between the IVDD and low back pain has been studied [7, 10, 11]. IVDD is characterized by structural failures as well as biochemical changes such as significant decline in the disc’s proteoglycans (PGs) content [12]. Magnetic resonance imaging (MRI) has been widely used for characterizing IVDD. Pfirrmann et al. [13] proposed a semi-quantitative classification system for disc degeneration based on T2-weighted MR images which reflects the structural morphology in the vertebral bodies. While T2-weighted MRI provides valuable noninvasive morphological depiction of IVDD, it is not sensitive enough to detect early signs of disc degeneration occurring prior to morphologic changes. The structural morphology changes are resulted by the biochemical changes including proteoglycan loss, dehygration and collagen degradation. One of the most promising approaches for evaluation the underlying biochemical changes of the vertebral bodies is the construction of T2 relaxation time maps. In particular, T2 relaxation time are sensitive to the change of water and proteoglycan content caused by disc degeneration [14, 15, 16]. Because the biochemical changes are believed to occur early in the progression of disc degeneration, a method for creating T2 maps of intervertebral discs at clinically relevant field strengths could prove valuable. Therefore, quantitative T2 relaxation time measurement is proposed to detect the early sign of disc degeneration [17, 18]. Reproducible and accurate T2 relaxation time measurements are important for the characterization of disc degeneration.
Although recent studies have demonstrated a correlation between T2 values and degenerative disc [2,16,17,19), the T2 measurement may vary from sequence to sequence. In clinical practice, the variability of T2 relaxation time results in potential difficulties in diagnosis to discriminate between health and disease. It is therefore very critical to assess how the quantification of T2 relaxation time of spine tissues varies as different protocols and parameters are used and to individually establish T2 reference values for each sequence. The commonly used T2 relaxation time quantification sequences include spin echo (SE), fast or turbo spin echo (FSE or TSE) [20, 21], multi echo spin echo (MESE), and the gradient and spin-echo (GRASE) sequence [22, 23]. Studies have demonstrated that several factors can affect T2 relaxation time measurement including T1 saturation effects, imperfect RF pulses, static field inhomogeneity, stimulated echoes and insufficient sampling of the T2 decay points and so on [24]. Even the differences in T2 relaxation time quantification using difference sequences and parameters are known in the musculoskeletal knee [25, 26, 27], comparisons of T2 values based on different sequences in the spine are very limited. To best of our knowledge, no previous studies have systematically investigated measurement differences using sequences mentioned above in spine at 3T scanners. Moreover, with the development of MultiTransmit technology, it is assumed that the use of several transmitters as opposed to a single transmitter would improve RF excitation and reduce the artifacts introduced by imperfect RF pulses. Therefore, T2 relaxation time quantification protocols with MultiTransmit technology may provide a more accurate assessment of tissue relaxation properties.
The purpose of this study was: (1) to evaluate the consistency of T2 relaxation time quantification in the spine tissues, including disc, bone using different sequences at 3T including SE, TSE, and GRASE acquisition; (2) to evaluate the MultiTransmit technology effect on T2 relaxation time quantification and compare the results with the single transmitter technology.
Materials and Methods
Phantom Studies
Five commercial cylindrical T2 phantoms (Eurospin test object TO5, Diagnostic Sonar, Livingston, UK) with T1 relaxation time in the range of 300ms and 903ms and T2 relaxation time in the range of 70ms and 140ms respectively were chosen for the studies. The MR measurements were performed at temperature (20±2°C) with a MR compatible thermometer attached on the phantom holder. Phantom studies were performed at different date. The locations of the phantoms were rearranged at different positions related to the isocenter of the MR scanner for each scan. Each phantom was scanned at least three times for each pulse sequence to evaluate the reproducibility and measurement accuracy of pulses.
Subjects
15 healthy volunteers were recruited (ten men and 5 women; age range 20 to 35 years, median 27 years.) for the studies. All volunteers had no symptoms of inflammation, absence of any symptoms indicating disc degeneration, normal disc dimensions and functions proved by lumbar spine MRI and did not undergo surgery within one year of study enrolment. Volunteers with a pacemaker, metal implants, known or suspected pregnancy, and claustrophobia were excluded from the study. The study was approved by the institutional Clinical Research and Ethics Review Board and written informed consent were signed by all volunteers.
All studies were performed using a whole-body MRI system (Philips Achieva 3.0TX, Philips Healthcare, Best, The Netherlands) using 32 channel head coil for phantom studies and 15 channel spine coil for healthy volunteer studies respectively.
MRI protocols
Four different pulse sequences were applied on phantoms in axial plane and subjects in saggittal plane respectively. The four different pulse sequences are SE, TSE sequences with varying echo train lengths (ETLs=3, 4) and GRASE (EPI factor=5) respectively. Single slice images were acquired for all sequences in order to minimize the quantification inaccuracy caused by potential imperfect slice-selective refocusing pulses. Eight echoes were acquired for all sequences. The acquisition parameters for the pulse sequences are listed as in Tables 1 & 2 for phantoms and subjects respectively.
For phantom studies, relevant imaging parameters for all protocols include: FOV=210*210 mm; in-plane resolution=1.5*1.5mm, slice thickness=8mm, TR=3000ms, no of scan=1. For SE protocol, TE=20, 40, 60, 80, 100, 120, 140, 160 ms; total scan time was 7min3s. For TSE of ETL=3, TE=14, 34, 54, 74, 94, 114, 134, 154 ms; total scan time was 2min21s. For TSE of ETL=4, TE=15, 40, 65, 90, 115, 140, 165, 190 ms; total scan time was 1min48s. For GRASE, TE= 20, 40, 60, 80, 100, 120, 140, 160 ms; total scan time was 1min33s.
For subject studies, relevant imaging parameters for all protocols include: FOV=180*180mm; in-plane resolution=1.5*1.5mm; slice thickness=8mm, TR=2500ms, no of scan=2. For SE protocol, TE=20, 40, 60, 80, 100, 120, 140, 160 ms; total scan time was 6min35s. For TSE of ETL=3, TE=12, 32, 52, 72, 92, 112, 132, 152 ms; total scan time was 3min23s. For TSE of ETL=4, TE=16, 41, 61, 91, 116, 141, 166, 191 ms; total scan time was 2min33s. For GRASE, TE= 20, 40, 60, 80, 100, 120, 140, 160 ms; total scan time was 2min8s.
Image Processing
The images were transferred to the manufacture’s workstation and anlayzed using Philips dedicated software (MR Extended Work Space 2.6, Philips Healthcare, The Netherlands). A T2 map was automatically generated by fitting the signal intensity of all echo times to a monoexponential decay curve pixel by pixel with a maximum likelihood expectation maximization algorithm. T2 calculation of the TO5 object phantoms was performed in regions of interest (ROIs) placed centrally in each tube and excluded any artifacts. For in vivo study, circular regions of interest (ROIs) were drawn on the targeted anatomical tissues included: intervertebral discs, vertebral bodies (VB) and subcutaneous fat as shown in Figure 1. For the discs, the ROIs were drawn in the middle of the disc body-the nucleus pulposus. The vertebral body ROIs were drawn including all body range. Subcutaneous fat ROIs were drawn where the region was the largest. All ROIs were drawn with care to minimize the effects of chemical shifts, changes in susceptibility and interfaces between the tissue being measured and surrounding tissues in case of contaminations.

Figure 1: An example of ROIs selection in one subject displayed on sagittal T2-weighted image of the lumbar spine: with ROIs which are placed in spine disc, vertebral bone and subcutaneous fat. ROIs are taken in the central slice of the sagittal plane where the tissues are the largest. ROIs are manually drawn well within the boundaries of interested tissues to reduce the effects of environment on relaxation times.
Statistical Analysis
To assess the reproducibility of each sequence, the coefficient of variance (CV) was calculated across each phantom and each tissue using the formula as below:
For phantom, Mi is the T2 relaxation time of the with measurement for a particular phantom. For subjects, Mi is the T2 relaxation time of the with subject for a particular tissue.
As the sample size was not large, the non-parametric method of paired sample t-test was adopted to evaluate the differences between the sequences and the same sequence between MT switching on and off regarding the T2 relaxation times for statistical significance. All statistical analysis was performed using SPSS version 22.0 (Statistical Package for the Social Sciences, SPSS, IBM, USA) was considered statistically significant.
Results
Phantom Experiments
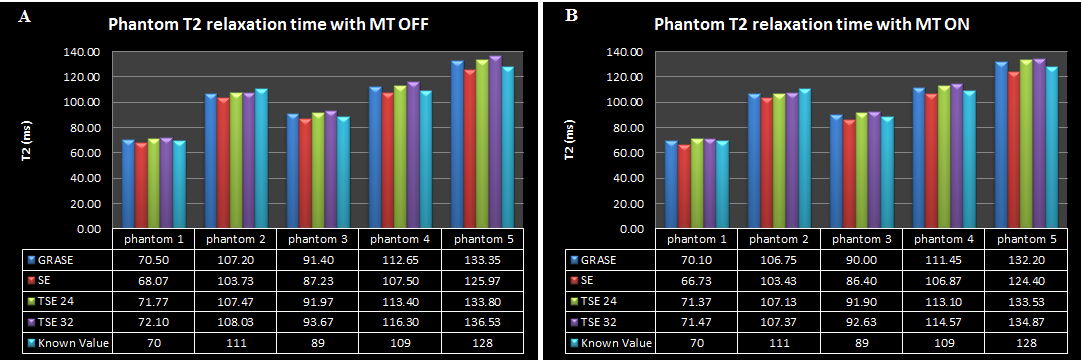
In Table 1, the CV values of T2 relaxation time was lower than 4% in all five phantoms for all pulse sequences, demonstrating a good reproducibility. After combining data from different phantoms, the average CV was higher for the same sequence with MT OFF compared with that with MT ON. The same situation happened after combining data from different pulse sequences. The average CV was higher for the same phantom with MT OFF compared with that with MT ON. Phantom 5 has the longest T1 (1007ms) and T2 relaxation time (128ms) in which the average CV was the highest for both MT OFF (2.8%) and MT ON (2.6%) after combining data from different pulse sequence. The highest average CV with MT OFF (2.8%) and MT ON (1.9%) was observed in TSE sequence with ETL=4 and the lowest CV with MT OFF (1.3%) and MT ON (1.2%) in SE sequence after combining all data from different phantoms.
The T2 relaxation time measured by difference sequences in all five phantoms was presented in Figure 2 with MT OFF and with MT ON respectively as compared with the T2 relaxation times provided by the manufacturer. There was significant difference for the same protocol performed with MT OFF compared that with MT ON as listed in Table 2. The T2 relaxation time obtained by SE sequence was the lowest. The average underestimate of the five phantoms was -2.86% (with MT OFF) and -3.78% (with MT ON) respectively. With TSE sequences, the T2 relaxation time increased with ETL increased, demonstrating a 2.25% (ETL=3) and 3.87% (ETL=4) average overestimate and 1.98% (ELT=3) and 2.74% (ETL=4) with MT OFF and ON respectively. The T2 relaxation time with GRASE showed relatively good accuracy with an average overestimate of 1.60% (with MT OFF) and 0.69% (with MT ON) respectively. With MT OFF, there was a significant difference (p=0.036) between TSE with ETL=3 (103.68 ms) and the TSE with ETL=4 (105.33 ms). There was also a significant difference between SE sequences (98.50 ms) and all other sequences (p<0.006). T2 relaxation time obtained from the GRASE sequence (103.02 ms) were also significantly lower (p<0.02) than those obtained from TSE with ETL=3 and 4. The same situation happened with MT ON. There was a significant difference (p<0.05) between TSE with ETL=3 (103.41 ms) and the TSE with ETL=4 (104.18 ms). There was also a significant difference between SE sequences (97.57 ms) and all other sequences (p<0.006). T2 relaxation time obtained from the GRASE sequence (102.10 ms) were also significantly lower (p<0.02) than those obtained from TSE with ETL=3 (103.41 ms) and 4 (104.18 ms). The pulse sequence with ETL=4 showed the worst accuracy (3.87%) with MT OFF. The T2 measurement of phantoms acted placement-independent within the magnet bore.
| SE | TSE 24 | TSE 32 | GRASE | Average | ||||||
|---|---|---|---|---|---|---|---|---|---|---|
| MT OFF | MT ON | MT OFF | MT ON | MT OFF | MT ON | MT OFF | MT ON | MT OFF | MT ON | |
| Phantom 1 | 1.5 | 0.9 | 1.7 | 1.2 | 2.6 | 1.3 | 2 | 0.7 | 2 | 1 |
| Phantom 2 | 0.7 | 0.8 | 1.2 | 1.3 | 2.1 | 1.3 | 1.3 | 1.5 | 1.3 | 1.2 |
| Phantom 3 | 1.1 | 1.2 | 3.2 | 1.1 | 3 | 2.1 | 1.4 | 1.2 | 2.2 | 1.4 |
| Phantom 4 | 1.5 | 1.2 | 2.1 | 1.9 | 3.2 | 2.4 | 2 | 1.9 | 2.2 | 1.9 |
| Phantom 5 | 1.9 | 2 | 3.4 | 3.4 | 3.3 | 2.4 | 2.5 | 2.6 | 2.8 | 2.6 |
| Average | 1.3 | 1.2 | 2.3 | 1.8 | 2.8 | 1.9 | 1.8 | 1.6 | ||
| In vivo | ||||||||||
| Spine discs | 9.9 | 13.1 | 13.6 | 14.5 | 13.8 | 14.7 | 15.7 | 10.9 | ||
| VB | 11.5 | 10.7 | 13.7 | 14.2 | 14.3 | 12.2 | 9.5 | 8.9 | ||
| Fat | 13.7 | 15.8 | 10.6 | 9.1 | 8.9 | 6.6 | 5.8 | 4.7 |
Table 1: Coefficient of variations in phantoms using different pulse sequences with at least 3 measurements (unit %).
| Average of T2 with MT OFF (ms) | Average of T2 with MT ON (ms) | p-Value | |
|---|---|---|---|
| SE | 98.50 (-2.86) | 97.57 (-3.78) | 0.015 |
| TSE 24 | 103.68 (2.25) | 103.41 (1.98) | 0.008 |
| TSE 32 | 105.33 (3.87) | 104.18 (2.74) | 0.008 |
| GRASE | 103.02 (1.60) | 102.10 (0.69) | 0.011 |
Table 2: T2 relaxation time measurement for each of the investigated sequences with MT OFF versus MT On for all five phantoms (me
In vivo Studies
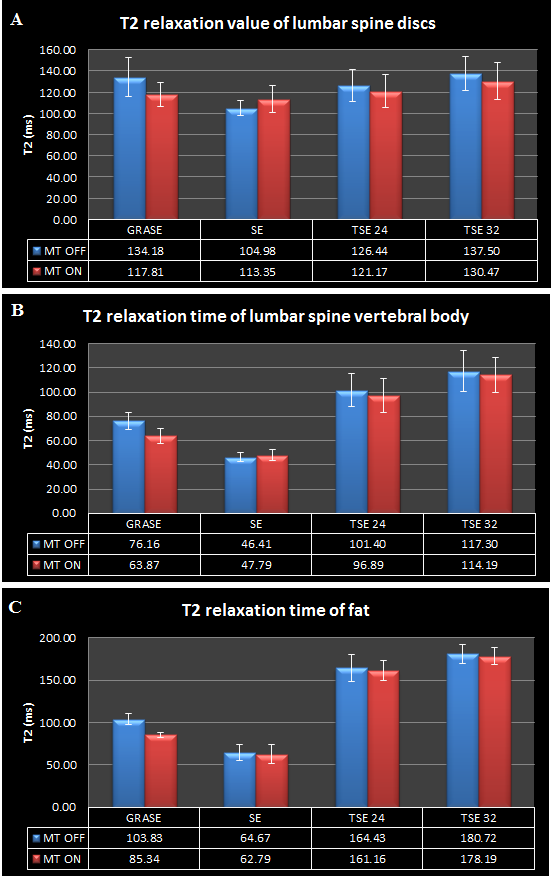
Data from human subjects are presented in Figure 3. The average T2 relaxation time of spine discs was 127.26 18.94 ms (with MT OFF) and 121.22 15.27 ms (with MT ON) from all volunteers and all pulses, ranging from 105 to 138ms with MT OFF and 113 to 131ms with MT ON respectively. The relaxation times for vertebral body and subcutaneous fat were more varying. For vertebral body, the average T2 relaxation time was 88.10 28.34 ms (with MT OFF) and 83.04 27.96 ms (with MT ON), ranging from 40ms to 150ms with MT OFF and 40 ms to 140ms with MT ON respectively. For subcutaneous fat, the average T2 relaxation time was 132.97 46.69 ms (with MT OFF) and 126.09 49.19 ms (with MT ON), ranging from 40ms to 190ms with both MT OFF and MT ON.
In spine discs, with MT OFF, There was a significant difference (p=1.73E-10) between the TSE with ETL=3 (126.44 15.20 ms) and the TSE with ETL=4 (137.50 15.99 ms). There was also a significant difference between SE sequences (104.98 7.24 ms) and all other sequences (p<3.00E-5). T2 relaxation time obtained from the GRASE sequence (134.18 18.19 ms) were also significantly lower (p=0.037) than those obtained from TSE with ETL= 4 but significantly higher (p=3.57E-4) than those obtained from TSE with ETL=3.
With MT ON, there was a significant difference (p=1.92E-7) between TSE with ETL=3 (121.17 15.35 ms) and the TSE with ETL=4 (130.47 17.12 ms). There was also a significant difference between SE sequences (113.35 12.52 ms) and all other sequences (p<0.03). T2 relaxation time obtained from the GRASE sequence (117.81 11.09 ms) were also significantly lower (p=6.37E-5) than those obtained from TSE with ETL=4 (130.47 17.12 ms). T2 relaxation time obtained from the GRASE sequence (117.81 11.09 ms) were also lower than those obtained from TSE with ETL=3 (121.17 15.35) ms but no significant difference (p>0.05). There was significant difference for the same protocol with spine discs of human subjects performed with MT OFF compared that with MT ON as listed in Table 3. For the intra-sequence comparison whatever for with MT OFF or MT ON, a similar trend of T2 relaxation time was detected in vertebral body and subcutaneous fat as in spine disc, there was significant difference between any two pulses (p<0.0002). However, for the inter-sequence comparison between with MT OFF and MT ON (the same sequence comparison between with MT OFF and MT ON), it was different shown in Tables 4 & 5 respectively. For SE protocol, there was no significant difference with MT OFF and MT ON for both VB and fat. For fat, there was only significant difference (p=2.63E-8) for GRASE protocol.
| Average of T2 with MT OFF (ms) | Average of T2 with MT ON (ms) | p-Value | |
|---|---|---|---|
| SE | 104.98 (7.24) | 113.35 (12.52) | 0.002 |
| TSE 24 | 126.44 (15.20) | 121.17 (15.35) | 0.012 |
| TSE 32 | 137.50 (15.99) | 130.47 (17.12) | 0.006 |
| GRASE | 134.18 (18.19) | 117.81 (11.09) | 2.07E-05 |
| SE | 46.41 (3.44) | 47.79 (4.62) | 0.098 |
| TSE 24 | 101.40 (13.69) | 96.89 (14.03) | 1.28E-04 |
| TSE 32 | 117.30 (17.03) | 114.19 (14.40) | 0.015 |
| GRASE | 76.16 (6.93) | 63.87 (5.98) | 4.56E-08 |
Table 3: T2 relaxation time measurement of spine discs for each of the investigated sequences with MT OFF versus MT On for all vo
| Average of T2 with MT OFF (ms) | Average of T2 with MT ON (ms) | p-Value | |
|---|---|---|---|
| SE | 64.67 (9.63) | 62.79 (10.86) | 0.3 |
| TSE 24 | 164.43 (15.61) | 161.16 (12.25) | 0.18 |
| TSE 32 | 180.72 (11.57) | 178.19 (10.45) | 0.26 |
| GRASE | 103.83 (6.39) | 85.34 (3.31) | 2.63E-08 |
Table 4: T2 relaxation time measurement of subcutaneous fat for each of the investigated sequences with MT OFF versus MT On for a
Discussion
Different pulse sequences used to measure the T2 relaxation time of phantoms and lumbar spine have been evaluated at 3T in this study. In addition to the phantoms with known relaxation times provided by the manufacturers, relaxation times of in vivo tissues including intervertebral discs, VB and fat have been measured. In order to minimize the effect of slice selective refocusing pulses, one slice was acquired in our study. TR was set long enough to reduce the error caused by T1 saturation effect. The number of echo times was large for reasonable decay. It was found that the T2 relaxation time was pulse sequence dependant for both phantoms and in vivo. The tendency of T2 variation among the pulse sequences was noted to be consistent across all tissues. SE appeared to underestimate the T2 relaxation times and presented the lowest values for both phantoms and in vivo. TSE and GRASE sequences have the potential to give higher T2 values. The T2 values are lower for almost all pulses across all tissues except for the SE in discs and VB with MT OFF versus these with MT ON. The maximum percentage error of our T2 measurement when compared with the known relaxation times provided by the manufacture of all phantoms for all sequences was below 7%. The manufacture reported around 3% error for the T2 values. All sequences performed a good measurement for the phantoms used in the study. The difference between our measurement and the value provided by the manufacture may caused by temperature variation. Among all phantoms, T2 values measured with MT OFF compared with MT ON demonstrated slightly higher accuracy which was demonstrated by the following two points: 1. the average percentage error with MT OFF was 3.42 % and which was 2.25% with MT ON; 2. the average CVs is higher with MT OFF compared with that with MT ON as illustrated in Table 1.
In our study, the relaxation times of VB and fat measured whatever with MT OFF or MT ON were corresponding to the values reported by other studies used SE protocols [28]. Only around 6% difference might be caused by single-slice acquisition used in our study.
There is one consistent trend that all pulses displayed an increase in T2 relaxation times of all tissues when compared with the SE sequence. Moreover, the T2 relaxation times increased as the ETL of the TSE sequence increases. The maximum percentage increase of 30.98%, 152.75% and 183.79% was inspected in spine discs, VB and fat respectively in our study compared with the value obtained with the SE sequence. The mean T2 relaxation time is significantly lower of SE than GRASE and all TSEs based on the Student’s t test. The T2 relaxation time is also significantly lower of TSE with 3 ETLs than TSE with 4 ETLs. The measured higher T2 relaxation times obtained with GRASE and TSEs are consistent with previous studies [25, 27, 29, 30]. The increased T2 relaxation time might be due to the contamination of stimulated echo generated in the mutliecho sequences [24, 31]. Multiple echoes may be used to enhance the SNR in an image by echo addition; however, the echo addition has the possibility of affecting the accuracy of T2 measurement by providing wrong prolonged decay information. The significant difference between the T2 relaxation time of SE for VB and fat compared to that using GRASE and TSEs might due to the T2 prolongation secondary to disruption of J-coupling interactions between adjacent fat protons [32]. All GRASE and TSEs pulse sequences with MT OFF yielded higher T2 relaxation time compared with these with MT ON across almost all tissues. The probable means that the incorrect refocusing pulse might be optimized by with MT ON.
Conclusion
In conclusion, T2 mapping has been claimed to be valuable in diagnosis of degenerative disease and evaluation of treatment outcomes. Difference pulse sequences using for T2 relaxation time measurement are inspected both in phantom and in human subjects in this study. The results show that different sequences produced different T2 values because several factors affect T2 measurement. To our knowledge, this is the first study to evaluate B1 inhomogeneity effects on T2 values using MT ON techniques. Robust T2 measurements are important. However, when choosing a sequence for T2 measurement, it is more essential to keep in mind from this study that it is more favourable to compare the trends of relaxation times rather than the actual relaxation times when performing studies for comparison.
References
-
Frymoyer JW, Cats-Baril WL (1991) An overview of the incidences and costs of low back pain. Orthop Clin North Am 22(2): 263-271.
-
Frymoyer JW (1988) Back pain and sciatica. N Engl J Med 318(5): 291-300.
-
Adams MA (2004) Biomechanics of back pain. Acupuncture in medicine: Journal of the British Medical Acupuncture Society 22(4): 178-188.
-
Bogduk N (1991) The lumbar disc and low back pain. Neurosurgery Clinics of North America 2(4): 791-806.
-
Bogduk N (1992) The causes of low back pain. Med J Aust 156(3): 151-153.
-
Hancock MJ, Maher CG, Latimer J, Spindler MF, McAuley JH, et al. (2007) Systematic review of tests to identify the disc, SIJ or facet joint as the source of low back pain. Eur Spine J 16(10): 1539-1550.
-
Luoma K, Riihimaki H, Luukkonen R, Raininko R, Viikari- Juntura E, et al. (2000) Low back pain in relation to lumbar disc degeneration. Spine 25(4): 487-492.
-
Pye SR, Reid DM, Smith R, Adams JE, Nelson K, et al. (2004) Radiographic features of lumbar disc degeneration and self-reported back pain. J Rheumatol 31(4): 753-758.
-
Errico TJ (2005) Lumbar disc arthroplasty. Clinical orthopaedics and related research. 2005(435): 106-117.
-
Peterson CK, Bolton JE, Wood AR (2000) A cross- sectional study correlating lumbar spine degeneration with disability and pain. Spine 25(2): 218-223.
-
Vanharanta H, Sachs BL, Spivey MA, Guyer RD, Hochschuler SH, et al. (1987) The relationship of pain provocation to lumbar disc deterioration as seen by CT/ discography. Spine 12(3): 295-298.
-
Cassinelli EH, Hall RA, Kang JD (2001) Biochemistry of intervertebral disc degeneration and the potential for gene therapy applications. Spine J 1(3): 205-214.
-
Pfirrmann CW, Metzdorf A, Zanetti M, Hodler J, Boos N (2001) Magnetic resonance classification of lumbar intervertebral disc degeneration. Spine 26(17): 1873- 1878.
-
Tertti M, Paajanen H, Laato M, Aho H, Komu M, et al. (1991) Disc degeneration in magnetic resonance imaging. A comparative biochemical, histologic, and radiologic study in cadaver spines. Spine 16(6): 629-634.
-
Antoniou J, Pike GB, Steffen T, Baramki H, Poole AR, et al. (1998) Quantitative magnetic resonance imaging in the assessment of degenerative disc disease. Magn Resonance 40(6): 900-907.
-
Benneker LM, Heini PF, Anderson SE, Alini M, Ito K (2005) Correlation of radiographic and MRI parameters to morphological and biochemical assessment of intervertebral disc degeneration. Eur Spine J 14(1):27- 35.
-
Watanabe A, Benneker LM, Boesch C, Watanabe T, Obata T, et al. (2007) Classification of intervertebral disk degeneration with axial T2 mapping. American Journal of Roentgenology 189(4): 936-942.
-
Blumenkrantz G, Zuo J, Li X, Kornak J, Link TM, et al. (2010) In vivo 3.0-tesla magnetic resonance T1rho and T2 relaxation mapping in subjects with intervertebral disc degeneration and clinical symptoms. Magn Reson Med 63(5): 1193-1200.
-
Hoppe S, Quirbach S, Mamisch TC, Krause FG, Werlen S, et al. (2012) Axial T2 mapping in intervertebral discs: a new technique for assessment of intervertebral disc degeneration. European radiology 22(9): 2013-2019.
-
Altbach MI, Outwater EK, Trouard TP, Elizabeth A Krupinski, Rebecca J Theilmann, et al. (2002) Radial fast spin-echo method for T2-weighted imaging and T2 mapping of the liver. Journal of Magnetic Resonance Imaging 16(2): 179-189.
-
Anderson SW, Sakai O, Soto JA, Jara H (2013) Improved T2 mapping accuracy with dual-echo turbo spin echo: effect of phase encoding profile orders. Magn Reson Med 69(1): 137-143.
-
Feinberg DA, Oshio K (1991) GRASE (gradient- and spin- echo) MR imaging: a new fast clinical imaging technique. Radiology 181(2): 597-602.
-
Oshio K, Feinberg DA (1991) GRASE (Gradient-and spin- echo) imaging: a novel fast MRI technique. Magn Reson Med 20(2): 344-349.
-
Poon CS, Henkelman RM (1992) Practical T2 quantitation for clinical applications. J Magn Reson Imaging 2(5): 541-553.
-
Maier CF, Tan SG, Hariharan H, Potter HG (2003) T2 quantitation of articular cartilage at 1.5 T. J Magn Reson Imaging 17(3): 358-364.
-
Quaia E, Toffanin R, Guglielmi G, Ukmar M, Rossi A, et al. (2008) Fast T2 mapping of the patellar articular cartilage with gradient and spin-echo magnetic resonance imaging at 1.5 T: validation and initial clinical experience in patients with osteoarthritis. Skeletal Radiol 37(6): 511-517.
-
Pai A, Li X, Majumdar S (2008) A comparative study at 3 T of sequence dependence of T2 quantitation in the knee. Magn Reson Imaging 26(9): 1215-1220.
-
de Bazelaire CM, Duhamel GD, Rofsky NM, Alsop DC (2004) MR imaging relaxation times of abdominal and pelvic tissues measured in vivo at 3.0 T: preliminary results. Radiology 230(3): 652-659.
-
Bartlett PA, Symms MR, Free SL, Duncan JS (2007) T2 relaxometry of the hippocampus at 3T. Am J Neuroradiol 28(6): 1095-1098.
-
Matzat SJ, McWalter EJ, Kogan F, Chen W, Gold GE (2015) T2 Relaxation time quantitation differs between pulse sequences in articular cartilage. J Magn Imaging 42(1): 105-113.
-
Hofstetter LW, Morrell G, Kaggie J, Kim D, Carlston K, et al. (2017) T2* Measurement bias due to concomitant gradient fields. Magn Reson Med 77(4): 1562-1572.
-
Stokes AM, Feng Y, Mitropoulos T, Warren WS (2013) Enhanced Refocusing of Fat Signals using Optimized Multi-pulse Echo Sequences. Magn Reson Med 69(4): 1044-1055.
- Ultrasound Guided Therapeutic Nerve Blocks
- Cyclops Lesion Without ACL Reconstruction: A Rare Case in a Patient with Intact Anterior Cruciate Ligament and Tibial Plateau Fracture
- Dosimetric Comparison between Two Dose Calculation Algorithms in SBRT Treatment of Lung Cancer in Ring-based and C-arm Radiation Therapy Equipment
- Adolescent Testicular Adrenal Rest Tumors: A Case Report and Review of the Literature
- Giant Intrathoracic Lipoma: A Rare Presentation
- Image of a Right Renal Angiomyolipoma Complicated by Hemorrhage