Dynamic and Parametric Whole-Body FDG PET/CT Imaging in Oncology: Is it Feasible in Routine Clinical Practice?
Dynamic PET can probe a number of functional and biological processes in both the early vascular distribution phase and the later metabolic phase of study. The recent advances in PET-CT hardware and software algorithms have simplified dynamic whole body PET/CT imaging. There is a huge potential of the kinetic parameters in its ability to differentiate benign from malignant lesions, in the staging and treatment monitoring of tumors suggesting that dynamic PET imaging may become an essential part in clinical molecular imaging. However, the complexity and time consuming nature of the reconstruction and tracer kinetic modeling techniques have restricted parametric imaging thus far to drug development and clinical research applications. While the initial reported pilot results have been promising, the data is still in its nascent stage with lack of guidance on the recommendations for its clinical use. Prospective studies are therefore required on individual cancers to see how dynamic whole body parametric PET imaging could be used beyond clinical research and integrated into clinical practice. With the gaining importance of radiogenomics, a potential clinical interest for parametric imaging could be to correlate the kinetic parameters with molecular profiling of a tumor lesion such as some key oncogene mutational status and predicting their response to specific targeted therapy. This review discusses the parametric imaging and its scope with the recent technological advancement and a review of the available literature on its clinical applications.
Introduction
Dynamic imaging is not new in nuclear medicine. Dynamic planar and single photon emission computed tomography (SPECT) studies, such as first pass cardiac studies, RBC labeled blood pool studies, dynamic bone scans etc are a routine in any nuclear medicine department, wherein multiple frames of images are acquired at short frame rates immediately after radiotracer injection, typically for 60 seconds to capture early perfusion information when the tracer is in the vascular and extravascular blood pool compartments [1, 2, 3].
Recent advances in PET imaging have made dynamic whole body acquisition a reality. The advanced detectors in the recent Digital PET CT scanners, capable of measuring time-of–flight of each annihilated photons and subsequent high spatial and temporal resolution as well as the software algorithms have simplified dynamic whole body PET/CT (DWB-PET/CT) imaging. The standard whole-body PET/ CT imaging involves a single static whole body acquisition after a specified time delay of 60 minutes of intravenous administration of 18F-FDG. The standard semi quantitative parameter “Standardized Uptake Value (SUV)” used routinely represents the amount of radioactivity accumulated in the lesion per gram of tissue. It is normalized to the administered dose of radioactivity and the body weight of the patient to obtain mean or maximum SUV (SUVmean and SUVmax) within a defined volume-of-interest. While the SUV is a well established metric for 18F-FDG and various other PET tracers, used widely in clinical oncology as well as for research and trials, it is not a reliable quantitative index as it is influenced by several factors such as post injection scan times, plasma glucose levels, renal blood parameters, partial volume effects, physical and biological processes such as patient’s body weight and metabolic state and inaccurate SUV corrections [4, 5]. The ability to obtain more robust quantitative information than SUV has therefore been an area of ongoing work so far. In this regards, kinetic parameters obtained from dynamic PET studies help in imaging the ongoing metabolic processes within the target tissue over a period of time from the time of tracer injection [6]. Dynamic 18F-FDG-PET reflects both the early vascular distribution phase and the later metabolic phase and helps identify the alterations occurring at microscale level before they become evident in the conventional PET imaging [7]. The prolonged acquisition times have however been found challenging and impractical in routine clinical practice [8], particularly for very ill and elderly patients and has therefore been confined to only research and scientific purposes until now. The capability of continuous bed motion in the digital PET CT scanners equipped with flowmotion multiparametric suite and large field of view platforms allows acquisition of whole body dynamic imaging more convenient [9, 10]. This has therefore rekindled the interest to incorporate it into clinical setting which allows multiple passes of the whole body and automatically creates 4 dimension reconstruction of images. The kinetic information is obtained by generation of the dynamic time–activity curves at individual voxel-level in dynamic images to create parametric images along with the conventional ‘SUV-equivalent’ image wherein arterial blood samplings are no longer necessary [11, 12].
Concept of Parametric Imaging
Radiotracer biodistribution is a dynamic process with substantial variation seen between normal organs and disease sites such as tumors, infection etc. The concentration of tracer activity in both the blood plasma and the tissue are measured over time to estimate tracer metabolic rate. This dynamic uptake process which includes multiple succeeding miniprocesses remains uncaptured in a conventional PET/ CT study acquired after 60 minutes of 18F-FDG injection. Parametric imaging is therefore a compartmental analysis [13] that processes the sequential dynamic data to estimate the spatial distribution of the kinetic parameters of radiotracer flow in two or three compartment models using individual arterial input functions (AIFs). With the current generation scanners, the AIF is obtained non-invasively as an image derived input function by linear interpolation between the measured values of the 18F-FDG time activity curve (TAC) from the left ventricular blood pool or from a large arterial vessel like the descending aorta [14, 15].
Several studies have validated the noninvasive image- derived input functions [16], although arterial blood sampling is considered as gold standard for absolute PET quantification.
The two tissue compartment model is the standard method in dynamic imaging assuming that the tissue is combined of two homogenous mixed interacting compartments [13]. Whole body parametric images are derived mathematically by applying linear regression methods to the Patlak equation. On the recent Siemens Biograph Vision digital PET CT, an entire image sequence representing parameters such as perfusion, transport or phosphorylation as in the case of FDG is displayed as a single composite image [17]. The quantitative parametric data therefore generates three distinct images (Figures 1a, b, c) of “conventional SUV” by summation of dynamic frames and Patlak using regression-based calculation, which results in “slope or ki” and “Intercept” images [17]. The standard Patlak model [18] assumes an irreversible 2-compartment kinetic model to estimate the tracer flow rate parameters between the plasma compartment and the tissue compartments. The tissue compartment involves a “transfer compartment”, where FDG is intracellular but reversible with the plasma compartment and a “metabolic compartment” where FDG is in irreversible FDG-6-phosphate form. The rate constants K1 – k4 are generated by making use of AIF and tissue TAC from 0 to 60 minutes [18, 19], assuming that k4=0. The linear regression diagram is used to generate ki or slope representing influx metabolic glucose rate, which is calculated as per the equation ki= K1 x k3/ (k2k3) where the rate constants K1, k2, k3 and k4 represent the course of 18F – FDG forward transport, reverse transport, phosphorylation and dephosphorylation respectively. K1 and k2 refers to the forward and reverse transport of tracer across the membrane, whereas k3 and k4 refer to the metabolism and reverse metabolism of the entering tracer respectively i.e. phosphorylation and dephosphorylation for 18F-FDG (Figure 2). The Patlak intercept represents the distribution volume (DV) which equals V0 + Vp where V0 is the initial or exchangeable volume of distribution for the reversible tissue compartments i.e. unmetabolized or unphosphorylated FDG in tissue and Vp is the fractional blood volume present in the ROI or voxel of interest. The uptake of other non 18F-FDG PET radiopharmaceuticals may demonstrate a set of reaction pathways with corresponding rate and reverse rate coefficients, that differ according to the dominant metabolic alteration in the target tissue. The concept therefore of kinetic analysis of PET imaging depends on the fact that the target tissue consists of multiple, homogeneous mixed compartments, with the resulting rate constants representing the interactions that occur between these compartments including the simple transport and the chemical reforming [7, 20].
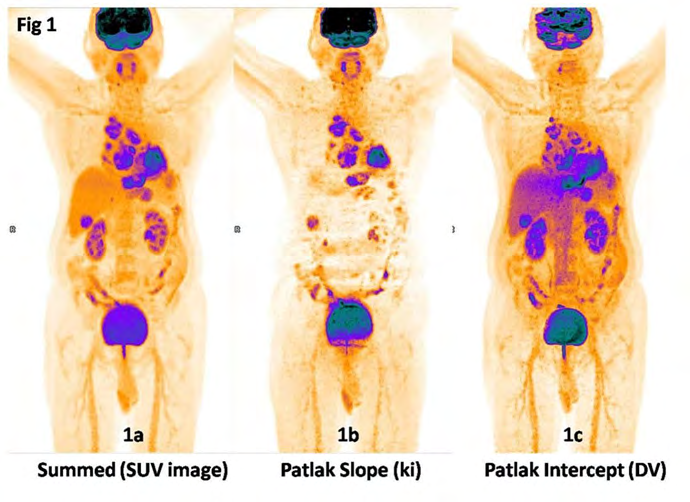
Figure 1: The quantitative parametric data obtained on Siemens Biograph Vision digital PET CT using flowmotion multiparametric PET generates three distinct images: a) Parametric images of “conventional SUV” generated by summation of the dynamic images from whole-body passes 14- 19 corresponding to 60-90 minutes post-injection. The SUV image represents the conventional 60 minutes whole body image by summation of the last few dynamic frames representing the amount of metabolized and unmetabolized tracer in the tissue at a certain point of time. This image is used for the routine clinical interpretation of findings. b) Patlak slope (ki) image: Patlak plot uses linear regression analysis to generate “slope” image representing ki or influx metabolic glucose rate which is calculated as per the equation ki= K1xk3/(k2+k3). Patlak image reconstructions are done from the second acquisition phase of whole body passes after an initial lag of 10 minutes for a total of 60 minutes duration. The ki image shows reduced normal organ uptake, particularly in the liver and represents the metabolized tracer distribution wherein each voxel represents the rate of metabolized FDG in a volume of tissue in mg/min/100 ml. The different kinetics between normal liver tissue and malignant lesions results in an increased contrast in the ki images as compared to the SUV images. In this diagnosed case of left lung carcinoma with mediastinal nodal metastasis and liver metastasis, the ki image clearly delineates all the malignant lesions due to low background activity and low noise levels. c) Patlak “Intercept” image: represents Distribution Volume (DV) of the radiotracer 18F-FDG. DV is the total blood plasma distribution volume, i.e. the sum of the distribution volume of the reversible compartment and the fractional blood plasma volume present in the tissue. In other words it represents the unmetabolized tracer in tissue that is expressed as percentage. DV is an estimate for the vascularity and interstitial fluid components of the tissue. The images are suggestive of increased vascularity in the primary left lung lesion as well as in the metastatic mediastinal nodal and liver lesions. (Image Courtsey: Department of Nuclear Medicine, Apollo Proton Cancer Centre, Chennai, India).
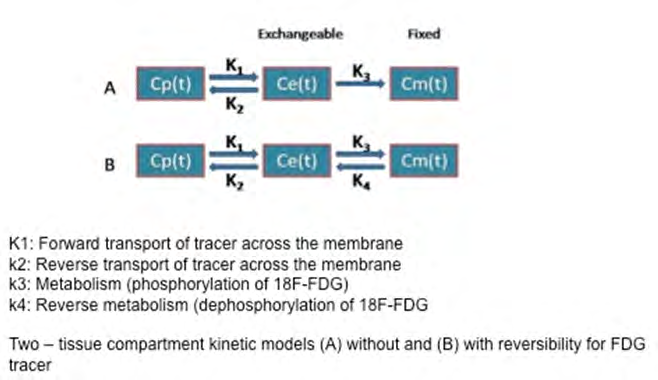
Figure 2: Two compartmental kinetic model for 18F-FDG estimating the tracer flow rate parameters between the blood-pool/ plasma compartment and the tissue compartments. The tissue compartments are a transfer/ exchangeable compartment, where FDG is intracellular and reversible and a metabolic compartment where FDG is in irreversible FDG-6-phosphate form.
The rate constants K1–k4 describe the influx and efflux of FDG between the compartments. K1 and k2 represent carrier-mediated forward transport of FDG from plasma to tissue (K1) and back i.e. reverse transport from tissue to plasma (k2) in the transfer compartment. k3 represents the rate constant for phosphorylation of FDG by the hexokinase enzyme in the metabolic compartment and K4 refers to the reverse metabolism or dephosphorylation of FDG.
Cp(t) is the plasma 18F-FDG concentration change with time, Ce(t) is the change of time of 18F-FDG in the intracellular exchangeable compartment of the tissue and Cm(t) is the tissue 18F-FDG concentration with time i.e. in the metabolic compartment where FDG is in irreversible FDG-6-phosphate form.
Procedure
Dynamic PET protocols have in the past been confined to single-bed-coverage limiting the axial field-of-view to ~15-20 cm, that has in the recent period transitioned to dynamic whole-body PET imaging using multi-bed dynamic PET acquisition protocols and parametric imaging methods [14, 16, 21]. The protocol typically includes an initial 6 min dynamic PET scan over the heart, followed by a sequence of multiple passes over multiple bed positions for instance five to six passes over seven to eight bed positions, each scanned for regular time intervals such as 45s.
With the recent digital PET CT scanners, the protocols have further evolved and refined to acquire multiple passes of the whole body for 60 minutes (Figure 3). A whole body CT scan is initially acquired before 18F-FDG injection for attenuation correction and diagnostic purpose. Then 18F-FDG dose is administered as an intravenous bolus, defining this time point as time 0. Immediately thereafter, DWB-PET/CT is acquired in two phases. The most recent digital Siemens Biograph Vision TOF PET CT scanner equipped with flowmotion capabilities has a fully automated acquisition protocol of acquiring the initial acquisition phase including a single bed position for 6 minutes of 3 dimensional (3D) list mode with the heart in the centre of field of view to track the rapid kinetics of the AIF. The second phase begins after a 4 minute pause at the end of the initial input acquisition and consists of 15 whole body passes. The first 5 passes are of 2 minutes duration per pass and the subsequent 6 to 15 passes are of 5 minutes duration per pass, with a total duration of 60 minutes acquisition. The whole body passes can have upto 4 variable bed speed regions, upto 25 passes for image based modeling and upto 6 contiguous passes for Patlak reconstruction.
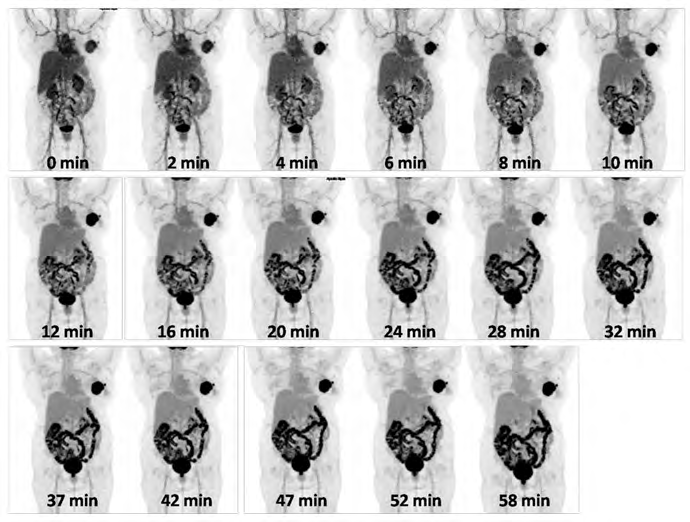
Figure 3: Dynamic images acquired as multiple passes of the whole body for 60 minutes soon after intravenous administration of 18F-FDG. The first 5 passes are of 2 minutes duration per pass and the subsequent 6 to 15 passes are of 5 minutes duration per pass, with a total duration of 60 minutes acquisition. (Image Courtesy: Department of Nuclear Medicine, Apollo Proton Cancer Centre, Chennai, India).
Data Analysis
Image Reconstruction
Standard list-mode acquisitions are histogrammed with specified time frames for the initial arterial input phase and the subsequent multipass data that are limited to approximately equal time frames over the course of the acquisition. The last few whole body passes are summed to generate the SUV similar to the conventional PET imaging acquired at 60 minutes post injection. The data are reconstructed using point spread function and time-of-flight algorithms (UltraHD PET; Siemens Medical Solutions USA Inc., Malvern, Pennsylvania, USA) applying Gaussian filter into a 200×200 image matrix (4.07 mm voxel size) and 5 mm slice thickness. CT-based scatter and attenuation correction is also performed with CT data reconstructed into a 512×512 image matrix with 5 mm axial slices. The summed and patlak image data are reconstructed to 440 x 440 image matrix size.
Arterial Input Function
This measurement is an essential part of the kinetic analysis. The left ventricular (LV) pool being the largest blood pool is chosen with minimized partial volume effects. Region of interest (ROI) is drawn over the left ventricular cavity (LV) avoiding any overlap with the myocardium in all dynamic cardiac frames to extract the input function measurements by applying linear interpolation on the first 24 extracted LV ROI mean values to generate time activity curves. On the SyngoVia platform, AIF is obtained automatically by measuring the uptake in the region of interest located in the left ventricle or aorta (Figure 4). This method is reasonably accurate and obviates the need for serial arterial blood sampling that may be technically challenging for patients.
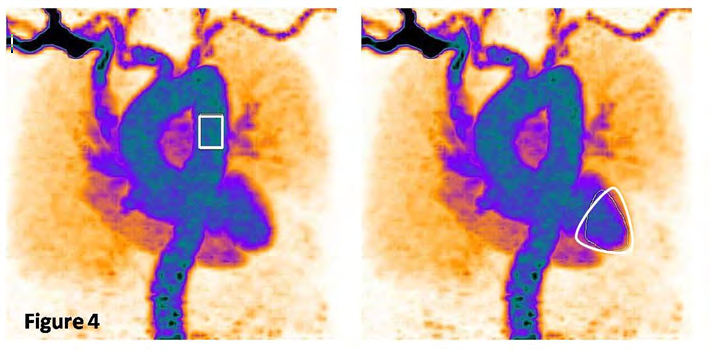
Figure 4: “Arterial input function” derived from the initial single-bed list-mode acquisition over the heart by measuring the uptake in the region of interest located in the left ventricle. The input function is measured by applying linear interpolation on the initial extracted LV ROI mean values to generate time activity curves. (Image Courtesy: Department of Nuclear Medicine, Apollo Proton Cancer Centre, Chennai, India. Images obtained on Siemens Biograph Vision digital PET CT using flowmotion multiparametric suite).
Image output and Interpretation
On the SyngoVia platform, the following image outputs are generated: a) SUV image represents the conventional 60 minutes whole body image by summation of the last few dynamic frames representing the amount of metabolized and unmetabolized tracer in the tissue at a certain point of time (Figure 1a). This image is used for the routine clinical interpretation of findings. b) The Patlak plot is given by the expression: Where CT(t) is the tissue 18F-FDG concentration change with time, Cp(t) is the plasma 18F-FDG concentration change with time, V(b) is the intercept of regression comprised of the effective plasma volume and the distribution of volume of reversible compartments and ki is the slope of linear regression that equals the tissue 18F-FDG influx rate constant. Therefore ki measures the changes of tissue concentration normalized with respect to the time course of plasma 18F-FDG. Patlak slope or Influx rate constant ki is represented as ki represents the metabolized tracer distribution wherein each voxel represents the rate of metabolized FDG in a volume of tissue in mg/min/100 ml (Figure 1b). c) Patlak Intercept or Distribution Volume (DV): represents V0 + Vb i.e. the fractional blood volume in the tissue (Vb) and the normalized tracer concentration from reversible compartments (V0). In other words it represents the unmetabolized tracer in tissue that is expressed as percentage. This parameter represents the vascularity of a lesion and is usually compared with the liver as a reference value. For example, DV of 200% in a lesion suggests twice as high vascularity than the normal liver when liver DV is 100% (Figure 1c).
Clinical Applications
DWB-PET/CT with parametric images are helpful to study the kinetic parameters of tumours as well as infection or inflammatory lesions. In theory, there is a huge potential of kinetic parameters in the diagnosis, staging, treatment planning, treatment monitoring and followup of tumors. It’s predominant potential may be the ability to differentiate benign from less aggressive tumours and delineation of small lesions with high contrast, that may not be clearly visualized in conventional images because of the high FDG uptake in the surrounding tissue or a high fractional blood volume in the target area. It also helps in delineating non FDG avid metastatic lesions (such as in the post chemotherapy setting or necrotic lesions) as well as in monitoring small therapeutic effects early after the onset of chemotherapy [22, 23, 24, 25, 26]. These promising results indicate that the kinetic analysis of PET imaging may become an essential part in the preclinical and clinical molecular imaging.
In the past few years, there have been numerous publications on kinetic analysis of dynamic PET imaging in various malignant lesions using both 18F-FDG and non FDG radiotracers showing promising value in tumor diagnosis and monitoring specific therapeutic effects.
Intracranial Tumours
The value of conventional SUV and SUV-to-background ratio (SUR) for grading of glioma remains controversial.
Spence et al. were the first to point out the importance of kinetic analysis in brain tumours using a 2-compartment model [27]. Considering the shortcomings of 18F-FDG-PET in brain tumors, various other tracers especially amino acid PET tracers such as 11C-methionine, 18F-fluoro-ethyl-tyrosine (FET) and fluorine-18-dihydroxyphenylalanine (18F-DOPA) have been clinically used in brain tumors [28, 29, 30, 31, 32]. Once they enter the tumor cell, the amino acids get involved in protein synthesis through multiple anabolic and catabolic processes, with transport kinetics being the main event to affect PET signal [33]. Most studies have shown elevated transport and net influx in high grade tumours compared to lower grade tumors. 18F-FDOPA PET has been shown superior to 18F-FDG-PET in imaging of low-grade tumors and recurrent tumors [31, 34]. Few reports on detailed compartment model analysis of 18F-FET PET have revealed the value of kinetic modeling in grading and prognostication of both low and high grade gliomas as well as recurrent high grade gliomas [35, 36] potentiating its high diagnostic value in the histological glioma diagnosis.
In a retrospective study including thirty-four consecutive patients with untreated, first-diagnosed, histologically proven glioma, 40 minutes dynamic 18F-FET PET kinetic data showed that the time to peak (TTP) parameter was highly prognostic for recurrent disease with a strong correlation between dynamic TTP and progression-free survival (hazard ratio, 6.050; 95% CI, 2.11–17.37; P < .001). Interestingly, the TTP also proved significant in the subgroup of low-grade glioma (hazard ratio, 5.347; 95% CI, 1.05–27.20; P = .044), in comparison to the established static imaging parameters, such as maximum tumor-to-background ratio and mean tumor-to-background ratio. In the high-grade glioma subgroup, however, the authors found that both dynamic and static parameters correlated with progression-free survival [37]. In another study using the same PET tracer, it was found that the differences in “Time to peak (TTP)” between GBMs and grade II/III gliomas were greater when the molecular profile of the tumours were included. TTP was shorter in histologically diagnosed GBM than in low-grade glioma and significantly shorter in methylation-based GBM than in IDH-mutant glioma. The two-tissue compartment kinetic modelling revealed higher relative K1 values in GBM than in gliomas of lower grade following both histological and methylation-based diagnosis. IDH-mutant gliomas and GBM subgroups tended to differ in their 18F-FET PET kinetics suggesting that dynamic 18F-FET PET was useful and could play a crucial role in the noninvasive biological characterization of GBM [38].
In another study including 16 patients with recurrent high grade glioma, 40 minutes dynamic 18F-FET PET found that the parameter VB representing relative volume of blood in the tumour provides a diagnostic value for tumor grading, with an overall VB 7.5 ml/100 ml for grade III tumors and 11.6 ml/100 ml for grade IV tumors (p = 0.02518 after multiple-testing correction). The authors believe that as these tumors may develop after long-latency period from lower-grade glioma and are often not biopsied, prediction of tumor grade in recurrent glioma by imaging could have a clinical impact [39]. The voxel wise tracer kinetic analysis also holds promise of unraveling tumor sub-volumes of different metabolic activity, which is especially relevant in high-grade glioma due to their infiltrative and heterogeneous nature [36].
Similar kinetic parameters have been investigated in histologically confirmed primary central nervous system (CNS) lymphomas. Kawai and Nishiyama et al found a significant increase of 18F-FDG phosphorylation in tumor tissue leading to higher tumoral uptake with no significant discrepancy in transport rate than normal cortex in control patients [39, 40].
Solitary Pulmonary Nodules (SPN)
SPNs are a common clinical problem with histologies varying from benign tumors, infectious lesions to lung cancer. The prevalence of lung cancer in SPNs is high, and the early identification of malignant nodules can help improve the chance of successful treatment.
The value of 18F-FDG PET/CT in the diagnosis of SPN has been widely recognized, with sensitivity and specificity ranging between 82% to 96.8% and 71% to 77.8%, respectively [41, 42, 43]. Increased 18F- FDG uptake has been reported in active granulomatous diseases (tuberculosis, sarcoidosis etc), fungal infections (aspergillosis, histoplasmosis etc) and other non-infectious diseases that can be indistinguishable from lung cancer [44, 45]. Dynamic 18F- FDG PET imaging with kinetic modeling has shown promising results in characterization and differentiation of malignant lung nodules from granulomas.
Yu-Erh Huang et al showed significantly lower time activity curve (TAC) slope and ki values in granulomas as compared to malignant nodules, though their SUV values were not significantly different from malignant nodules. The ki and metabolic rates of glucose (MRGlu) values in malignant SPNs were significantly higher than those of benign SPNs with a ki cut-off = 0.025/min (85% sensitivity and 85% specificity) for diagnosing malignant pulmonary lesions. The authors found that malignant SPNs had a continuously rising slope, and nongranulomatous benign SPNs had a flat slope during the late phase of the TAC. The TAC patterns of malignant SPNs and granulomas were however found to be similar, although the ki and TAC slope had significant differences between the two conditions [46]. While the sensitivity of dynamic imaging in this study was not so high at 79%, the ki and MRGlu data together was found to show higher specificity (90%), and hence these parameters may help to address the high number of false positives that occur in areas with a high prevalence of granulomatous disease [46].
In another study by Wang, et al. [47], the TAC in 15 of 21 patients with malignant pulmonary lesions demonstrated gradual increases in 18F-FDG uptake until 60 min, whereas benign lesions exhibited gradual decreases over 60 min. Though the maximal lesion diameter was not significantly different between both groups (p>0.05), malignant pulmonary lesions demonstrated significantly higher ki values (p < 0.05) and SUVmax (p < 0.05) than benign lesions, showing a significant correlation between ki and SUVmax (r = 0.815, p < 0.001).
Lung Cancer
Tsuchida, et al. described the importance of parametric PET in it’s ability to differentiate the histological subtypes of lung cancer in 44 patients including squamous cell carcinoma (SCC), well-differentiated adenocarcinoma and poorly/moderately differentiated adenocarcinoma. They demonstrated that both rate constants K1 and k3 differ significantly among the 3 groups, with highest values observed in SCC and lowest in well-differentiated adenocarcinoma. This was attributed to the differences in glucose transporter concentration and hexokinase activity between the tumour types [48]. Figures 5a, b, c & d shows the ability of kinetic parameters to differentiate neoplastic lesions with high malignant potential from those of lower malignant potential.
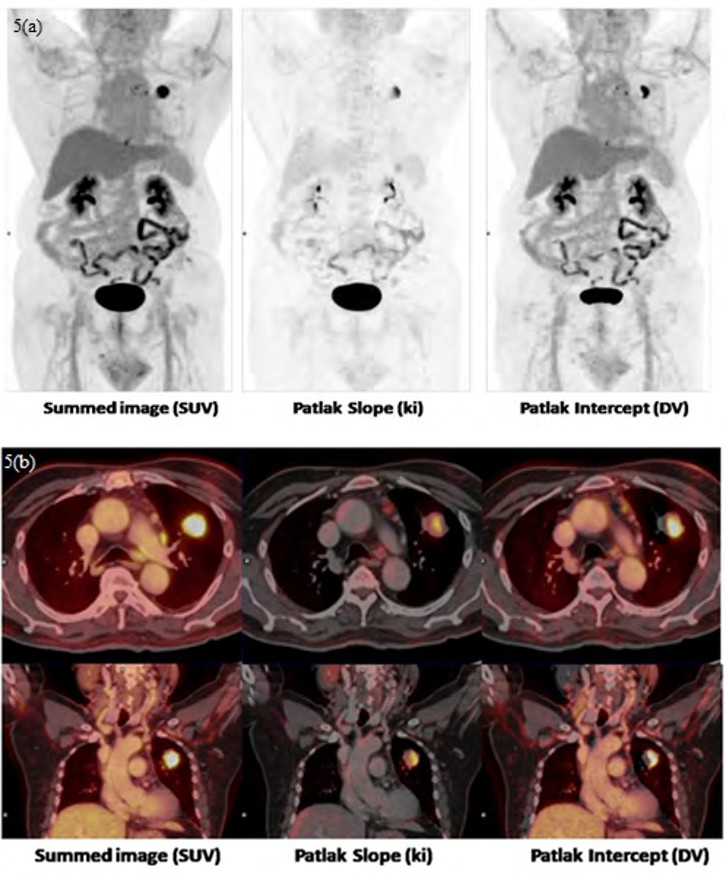
Figure 5 (a & b): 71 year gentleman was evaluated for left lung upper lobe mass. DWB images showed a focal FDG avid soft tissue density lesion in the anterior segment of left upper lobe with spiculated margins showing SUVmax: 7.8 suspicious for malignancy. Parametric images showed Ki of 4.36 and DV of 330.6 % indicating a moderately high metabolic rate of glucose and significantly high vascularity. There were low grade FDG avid mediastinal and left hilar lymph nodes, with the most avid prevascular node showing SUVmax: 4.25, ki of 1.64 and DV of 187.55% indicating lower rate of glucose metabolism and vascularity as compared to the primary lesion. Lesion was surgically removed and confirmed as pT2N2 moderately differentiated adenosquamous carcinoma.
(c & d): DWB and parametric images in a 31 year old gentleman with a well defined low grade FDG uptake endobrochial lesion in the right main bronchus showing SUVmax: 5.19, ki of 2.81 and DV of 163.3% suggestive of low metabolic glucose rate and vascularity. Final histopathology was a low grade mucoepidermoid carcinoma. (Image Courtesy: Department of Nuclear Medicine, Apollo Proton Cancer Centre, Chennai, India).
Kinetic analysis using various PET tracers such as 18F-fluoromisonidazole (FMISO) and 18F-Flourothymidine (FLT) have been performed to assess tissue hypoxia and tissue proliferation of lung tumours. Muzi, et al. studied the kinetics of FLT-PET using two compartmental model with blood sampling in seventeen patients and showed that FLT flux retrieved from the kinetic analysis correlated with in vitro measures of tumour proliferation done after surgical resection of tumours [49]. Daniel R. McGowan et al. investigated the PET-imaged time-courses of 18F- MISO in non-small cell lung cancers (NSCLC) and revealed that the dynamic PET kinetics were best described by an irreversible three-tissue compartment model [50]. The K1 values obtained from fits of the irreversible three-tissue model correlated strongly with independent blood flow measurements obtained from perfusion CT (r = 0.81). There have also been controversial findings published that dynamic 18F-FDG PET does not have an added value over static PET for tumor delineation of NSCLC by using pathology volume as the reference standard [51].
The clinical benefit of the parametric PET was also demonstrated in the therapy of lung cancer. Van Der Veldt et al revealed that the kinetics of radiolabelled chemotherapy lead to a more accurate assessment of molecular distribution of the same within the tumour tissue. The kinetic modeling of 11C labeled docetaxel was studied in 34 patients of lung cancer in 2011 and found that the heterogeneity of 11C-docetaxel kinetics in the tumours may be related to the difference of sensitivity to docetaxel. Tumours with a high influx value had a significantly better response than tumours with a lower influx value. They further revealed that pretherapy use of dexamethasone had a significant effect on the kinetic model of docetaxel [52].
Breast Cancer
The role of dynamic PET imaging is under debate in breast cancer. Amongst the available literature, a study by Kornélia Kajáry, et al. on the clinicopathological correlation of dynamic PET in the initial staging of primary breast cancer seems to be robust [53]. In this study, the kinetic parameters (i.e. K1, k2, k3 and ki) of dynamic PET were correlated with clinical TNM, histological tumor type, tumor grade, proliferation rate and receptor status during the initial clinical staging to characterize breast cancer in 35 lesions. Though the authors did not find any correlation between lesion size and the kinetic parameters, every measured kinetic parameter was found to be significantly higher in axillary lymph node positive status (>cN0) compared to clinically node-negative (cN0) cases with p = 0.0315. A more significant relationship was seen with ki i.e. tumors with higher nuclear grade and lesions with high ki-67 showed significantly higher k3 (p = 0.0246), ki (p = 0.0089) and metabolic rate of FDG (p = 0.0076) as compared to low grade and low ki-67 lesions. The study also showed significantly higher ki (p = 0.0300 and p = 0.0217, respectively) and metabolic rate of FDG (p = 0.0247 and p = 0.0132, respectively) in ER/PR-negative than in ER/PR-positive lesions suggesting different FDG- kinetic parameters in hormone receptor negative tumors compared to hormone receptor positive lesions. However, no significant correlation was found between HER2 positivity and the investigated kinetic parameters of the dynamic studies. In the group of triple negative breast cancer (TNBC) and hormone receptor negative/HER2 positive subtypes, the study showed significantly higher values of k3, ki and metabolic rate of FDG in comparison to hormone- receptor positive breast cancers (i.e. HR+/HER2+ and HR+/ HER2- tumors). The authors summarized that the kinetic parameters i.e. k3, ki and metabolic rate of FDG were strongly associated with the biological behavior of the tumors with high-grade, hormone-receptor negative tumors with high proliferation rate characterized by higher cellular FDG uptake and phosphorylation rate based on dynamic imaging underlining the additional aggressive biological behavior of TNBC and HR-/HER2+ subtypes [53].
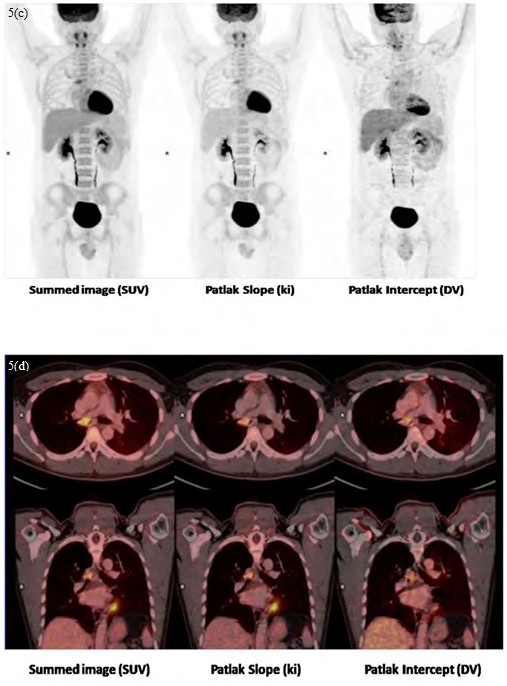
Similar observations have been published earlier by Dunnwald, et al. [54] wherein tumors that were hormone receptor negative, high grade, highly proliferative or of ductal histology had higher FDG ki and SUV values (Figures 6 and 7). The authors also concluded that the kinetic measures of FDG PET in locally advanced breast cancer patients treated with neoadjuvant chemotherapy accurately measured treatment response and were more robust in predicting outcome compared with static SUV measures (AUC of kinetic parameters = 0.97 and AUC of SUVmetric = 0.84, P = 0.005). Changes in K1 and ki predicted both disease free and overall survival, whereas changes in SUV predicted overall survival only.
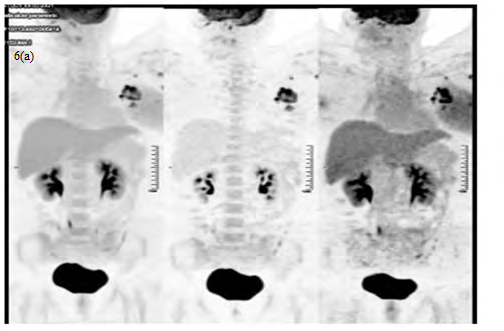
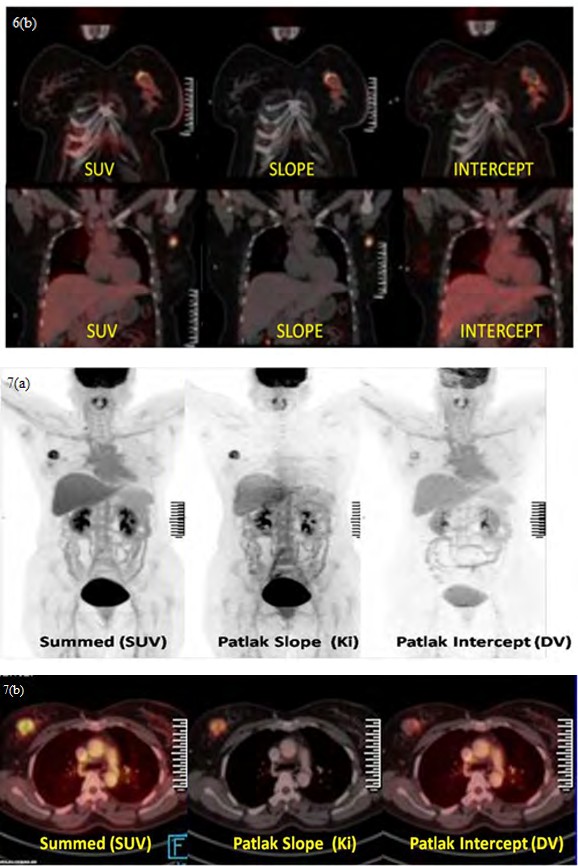
Figure 6 (a & b): 32 year female with left breast carcinoma (Invasive ductal carcinoma, grade I with ER and PR negative and Her 2 Neu positive) in the upper inner quadrant of the left breast showing circumferential rim of increased FDG uptake (SUVmax:15.5) and FDG avid left axillary lymphadenopathy. Parametric images showed a high ki: 9.57 and DV: 192.8% in the primary breast lesion (Liver SUVmax: 3.17, Liver ki: 0.54 and Liver DV 101%) indicating high proliferative index and tumour vascularity in an ER/PR negative tumour. Dynamic PET shows higher Ki and hypervascularity in a patient with hormone receptor negative status and Her 2 positive status. (Image Courtesy: Department of Nuclear Medicine, Apollo Proton Cancer Centre, Chennai, India).
Figure 7 (a & b): 47 year female with right breast carcinoma (Invasive ductal carcinoma, grade II with ER and PR positive and Her 2 Neu negative status) showing a focal FDG avid soft tissue density lesion (SUVmax: 9.65) in the upper outer quadrant of the right breast with no significant axillary nodes. Parametric images showed ki - 2.86, DV of 102% (liver SUVmax: 4.99, liver ki-1.34 and liver DV – 77.9%) indicating low rate of glucose metabolism and low tumour vascularity in an ER/PR positive tumour. Dynamic PET shows higher Ki and hypervascularity in a patient with hormone receptor negative status and Her 2 positive status. Dynamic PET shows significantly lower Ki and mild hypervascularity in a patient with hormone receptor positive and Her 2 negative status lesion. (Image Courtesy: Department of Nuclear Medicine, Apollo Proton Cancer Centre, Chennai, India).
In patients being monitored for chemotherapy response evaluation, a virtual clinical trial in 22 breast cancer patient comprising of non-high-grade ER+ tumors evaluated pre- and post-therapy, showed the kinetic parameter ki outperformed SUV [55]. Though ki showed more variability than SUV (mean CV ki = 17%, SUV = 13%), ki pre- and post-therapy distributions showed increased separation compared to the SUV pre- and post-therapy distributions (mean normalized difference ki = 0.54, SUV = 0.27) with p < 0.05.
In the neoadjuvant chemotherapy (NAC) setting, an association between K1, ki and SUV with the disease free survival (DFS) and overall survival (OS) has been reported in 75 locally advanced breast cancer patients evaluated with FDG PET prior to and at midpoint of NAC. Tumors that were hormone receptor negative, high grade, highly proliferative or of ductal histology showed higher FDG ki and SUV values. The kinetic measures (AUC = 0.97) were found more robust predictors compared to SUV (AUC = 0.84, P = 0.005) in predicting pathologic response in conjunction with estrogen receptor (ER) and axillary lymph node positivity. Changes in K1 and ki predicted both DFS and OS, while changes in SUV predicted OS only, with changes in only K1 being an independent prognosticator of DFS and OS in a multivariate modelling. On average, pathological complete response (pCR) patients had a 76% and 84% decrease in FDG K1 and FDG ki compared to 27% and 65%, respectively for other than pCR patients (P = <.0001 and P = 0.004). Changes in FDG delivery (K1), and not SUV, during treatment predicted patient outcome, providing independent prognostic information that is distinct from pathology. The authors concluded that these results do provide an impetus for development of clinically practical approaches for obtaining FDG kinetic measures for tumor response evaluation [56].
Two studies characterized the relationship of metabolism and blood flow parameters in newly diagnosed locally advanced breast cancer (LABC) before and 2 months after neoadjuvant chemotherapy using dynamic 18F-FDG and 15O-water PET imaging [57, 58]. While both the mean metabolic rate of glucose (MRFDG) and mean blood flow decreased after chemotherapy, the responders showed a greater decline in MRFDG than did nonresponders (P = 0.05). Nonresponders showed an average increase in blood flow (-32% vs + 48%, P < 0.005), with a statistically significant association between the pathologic degree of response and the percentage change in blood flow at 2 months, indicating that the change in blood flow after therapy predicted disease- free and overall survival [57]. The authors concluded that although both resistant and responsive LABC tumors have an average decline in MRFDG over the course of chemotherapy, resistant tumors have an average increase in blood flow. Patients whose tumors fail to have a decline in blood flow after 2 months of therapy have poorer disease-free and overall survival [57].
In a similar study by Tseng, et al. [58], the individual 18F-FDG rate parameters compared with 15O-water– derived blood flow in 35 newly diagnosed LABC patients before therapy and 2 months after neoadjuvant chemotherapy showed that mean value of prechemotherapy 18F-FDG parameters K1, k2, k3, and ki decreased significantly after therapy (P 0.001). The mean K1 declined in the macroscopic complete response (mCR) and partial response (PR) groups, as classified in the surgical excision tumour samples, whereas it increased in the no response (NR) group with a similar pattern also seen for blood flow. The authors found that while K1 correlated with blood flow; blood flow and glucose metabolism, ki in LABC were not necessarily matched before chemotherapy, but became more tightly correlated after chemotherapy. The ratio of glucose metabolism to blood flow decreased for all tumors, with values close to those of the normal breast in more responsive tumors. The kinetic analysis suggested that the phosphorylation step (K3) is responsible for the changes before and after chemotherapy and is the rate-limiting factor in 18F-FDG accumulation in untreated breast cancers rather than K1 (reflects glucose delivery). As chemotherapy slowed tumor growth and reduced the overall tumor burden, glucose metabolism declined more than blood flow i.e. a shift in the 18F-FDG kinetic pattern after chemotherapy, driven by the rate of phosphorylation (k3) relative to glucose delivery (K1).
Kinetic Analysis of PET Imaging in Other Tumours
The dynamic PET has shown promising results in colorectal tumours for tumour delineation from time activity curve [59] and correlation of K1 with expression of angiogenesis related and cellular proliferation genes [60, 61].
In therapy response monitoring, Bading, et al. and Strauss, et al. suggested that kinetic analysis of 18F- Fluorouracil (5- FU) in rats, using compartmental modeling provides very useful quantitative information about the drug metabolism within the tumour, which may help in predicting the tumour response to 5-FU [62]. The chemotherapeutic effects of FOLFOX protocol (fluorouracil, folinic acid, oxaliplatin) in mice implanted with a human colorectal cell using dynamic PET studies showed that even one therapy may affect the FDG kinetics, which was important to identify the tumours with a good chemotherapeutic effect [63]. In metastatic colorectal carcinoma receiving FOLFOX chemotherapy, the combination of kinetic parameters provides prognostic aspects in classifying the patients into a short or long survival class [64] and the best results in monitoring of chemotherapy was seen when FD (fractal dimension) retrieved from the kinetic analysis is combined with SUV in the static PET imaging [65].
Dimitrakopoulou-Strauss et al. have shown the importance of kinetic analysis in differentiation between benign and malignant bone tumors with the combination of SUVs and the kinetic parameters revealing a sensitivity of 75.86% and specificity of 97.22% in distinguishing the malignant lesion from benign lesion versus sensitivity 54.05% and specificity of 91.30% when depending only on SUV values [66]. Okazumi, et al. confirmed that the kinetic study of 18F-FDG-PET in 117 patients with malignant and benign soft tissue tumors provides important clinical information regarding the histological grading and prognosis [67]. In patients with soft-tissue sarcomas receiving neoadjuvant chemotherapy, the combined use of SUV and influx lead to the highest accuracy in predicting therapy response [67].
In the case of prostate cancer, a dynamic phase helps in better assessment of the prostate bed before the arrival of the eliminated radioactivity in the bladder to extract additional parameters.
In 2008, Schiepers et al. found significant differences between primary and recurrent cancer in the transport, influx and distribution volume kinetics of 11C-acetate in patients with primary prostate tumor and with recurrent tumor on a 20 min acquisition phase [68].
Conclusion
DWB - PET/CT provides invaluable quantitative information of tracer kinetics during the unutilized 60 minutes uptake phase of the study. With the recent advanced PET CT scanners, DWB-PET/CT is feasible and can be easily incorporated in routine clinical practice. Challenges do exist regarding the optimal acquisition protocols, data processing particularly voxel wise analysis and the technical difficulties involved in performing routinely in all patients. Volumetric parameters such as metabolic tumor volume and total lesion glycolysis have been extensively evaluated and have been considered to be more comprehensive markers to reflect metabolic tumor burden than SUVmax in several types of malignancies. They have however not been incorporated into standard clinical practice yet, as optimal segmentation methods to measure these values has not been established. In this regards, the kinetic PET parameters with its promising initial pilot results have a potential to add incremental value to the existing quantitative “SUV” parameter in oncological studies.
The current era of cancer management is based on targeting specific molecular markers that a particular tumor expresses. Most of these FDA approved targeted drugs in combination with other monoclonal antibodies that are capable of blocking coinhibitory immune cell receptors “immune checkpoints” have entered mainstream targeted cancer therapy. Molecular imaging with these novel dynamic imaging and quantitative kinetic parameters potentially holds a promising role in improving tumour characterization, tracking tissue markers or genetic profile-driven therapies and predicting their response. This could well evolve and translate into integrated theranostic approaches. The challenges are however plenty with a lack of guidance currently on the recommendations for its clinical use. One of the future prospects could be the clinical role of parametric PET in breast cancers to differentiate ER/PR negative from ER/PR positive lesions by demonstrating significantly higher values of k3, ki and metabolic rate of FDG in triple negative breast cancer and hormone receptor negative/HER 2 positive subtypes in comparison to hormone-receptor positive breast cancers (i.e. HR+/HER2+ and HR+/HER2-tumors). Dynamic PET and parametric images in this context to predict the biological behavior of other tumors as well and subsequently clinical outcomes in patients is of great potential in the current era of targeted therapies. Though the potential clinical value appears to be plenty, validation through prospective studies on individual cancers and patient outcomes will definitely help DWB - PET/CT parametric imaging to enter into routine clinical practice.
The limitations are however lengthy acquisition times which is a challenge to image elderly and sick patients who are required to lie still during the 1 hour dynamic acquisition time. Movement artefacts and image misregistrations can adversely affect the quality of studies. Lengthy acquisition time can also affect throughput of patients in departments with high patient workload. The parametric software based on patlak model available on the “Syngovia” platform offers automatic generation of direct patlak images and plasma input functions. Despite this as an advantage, the protocols can neither be customised to shorten the acquisition timings nor allows generating time activity curves/ other dynamic parameters such as “time to peak” etc.
References
-
Freeman LM, Johnson PM (1984) Clinical radionuclide imaging. 3rd (Edn.), Grune & Stratton Inc 25(12): 1397.
-
Weissman BN (2009) Imaging of arthritis and metabolic bone disease. Elsevier Health Sciences, pp: 22.
-
Gullberg GT, Reutter BW, Sitek A, Maltz JS, Budinger TF (2010) Dynamic single photon emission computed tomography—basic principles and cardiac applications. Phys Med Biol 55(20): R111-R191.
-
Dennis Vriens, Eric Visser P, Lioe Fee de Geus Oei, Wim Oyen JG (2010) Methodological considerations in quantification of oncological FDG PET studies. Eur J Nucl Med Mol Imaging 37(7): 1408-1425.
-
Michael C Adams, Timothy G Turkington, Joshua M Wilson, Terence Z Wong (2010) A Systematic Review of the Factors Affecting Accuracy of SUV Measurements. Am J Roentgenol 195(2): 310-320.
-
Jian Huang, Finbarr O’Sullivan (2014) An Analysis of Whole Body Tracer Kinetics in Dynamic PET Studies With Application to Image-Based Blood Input Function Extraction. IEEE Trans Med Imaging 33(5): 1093-1108.
-
Mustafa Takesh (2012) The Potential Benefit by Application of Kinetic Analysis of PET in the Clinical Oncology. International Scholarly Research Notices 2012: 349351.
-
Fotis Kotasidis A, Charalampos Tsoumpas, Arman Rahmim (2014) Advanced kinetic modelling strategies: towards adoption in clinical PET imaging. Clin Transl Imaging 2: 219-237.
-
Slomka PJ, Pan T, Germano G (2016) Recent Advances and Future Progress in PET Instrumentation. Semin Nucl Med 46(1): 5-19.
-
Wendy Siman, Cheenu Kappadath S (2017) Comparison of Step-and-Shoot and Continuous-Bed-Motion PET Modes of Acquisition for Limited-View Organ Scans. J Nucl Med Technol 45(4): 290-296.
-
Wang G, Qi J (2013) Direct estimation of kinetic parametric images for dynamic PET. Theranostics 3(10): 802-815.
-
Michele Scipioni, Assuero Giorgetti, Daniele Della Latta, Sabrina Fucci, Vincenzo Positano, et al. (2018) Direct Parametric Maps Estimation from Dynamic PET Data: An Iterated Conditional Modes Approach. Journal of Healthcare Engineering 2018: 5942873.
-
Mara Scussolini, Sara Garbarino, Gianmario Sambuceti, Giacomo Caviglia, Michele Piana (2017) A physiology- based parametric imaging method for FDG–PET data. Inverse Problems 33(12): 125010.
-
Nicolas Karakatsanis A, Martin Lodge A, Abdel Tahari K, Zhou Y, Richard Wahl L, et al. (2013) Dynamic whole body PET parametric imaging: I. Concept, acquisition protocol optimization and clinical application. Phys Med Biol 58(20): 7391-7418.
-
Dimitrakopoulou Strauss A, Pan L, Sachpekidis C (2021) Kinetic modeling and parametric imaging with dynamic PET for oncological applications: general considerations, current clinical applications, and future perspectives. Eur J Nucl Med Mol Imaging 48(1):21-39.
-
Koon Pong Wong, Xiaoli Zhang, Sung Cheng Huang (2013) Improved derivation of input function in dynamic mouse [18F] FDG PET using bladder radioactivity kinetic. Mol Imaging Biol 15(4): 486-496.
-
Nicolas Karakatsanis A, Yun Zhou, Martin Lodge A, Michael Casey E, Richard Wahl L, et al. (2015) Generalized whole-body Patlak parametric imaging for enhanced quantification in clinical PET. Phys Med Biol 60(22): 8643-8673.
-
Patlak CS, Blasberg RG, Fenstermacher J (1983) Graphical evaluation of blood-to-brain transfer constants from multiple-time uptake data. J Cereb Blood Flow Metab 3(1): 1-7.
-
Patlak CS, Blasberg RG (1985) Graphical evaluation of blood-to-brain transfer constants from multiple-time uptake data Generalizations. J Cereb Blood Flow Metab 5(4): 584-590.
-
Evan Morris D, Christopher Endres J, Kathleen Schmidt C, Bradley Christian T, Raymond Muzic F, et al. (2004) Kinetic Modeling in Positron Emission Tomography. Emission Tomography, pp: 499-540.
-
Arman Rahmim, Martin Lodge A, Nicolas Karakatsanis A, Vladimir Panin Y, Yun Zhou, et al. (2019) Dynamic whole-body PET imaging: principles, potentials and applications. Eur J Nucl Med Mol Imaging 46(2): 501- 518.
-
Antonia Dimitrakopoulou Strauss, Leyun Pan, Ludwig G (2012) Strauss. Quantitative approaches of dynamic FDG- PET and PET/CT studies (dPET/CT) for the evaluation of oncological patients. Cancer Imaging 12(1): 283-289.
-
Messa C, Choi Y, Hoh CK, Jakobs EL, Glaspy JA, et al. (1992) Quantification of glucose utilization in liver metastases: parametric imaging of FDG uptake with PET. J Comput Assist Tomogr 16(5): 684-689.
-
Apostolopoulos DJ, Dimitrakopoulou Strauss A, Hohenberger P, Roumia S, Strauss LG (2011) Parametric images via dynamic 18F-fluorodeoxyglucose positron emission tomographic data acquisition in predicting midterm outcome of liver metastases secondary to gastrointestinal stromal tumours. Eur J Nucl Med Mol Imaging 38(7): 1212-1223.
-
Dimitrakopoulou Strauss A, Hohenberger P, Pan L, Kasper B, Roumia S, et al. (2012) Dynamic PET (dPET) with FDG in patients with unresectable aggressive fibromatosis: regression-based parametric images and correlation to the FDG kinetics based on a two-tissue compartment mode. Clin Nucl Med 37(10): 943-948.
-
Dimitrakopoulou Strauss A, Hoffmann M, Bergner R, Uppenkamp M, Eisenhut M, et al. (2007) Prediction of short-term survival in patients with advanced nonsmall cell lung cancer following chemotherapy based on 2-deoxy-2-(F-18)-fluoro-D-glucose positron emission tomography: a feasibility study. Mol Imaging Biol 9(5): 308-317.
-
Spence AM, Muzi M, Mankoff DA, O’Sullivan F, Link J, et al. (2004) 18F-FDG PET of gliomas at delayed intervals: improved distinction between tumor and normal gray matter. J Nucl Med 45(10): 1653-1659.
-
Laverman P, Boerman OC, Corstens FHM, Oyen WJG (2002) Fluorinated amino acids for tumour imaging with positron emission tomography. Eur J Nucl Med Mol Imaging 29(5): 681-690.
-
Weber WA, Wester HJ, Grosu AL, Herz M, Dzewas B, et al. (2000) O-(2-[18F] fluoroethyl)-L-tyrosine and L-[methyl-11C]methionine uptake in brain tumours: initial results of a comparative study. Eur J Nucl Med Mol Imaging 27(5): 542-549.
-
Becherer A, Karanikas G, Szabó M, Zettinig G, Asenbaum S, et al. (2003) Brain tumour imaging with PET: a comparison between [18F]fluorodopa and [11C] methionine. Eur J Nucl Med Mol Imaging 30(11): 1561- 1567.
-
Chen W, Daniel Silverman DHS, Delaloye S, Czernin J, Nirav Kamdar N, et al. (2006) 18F-FDOPA PET imaging of brain tumors: comparison study with 18F-FDG PET and evaluation of diagnostic accuracy. J Nucl Med 47(6): 904-911.
-
Moon SH, Kim TS, Kim SK (2010) Dynamic 11C-acetate PET/CT in the evaluation of brain tumors: prospective study. J Nucl Med 51: 499.
-
Ishiwata K, Kubota K, Murakami M, Kubota R, Sasaki T, et al. (1993) Re-evaluation of amino acid PET studies: can the protein synthesis rates in brain and tumor tissues be measured in vivo? J Nucl Med 34(11): 1936-1943.
-
Schiepers C, Chen W, Cloughesy T, Dahlbom M, Huang SC (2007) 18F-FDOPA kinetics in brain tumors. J Nucl Med 48(10): 1651-1661.
-
Gabriele Po¨pperl, Friedrich Kreth W, Jochen Herms, Walter Koch, Jan Mehrkens H, et al. (2006) Analysis of 18F-FET PET for Grading of Recurrent Gliomas: Is Evaluation of Uptake Kinetics Superior to Standard Methods? J Nucl Med 47(3): 393-403.
-
Debus C, Afshar Oromieh A, Floca R, Ingrisch M, Knoll M, et al. (2018) Feasibility and robustness of dynamic 18F-FET PET based tracer kinetic models applied to patients with recurrent high-grade glioma prior to carbon ion irradiation. Scientific Reports 8: 14760.
-
Pyka T, Gempt J, Ringel F, Hüttinger S, van Marwick S, et al. (2014) Prediction of Glioma Recurrence Using Dynamic 18F-Fluoroethyltyrosine PET. Am J of Neuroradiol 35(10): 1924-1929.
-
Manuel Röhrich, Kristin Huang, Daniel Schrimp, Nathalie Albert L, Thomas Hielscher, et al. (2018) Integrated analysis of dynamic FET PET/CT parameters, histology, and methylation profiling of 44 gliomas. Eur J Nucl Med & Mol Imaging 45(9): 1573-1584.
-
Kawai N, Nishiyama Y, Miyake K, Tamiya T, Nagao S (2005) Evaluation of tumor FDG transport and metabolism in primary central nervous system lymphoma using [18F]fluorodeoxyglucose (FDG) positron emission tomography (PET) kinetic analysis. Ann Nucl Med 19(8): 685-690.
-
Nishiyama Y, Yamamoto Y, Monden T, Sasakawa Y, Kawai N, et al. (2007) Diagnostic value of kinetic analysis using dynamic FDG PET in immunocompetent patients with primary CNS lymphoma. Eur J Nucl Med Mol Imaging 34(1): 78-86.
-
Gould MK, Maclean CC, Kuschner WG, Rydzak CE, Owens DK (2001) Accuracy of positron emission tomography for diagnosis of pulmonary nodules and mass lesions: a meta-analysis. JAMA 285(7): 914-924.
-
Jeong SY, Lee KS, Shin KM, Bae YA, Kim BT, et al. (2008) Efficacy of PET/CT in the characterization of solid or partly solid solitary pulmonary nodules. Lung Cancer 61(2): 186-194.
-
Dabrowska M, Krenke R, Korczynski P, Maskey- Warzechowska M, Zukowska M, et al. (2015) Diagnostic accuracy of contrast-enhanced computed tomography and positron emission tomography with 18-FDG in identifying malignant solitary pulmonary nodules. Medicine (Baltimore) 94(15): e666.
-
Goo JM, Im JG, Do KH, Yeo JS, Seo JB, et al. (2000) Pulmonary Tuberculoma Evaluated by Means of FDG PET: Findings in 10 Cases. Radiology 216(1): 117-121.
-
Sathekge MM, Maes A, Pottel H, Stoltz A, Wiele CVD (2010) Dual time-point FDG PET/CT for differentiating benign from malignant solitary pulmonary nodules in a TB endemic area. S Afr Med J 100(9): 598-601.
-
Huang YE, Lu HI, Liu FY, Huang YJ, Lin MC, et al. (2012) Solitary Pulmonary Nodules Differentiated by Dynamic F-18 FDG PET in a Region with High Prevalence of Granulomatous Disease. J Radiat Res 53(2): 306-312.
-
Wang Q, Wang RF, Zhang J, Zhou Y (2013) Differential diagnosis of pulmonary lesions by parametric imaging in 18F-FDG PET/CT dynamic multi-bed scanning. J BUON 18(4): 928-934.
-
Tsuchida T, Demura Y, Sasaki M, Morikawa M, Umeda Y, et al. (2011) Differentiation of histological subtypes in lung cancer with 18F-FDG-PET 3-point imaging and kinetic analysis. Hell J Nucl Med 14(3): 224-227.
-
Muzi M, Vesselle H, Grierson JR, Mankoff DA, Schmidt RA, et al. (2005) Kinetic analysis of 3′-deoxy-3′- fluorothymidine PET studies: validation studies in patients with lung cancer. J Nucl Med 46(2): 274-282.
-
McGowan DR, Skwarski M, Papiez BW, Macpherson RE, Gleeson FV, et al. (2018) Whole tumor kinetics analysis of 18F-fluoromisonidazole dynamic PET scans of non- small cell lung cancer patients, and correlations with perfusion CT blood flow. EJNMMI Res 8(1): 73.
-
Meijer TWH, Geus Oei LFD, Visser EP, Oyen WJG, Looijen Salamon MG, et al. (2017) Tumor Delineation and Quantitative Assessment of Glucose Metabolic Rate within Histologic Subtypes of Non– Small Cell Lung Cancer by Using Dynamic 18F Fluorodeoxyglucose PET. Radiology 283(2): 547-559.
-
Van Der Veldt AAM, Lubberink M, Greuter HN, Comans EFI, Herder GJM, et al. (2011) Absolute quantification of [11C]docetaxel kinetics in lung cancer patients using positron emission tomography. Clin Cancer Res 17(14): 4814-4824.
-
Kajáry K, Lengyel Z, Tőkés AM, Kulka J, Dank M, et al. (2020) Dynamic FDG-PET/CT in the Initial Staging of Primary Breast Cancer: Clinicopathological Correlations. Path & Oncol Res 26(2): 997-1006.
-
Dunnwald LK, Doot RK, Specht JM, Gralow JR, Ellis GK, et al. (2011) PET tumor metabolism in locally advanced breast cancer patients undergoing neoadjuvant chemotherapy: value of static versus kinetic measures of fluorodeoxyglucose uptake. Clin Cancer Res 17(8): 2400-2409.
-
Wangerin KA, Muzi M, Peterson LM, Linden HM, Novakova A, et al. (2017) A virtual clinical trial comparing static versus dynamic PET imaging in measuring response to breast cancer therapy. Phys Med Biol 62(9): 3639-3655.
-
Mankoff DA, Dunnwald LK, Gralow JR, Ellis GK, Schubert EK, et al. (2003) Changes in Blood Flow and Metabolism in Locally Advanced Breast Cancer Treated With Neoadjuvant Chemotherapy. J Nucl Med 44(11): 1806- 1814.
-
Tseng J, Dunnwald LK, Schubert EK, Link JM, Minoshima S, et al. (2004) 18F-FDG Kinetics in Locally Advanced Breast Cancer: Correlation with Tumor Blood Flow and Changes in Response to Neoadjuvant Chemotherapy. J Nucl Med 45(11): 1829-1837.
-
Janssen MHM, Aerts HJWL, Öllers MC, Bosmans G, Lee JA, et al. (2009) Tumor delineation based on time- activity curve differences assessed with dynamic fluorodeoxyglucose positron emission tomography- computed tomography in rectal cancer patients. Int J Rad Oncol Biol Phy 73(2): 456-465.
-
Strauss LG, Koczan D, Klippel S, Pan L, Cheng C, et al. (2008) Impact of angiogenesis-related gene expression on the tracer kinetics of 18F-FDG in colorectal tumors. J Nucl Med 49(8): 1238-1244.
-
Strauss LG, Koczan D, Klippel S, Pan L, Cheng C, et al. (2011) Impact of cell-proliferation-associated gene expression on 2-deoxy-2-[18F]fluoro-D-glucose (FDG) kinetics as measured by dynamic positron emission tomography (dPET) in Colorectal Tumors. Mol Imaging and Biol 13(6): 1290-1300.
-
Bading JR, Yoo PB, Fissekis JD, Alauddin MM, D’Argenio DZ, et al. (2003) Kinetic modeling of 5-fluorouracil anabolism in colorectal adenocarcinoma: a positron emission tomography study in rats. Can Res 63(13): 3667-3674.
-
Strauss LG, Hoffend J, Koczan D, Pan L, Haberkorn U, et al. (2009) Early effects of FOLFOX treatment of colorectal tumour in an animal model: assessment of changes in gene expression and FDG kinetics. Eur J Nucl Med and Mol Imaging 36(8): 1226-1234.
-
Dimitrakopoulou Strauss A, Strauss LG, Burger C, Rühl A, Irngartinger G, et al. (2004) Prognostic aspects of 18F-FDG PET kinetics in patients with metastatic colorectal carcinoma receiving FOLFOX chemotherapy. J Nucl Med 45(9): 1480-1487.
-
Dimitrakopoulou Strauss A, Strauss LG, Rudi J (2003) PET-FDG as predictor of therapy response in patients with colorectal carcinoma. Quart J Nucl Med 47(1): 8-13.
-
Dimitrakopoulou Strauss A, Strauss LG, Heichel T, Wu H, Burger C, et al. (2002) The role of quantitative 18F-FDG PET studies for the differentiation of malignant and benign bone lesions. J Nucl Med 43(4): 510-518.
-
Okazumi S, Dimitrakopoulou Strauss A, Schwarzbach MHM, Strauss LG (2009) Quantitative, dynamic 18F-FDG- PET for the evaluation of soft tissue sarcomas: relation to differential diagnosis, tumor grading and prediction of prognosis. Hell J of Nucl Med 12(3): 223-307.
-
Dimitrakopoulou Strauss A, Strauss LG, Egerer G, Vasamiliette J, Mechtersheimer G, et al. (2010) Impact of dynamic 18F-FDG PET on the early prediction of therapy outcome in patients with high-risk soft-tissue sarcomas after neoadjuvant chemotherapy: a feasibility study. J Nucl Med 51(4): 551-558.
-
Schiepers C, Hoh CK, Nuyts J, Seltzer M, Wu C, et al. (2008) 1-11C-acetate kinetics of prostate cancer. J Nucl Med 49(2): 206-215.
- Ultrasound Guided Therapeutic Nerve Blocks
- Cyclops Lesion Without ACL Reconstruction: A Rare Case in a Patient with Intact Anterior Cruciate Ligament and Tibial Plateau Fracture
- Dosimetric Comparison between Two Dose Calculation Algorithms in SBRT Treatment of Lung Cancer in Ring-based and C-arm Radiation Therapy Equipment
- Adolescent Testicular Adrenal Rest Tumors: A Case Report and Review of the Literature
- Giant Intrathoracic Lipoma: A Rare Presentation
- Image of a Right Renal Angiomyolipoma Complicated by Hemorrhage