Ultrasound Demonstration of Hepatic Arterial Buffer Response for Blood Flow Regulation
This is observation analytical case control study deal with assessment of hepatic arterial buffer response for blood flow regulation using ultrasonography taking 300 subjects. 150 normal control group and 150 patients with chronic liver diseases. Several previous studies in various setting has support ultrasound scanning as non-invasive, cost effected, reliable, and accurate tool for measuring portal vein diameter and flow comparing with hepatic artery diameter for assess hepatic artery buffer response for blood flow regulation in chronic liver diseases. The Aim: Importance of the study to help in diagnosis impairment of HABR for blood flow regulation in chronic liver diseases in early stage to avoid the complication. As well as to reduce the cost and time of other examination. Method: The data was collected, analyzed by using Statistical Packaged for Social Studies (SPSS). Ultrasound examinations were performed in Tropical Diseases Teaching Hospital. Omdurman, Khartoum State during the period) from January 2021to August 2022(on 150 patients as study group (85 male and 65 female) and 150 control group with normal abdominal scan (Patient who had previous abdominal surgery was excluded). The Result: In result we found significant correlation (P=0.00) between hepatic artery diameter, liver craniocaudal length CCLcm, caudate lobe size and portal vein diameter, with direction of flow. Highly significant correlation (r=-0.222; P=0.006) was noticed between portal vein diameter and hepatic artery diameter of patient under investigation. In patient with cirrhosis found dilated portal vein associated with Hepatofugal flow away from liver combined with dilated hepatic artery to compensate the liver supply. In case of fatty liver infiltration, the portal vein decrease diameter and flow associated with increase liver size and hepatic artery diameter to supply the liver. In liver tumor HCC the portal vein decrease diameter and flow associated with increase liver size and hepatic artery diameter. In hepatitis both portal vein and hepatic artery dilated to increase supply to the liver. These were expected and goes with previous study. The study also found that there was significant correlation between Sudanese HABR and international standard. The study recommended further study to measure HABR routinely with chronic liver diseases ultrasound scan.
Introduction
The Hepatic Arterial Buffer Response (HABR)
The liver is an exceptionally vascular organ. Although it constitutes only 2.5% of bodyweight, it receives about 25% of the cardiac output. The liver is unique in that it is supplied by 2 distinct blood inflow systems, the portal vein (PV) and the hepatic artery (HA). When portal blood flow decreases, total hepatic blood flow is restored by an increase in HA blood flow. This regulatory mechanism is referred to as the hepatic arterial buffer response (HABR) [1].
Cruz and Ribeiro tested the hypothesis that HABR can maintain adequate liver oxygenation after temporary liver dearterialization, Hepatic artery ligation produces a progressive reduction in portal vein blood flow. Theoretically, a hyperemic response may be expected following hepatic artery reperfusion (HABR). A complete restoration of HABF after hepatic artery declamping was observed; they conclude that temporary hepatic artery occlusion induced a progressive decrease in portal vein blood flow during ischemia, an effect that continued during the reperfusion period. The hepatic artery blood flow was promptly restored after declamping [2]. The discovery of the mechanism of the hepatic arterial buffer response (HABR) is resulting in a dramatic decrease in hepatic oxygen delivery [3]. Burton-Opitz observed an increase in hepatic arterial blood flow upon reduced portal venous inflow, this intimate relationship between these two vascular systems was termed HABR for the first time in 1980 by Lautt [4, 5].
Randhir et al. found if portal blood flow is reduced, the hepatic artery dilates, and the hepatic artery constricts, if portal flow is increased [6]. Increase in hepatic arterial flow in response to reduced portal flow (hepatic arterial buffer response) has been demonstrated experimentally and surgically. Using transit-time ultrasonic volume flowmeter, intraoperative measurement of the hepatic artery and portal venous flows in anesthetized patients with carcinoma of the splanchnic area has revealed a sharp and significant increase in hepatic arterial flow of about 30% after temporary occlusion of the portal vein, while temporary occlusion of the hepatic artery did not have any significant effect on portal venous circulation [7].
The portal vein as well as a separate hepatic artery undergo progressive parallel divisions through a small space referred to as the space of Mall, which is surrounded by a limiting plate of hepatocytes. The space of Mall is seen in the portal triad, which is most typically identified as an enclosed space arranged in a hexagonal pattern around a central hepatic venule. In the space of Mall, the two vessels eventually drain into the hepatic sinusoids. Adenosine appears to be produced at a constant rate, independent of oxygen supply or demand, and is secreted into the space of Mall where it serves as a powerful dilator of the hepatic artery. The concentration of adenosine is regulated by the rate of washout into the blood vessels that pass through the space of Mall. According to this theory, a decrease in portal blood flow results in a reduced washout of adenosine and the accumulated adenosine concentration results in dilation of the hepatic artery thus partially compensating for the decrease in portal blood flow. A similar mechanism accounts for auto regulation of the hepatic artery whereby an increase in hepatic arterial flow leads to an increased washout of adenosine and a subsequent constriction of the artery [3].
A central mechanism that controls and allows constancy of hepatic blood flow is the hepatic arterial buffer response, this mechanism that are independent of extrinsic innervation or vasoactive agents that regulate hepatic arterial and portal venous inflow circuits. The hepatic arterial buffer response (HABR) is unique mechanism represents the ability of the hepatic artery to produce compensatory flow changes in response to changes in portal venous flow [7]. Park found a statistically significant correlation with elevated Hepatic arterial velocity (HAv) and increasing Model for End-Stage Liver Disease (MELD) scores, splenomegaly, and presence of ascites in patients with cirrhotic liver disease; this may be a useful imaging biomarker in the evaluation of patients with cirrhosis [8].
In this research we provide the relation of these two vessels in normal individual and the pathologic evidence for hepatic arterial buffer response in chronic liver disease patients with ultrasound measurement of liver size and portal vein diameter, hepatic artery diameter. Morphologic features were compared with age and gender-matched controls.
Problem of the Study
The central mechanism that controls and allows constancy of hepatic blood flow is the HABR. It was assessed through intraoperative measurement by transit- time ultrasonic volume flowmetry, but it considers invasive procedure for only intraoperative patient. Ultrasound represents a noninvasive tool for assessing the relevance of this intimate hepatic blood flow regulatory system in health and disease. And there is no previous study about how assessing this mechanism using grey scale ultrasound and How Fatty liver, liver cirrhosis, and hepatitis affect in HABR.
Justification
There is no literature and back ground reference to hepatic arterial buffer response measurements or index value for the Sudanese was established. The questions to be answered: What are the standard measurements of the hepatic arterial buffer response for Sudanese subjects in different age groups and gender. Can Ultrasound able to detect the measurement of hepatic arterial buffer response. We exclusively focus on the endogenous interrelationship between the hepatic arterial and portal venous inflow circuits in healthy as well as inflammatory, fatty and chronic liver diseases using ultrasound. This study will help in early diagnosis of altered or impaired HABR.
Research Questions • What is the relation between normal PV diameter and normal HA diameter?
• How change in normal PV diameter affect the HA diameter?
• Is the change in HA diameter affect the PV diameter?
• How Fatty liver, liver cirrhosis, and hepatitis affect in HABR?
• What is the effect of age, gender, hepatomegaly, presence of ascites on HABR?
General Objectives
The aim of this study is to assess the of the regulation of the hepatic blood flow by hepatic buffer response using ultrasound in patients with fatty liver, liver cirrhosis and inflammatory liver diseases compared with control healthy subjects and to identify specific correlations with the changes in PV diameter and degree of HA diameter changes.
Specific Objective
• To measure the correlation of PV diameter and HA diameter.
• To correlate age, gender, with degree of HABR.
• To correlate the presence of ascites with degree of HABR
• To find the relation of HABR with liver size.
Effect of Fatty Liver on Portal Vein and Hepatic Artery
Recent studies have suggested that hepatic artery and portal vein flow characteristics are altered in fatty liver. Because patients with liver disease such as cirrhosis, parenchymal fibrosis, and malignancy may also have fatty infiltration of the liver, it is important to know the effect of the fatty infiltration itself on portal venous hemodynamics. The pulsatility index and mean velocity of the portal vein blood flow decrease as the severity of fatty infiltration increases [9].
Effect of Hepatitis on Portal Vein and Hepatic Artery
However, no information is available about the regulation of hepatic arterial blood flow in human beings with acute viral hepatitis. The increased hepatic arterial blood flow during acute hepatitis may reflect a rapid proliferative process in the liver after the virally induced damage. Research findings leave no doubt that the hepatic artery and its branches are enlarged in patients with acute viral hepatitis [10].
Effect of Liver Cirrhosis on Portal Vein and Hepatic Artery
The studies demonstrated reduced total liver blood flow caused by reduced portal venous perfusion in cirrhosis while hepatic arterial blood flow was maintained.
Normally, the portal vein provides the major blood supply of oxygen to the liver. In cirrhosis, the change of the ratio of portal venous to hepatic arterial blood flow in favor of the hepatic artery may sustain oxygen delivery and exert a protective effect on organ function and integrity. Because portal venous blood flow is reduced in cirrhosis, the maintenance of hepatic arterial blood flow and the preserved HABR probably represent a beneficial mechanism for hepatic circulation, thereby counteracting impaired nutritive blood supply of the cirrhotic liver [11].
Effect of Portal Hypertension on Portal Vein and Hepatic Artery
The portal vein has a segmental intrahepatic distribution, accompanying the hepatic artery. Normal portal pressure is about 7 mmHg, when the portal circulation is obstructed, whether it be within or outside the liver, a remarkable collateral circulation develops to carry portal blood into the systemic veins. When the liver is cut off from portal blood by the development of the collateral circulation, it depends more on blood from the hepatic artery. It shrinks and shows impaired capacity to regenerate. Collaterals usually imply portal hypertension, although occasionally if the collateral circulation is very extensive portal pressure may fall. Conversely, portal hypertension of short duration can exist without a demonstrable collateral circulation [12].
Sonography of the Liver
The liver is best examined with real-time sonography, ideally after a 6-hour fast. Both supine and right anterior oblique views should be obtained. Sagittal, transverse, coronal, and subcostal oblique views are suggested using both a standard abdominal transducer and a higher frequency transducer. Many patients’ liver is tucked beneath the lower right ribs, so a transducer with a small scanning face, allowing an intercostal approach, is invaluable. Further, the recent introduction of volumetric imaging to ultrasound contributes greatly to the evaluation of the liver as a single, appropriately selected acquisition and may show virtually the entire liver, allowing for a rapid portrayal of liver anatomy, size, texture, and surface characteristics. Therefore, differentiation of the diffuse changes of cirrhosis and fatty liver from normal are enhanced of the acquisitions as well as the multiplanar reconstructions (Figures 1-7). Ultrasound also best demonstrates the relationship of focal liver masses to the vital vascular structures if surgical resection is contemplated [13].
![Figure 1: Normal liver. Liver shown in a nine-on-one format from a volumetric acquisition acquired in the axial plane, with the center point on the long axis of the portal veins at the porta hepatis [13].](/fulltextimages/9317/fig_1.jpeg)
Material and Method
Ultrasound machines with frequencies transducer 3.5 to 5 MHz, with Doppler capability. Coupling jells and TV card with 16 bit to capture the ultrasound image using the personal computer. This is analytical, case control study where the patients selected randomly, with a control group free from disease. The study includes adult patients with fatty liver, liver cirrhosis, and inflammatory diseases compared with volunteers free from disease, all gender and ethnic groups, Patient who had previous liver surgery was excluded. The sample of this study is a convenience sample where only those units which are accessible at the time are taken. Sample size 150 patients selected randomly for control group, 150 patients with chronic liver disease.
This study was conducted in suba Hospital in Khartoum State. Khartoum is a capital of the Republic of Sudan located at the confluence of the White Nile flowing north from Lake Victoria and the Blue Nile flowing west from Ethiopia. In duration from January 2020 to July 2022.
Method of Data Analysis
Data was analyzed by using Statistical Packaged for Social Studies (SPSS) and Excel under windows. The variable included in the study was portrayed using histogram plots Part I: Frequency Distribution with normal distribution curve over-plotted. As well the association between the PV diameter (independent variable) and the others variables (dependent) was investigated using multiple linear regression stepwise analysis and logistic regression. The selected variable was used to studies the correlation between normal PV diameter and HA diameter in normal individuals (using K-means and Fisher discriminant analysis). And compensatory change in hepatic artery due to obstruct PV in chronic liver diseases.
Discussion
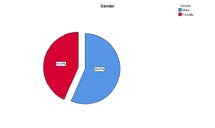
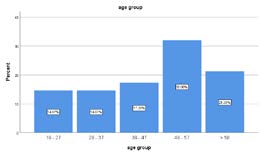
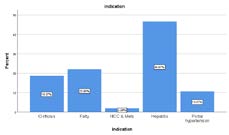
Table 1 and Figure 8: shows that 85 out of 150 (56.7%) were males and 65 out of 150 (43.3%) were females in case group. Table 2 and Figure 2: shows frequency distribution of age groups in case group 22 out of 150 (14.7%) of patients their age less than 27 years, followed by 22 out of 150 (14.7) between 28-37 years, 26 out of 150 (17.3%) between 38-47 years, 48 out of 150 (22%) between 48-57 years and the rest 38 out of 150 (21.3%) their age 58 years or above. Table 3 and Figure 3: shows frequency distribution of indication for ultrasound in case group. 28(18.7%) out of 150 (100.0%) of patients under investigation had liver Cirrhosis, followed by 33 (22.0%) patients complain of fatty, liver disease, 3 (2.0%) patients had hepatocellular carcinoma HCC, 70 (46.7%) had Hepatitis and 16 (10.7) with portal hypertension.
| Frequency | percent | Valid percent | Cumulative percent | |
|---|---|---|---|---|
| Male | 85 | 56.7 | 56.7 | 56.7 |
| Female | 65 | 43.3 | 43.3 | 100 |
| Total | 150 | 100 | 100 |
Table 1: Shows frequency distribution of gender in case group.
| Age group | Frequency | Percent | Valid Percent | Cumulative Percent |
|---|---|---|---|---|
| 18 - 27 | 22 | 14.7 | 14.7 | 14.7 |
| 28 - 37 | 22 | 14.7 | 14.7 | 29.3 |
| 38 - 47 | 26 | 17.3 | 17.3 | 46.7 |
| 48 - 57 | 48 | 32 | 32 | 78.7 |
| > 58 | 32 | 21.3 | 21.3 | 100 |
| Total | 150 | 100 | 100 |
Table 2: Shows frequency distribution of age in case group.
| Indication | Frequency | Percent | Valid Percent | Cumulative Percent |
|---|---|---|---|---|
| Cirrhosis | 28 | 18.7 | 18.7 | 18.7 |
| Fatty | 33 | 22 | 22 | 40.7 |
| HCC & Mets | 3 | 2 | 2 | 42.7 |
| Hepatitis | 70 | 46.7 | 46.7 | 89.3 |
| Portal hypertension | 16 | 10.7 | 10.7 | 100 |
| Total | 150 | 100 | 100 |
Table 3: Shows frequency distribution of indication for ultrasound in case group.
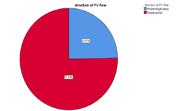
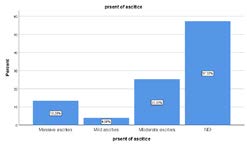
Table 4 and Figure 4 are Frequency distribution of direction of portal vein flow in case group was demonstrated that the majority of patients 113 (75.3%) out of 150 (100.0%) with portal blood flow toward the liver (Hepatoportal) and 37 (24.7%) of patients with portal blood flow away from liver (Hepatofugal). Table 5 and Figure 5 are Frequency distribution of present of ascites in case group was shows that the 20 (13.3%) out of 150 (100.0%) presents with massive ascites, followed by 6 (27%) presents with mild ascites, 38 (25.3%) with moderate ascites, and the more than half of patients 86 (57.3%) not had ascites present. Table 6 is Descriptive statistics in case group for measurements minimum, maximum and mean ±SD of the age was (18 – 70 mean ±SD 45.9 ± 13.19 years) and PVD, HAD shown (0.56 – 2.70 mean ±SD 1.24 ± 0.314 mm) (0.19 – 0.69 mean ±SD 0.375 ± 0.085 mm) respectively, while measurements of minimum, maximum and mean ± SD PD liver was (8.50 – 23.00 mean ±SD 13.64 ± 3.492 cm) and caudate lobe size was (4.40 – 23.00 mean ±SD 2.342 ± 0.645 cm). Table 7 is independent sample t-test to compares mean measurement of the age, PVD, HAD, liver and caudate lobe size according to gender in case group shows that the mean ±SD of PVD in male was (1.28 ± 0.309 mm) and female was (1.18 ± 0.314 mm) and the mean ±SD of HAD in male was (0.379± 0.090 mm) and female was (0.370 ± 0.078 mm) while the mean ±SD of liver and caudate lobe in male was (13.83 ± 3.318 cm) (2.45 ± 0.675 cm) respectively and female was (13.39 ± 3.719 cm), (2.202 ± 0.580 mm) respectively, the independent sample t-test to compares mean for the PVD, HAD, liver and caudate lobe size according to gender shows insignificant different between male and female in case group with p value > 0.05 for all variables. Table 8 is One-Way ANOVA, to compares mean measurement in different age group in case group for the PVD, HAD, liver shows insignificant different between male and female in case group with p value > 0.05 for all variables.
| Direction of PV flow | Frequency | Percent | Valid Percent | Cumulative Percent |
|---|---|---|---|---|
| Hepatofugal/away | 37 | 24.7 | 24.7 | 24.7 |
| Hepatopetal | 113 | 75.3 | 75.3 | 100 |
| Total | 150 | 100 | 100 |
Table 4: Shows frequency distribution of direction of portal vein flow in case group.
| Present of ascites | Frequency | Percent | Valid Percent | Cumulative Percent |
|---|---|---|---|---|
| Massive ascites | 20 | 13.3 | 13.3 | 13.3 |
| Mild ascites | 6 | 4 | 4 | 17.3 |
| Moderate ascites | 38 | 25.3 | 25.3 | 42.7 |
| NO | 86 | 57.3 | 57.3 | 100 |
| Total | 150 | 100 | 100 |
Table 5: Shows frequency distribution of present of ascites in case group.
| Descriptive Statistics | ||||||
|---|---|---|---|---|---|---|
| Variables | N | Minimum | Maximum | Mean | Std. Deviation | |
| Age | 150 | 18 | 70 | 45.49 | 13.195 | |
| PVD\ cm | 150 | 0.56 | 2.7 | 1.2438 | 0.31474 | |
| HAD\cm | 150 | 0.19 | 0.69 | 0.3753 | 0.08541 | |
| Liver ccl\cm | 150 | 8.5 | 23 | 13.642 | 3.49274 | |
| Caudate lobe \cm | 150 | 1 | 4.4 | 2.3428 | 0.64559 | |
| Valid N | 150 | |||||
| Gender Statistics | ||||||
| Variables | Gender | N | Mean | Std. Deviation | Std. Error Mean | P value |
| PVD\cm | Male | 85 | 1.287 | 0.30957 | 0.03358 | 0.053 |
| Female | 65 | 1.186 | 0.31471 | 0.03904 | ||
| HAD\cm | Male | 85 | 0.3793 | 0.09056 | 0.00982 | 0.503 |
| Female | 65 | 0.37 | 0.07854 | 0.00974 | ||
| Liver ccl\cm | Male | 85 | 13.83 | 3.31867 | 0.35996 | 0.452 |
| Female | 65 | 13.39 | 3.71992 | 0.4614 | ||
| Caudate lobe \cm | Male | 85 | 2.45 | 0.67528 | 0.07324 | 0.171 |
| Female | 65 | 2.202 | 0.58017 | 0.07196 |
Table 6: Shows descriptive statistics measurements minimum, maximum and mean ±SD of the age, PVD, HAD, liver and caudate lobe siz
Part II: Relationships
| ANOVA | ||||||
|---|---|---|---|---|---|---|
| Sum of Squares | df | Mean Square | F | Sig | ||
| PVD\cm | Between Groups | 0.294 | 4 | 0.073 | 0.736 | 0.569 |
| Within Groups | 14.466 | 145 | 0.1 | |||
| Total | 14.76 | 149 | ||||
| HAD\cm | Between Groups | 0.022 | 4 | 0.005 | 0.743 | 0.564 |
| Within Groups | 1.065 | 145 | 0.007 | |||
| Total | 1.087 | 149 | ||||
| Liver ccl\cm | Between Groups | 280.639 | 4 | 70.16 | 6.619 | 0 |
| Within Groups | 1537.048 | 145 | 10.6 | |||
| Total | 1817.687 | 149 | ||||
| Caudate lobe \cm | Between Groups | 2.103 | 4 | 0.526 | 1.271 | 0.284 |
| Within Groups | 59.997 | 145 | 0.414 | |||
| Total | 62.1 | 149 |
Table 7: One-Way ANOVA, to compares mean measurement in different age group in case group.
Table 9 compares mean measurement in different direction of portal vein flow in case group found that the PVD and HAD in Hepatofugal flow was (1.567 ± 0.241 mm), (0.451 ± 0.106 mm) respectively which more dilated than Hepatopetal flow the PVD and HAD was (1.137 ± 0.258 mm), (0.35 ± 0.059 mm) respectively, while the liver and caudate lobe decreased in size in patients had Hepatofugal flow., the independent sample t-test to for the PVD, HAD, liver and caudate lobe size according to direction of flow shows highly significant different between hetapofugal and Hepatopetal flow in case group which PVD and HAD dilated while liver and caudate lobe shuriken in hetapofugal with p value 0.000 for all variables.
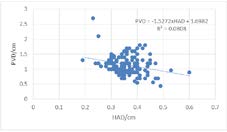
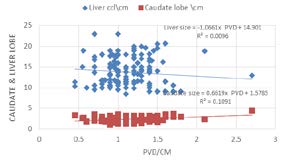
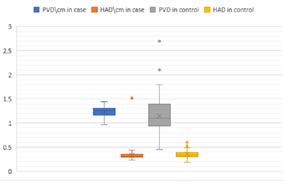
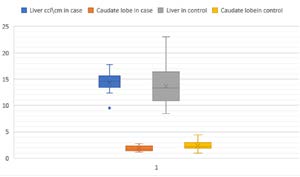
Table 10 compares mean measurement in different indication for ultrasound in case group using ANOVA test shows that the largest PVD was (1.618 ± 0.122 mm) in patients had portal hypertension and largest HAD was (0.443 ± 0.121 mm) in cirrhosis patients while the smallest PVD was (0.900 ± 0.435 mm) in patients had HCC and for HAD was (0.350 ± 0.054 mm) in hepatitis patients ,which more dilated than Hepatopetal flow the PVD and HAD was (1.137 ± 0.258 mm), (0.35 ± 0.059 mm) respectively, while the liver and caudate lobe decreased in size in patients had Hepatofugal flow., the ANOVA test to for the PVD, HAD, liver and caudate lobe shows highly significant according to indication of ultrasound in case group with p value 0.000 for all variables. (Table 11) Compares mean measurement in different degree of ascites in case group using ANOVA test that there was highly significant different mean measurement of the PVD and HAD increased in dimeter while liver and caudate lobe shuriken with increased of degree of the ascites at p value 0.000 for all variables. (Table 12) Correlation between age, portal vein dimeter, hepatic artery dimeter, liver, and caudate lobe measurements in case group the study revealed that there no significant correlation between age of the patients with PVD, HAD and caudate lobe size correlation coefficient (r= 0.007, 0.105, 0.023 respectively at p value > 0.05 ), while there was significant negative correlation between age and liver size (r = -0.356 at p value 0.000), also there was strong significant positive correlation between PVD, HAD and caudate lobe (r = 0.222, 0.570 respectively at p value = 0.000) while there was strong significant negative correlation between PVD and liver size (r = -0.283 at p value = 0.000) , while the HAD strong significant negative correlation with liver size (r = -0.315 at p value = 0.000) and strong significant positive correlation with caudate lobe (r = 0.369 at p value = 0.000). (Table 13) Correlation between age, PVD, HAD, liver, and caudate lobe measurements in control group shows that there was significant positive correlation between age, liver and caudate lobe size (r= 0.272, 0.293 respectively at p value 0.000), also there was significant negative correlation between PVD and HAD (r= -0.275 at p value 0.000). (Figures 7 & 8) scatter plot shows inverse very weak relationship between hepatic artery diameter and portal vein diameter which the portal vein (R² = 0.0808), also there was weak linear relationship between portal vein diameter and caudate lobe (R² = 0.109) size while no relationship with liver size (R² = 0.009). (Tables 14 & 15) independent sample t-test to compares mean of the PVD, HAD, liver and caudate lobe size per cm between case and control group showed that there was statistically significant difference between patient and control groups in terms of PVD, HAD, liver and caudate lobe size. the compare of mean ± SD of PVD in patients (case group) was (1.154 ± 0.322 mm) were significantly smaller in the control group (1.240 ± 0.116 mm at p value = 0.052) with mean difference = 01987 at 95% Confidence Interval of the difference., while the compare of mean ± SD of HAD in patients (case group) was (0.355 ± 0.599 mm) with mean difference = 0.752 at 95% confidence interval of the difference., were significantly dilated in the control group (0.335 ± 0.109 mm) with p value = 0.021 with mean difference = 0.7526 at 95% Confidence Interval of the difference, as in Figures 9 & 10.
| Direction of PV flow | PVD\cm | HAD\cm | Liver ccl\cm | Caudate lobe \cm | |
|---|---|---|---|---|---|
| Hepatofugal/away | Mean | 1.5676 | 0.4511 | 10.0541 | 3.1108 |
| N | 37 | 37 | 37 | 37 | |
| Std. Deviation | 0.24159 | 0.10619 | 1.14785 | 0.32641 | |
| Hepatoportal | Mean | 1.1378 | 0.3504 | 14.8177 | 2.0913 |
| N | 113 | 113 | 113 | 113 | |
| Std. Deviation | 0.25895 | 0.05966 | 3.18723 | 0.51143 | |
| Total | Mean | 1.2438 | 0.3753 | 13.6427 | 2.3428 |
| N | 150 | 150 | 150 | 150 | |
| Std. Deviation | 0.31474 | 0.08541 | 3.49274 | 0.64559 | |
| P value = 0.000 |
Table 8: Compares mean measurement in different direction of portal vein flow in case group using independent sample t-test.
| Indication | PVD \cm | HAD\cm | Liver ccl\cm | Caudate lobe \cm | |
|---|---|---|---|---|---|
| Cirrhosis | Mean | 1.5214 | 0.4439 | 11.2857 | 2.9500 |
| N | 28 | 28 | 28 | 28 | |
| Std. Deviation | 0.26854 | 0.12188 | 1.64918 | 0.68123 | |
| Fatty | Mean | 1.0215 | 0.3409 | 17.2606 | 1.9424 |
| N | 33 | 33 | 33 | 33 | |
| Std. Deviation | 0.18946 | 0.06262 | 2.58879 | 0.43745 | |
| HCC & Mets | Mean | 0.9 | 0.4 | 11.5333 | 2.0333 |
| N | 3 | 3 | 3 | 3 | |
| Std. Deviation | 0.43589 | 0.06557 | 1.85831 | 0.25166 | |
| Hepatitis | Mean | 1.1666 | 0.35 | 13.9957 | 2.146 |
| N | 70 | 70 | 70 | 70 | |
| Std. Deviation | 0.24817 | 0.05429 | 2.92022 | 0.49654 | |
| Portal hypertension | Mean | 1.6188 | 0.4319 | 9.1563 | 3.025 |
| N | 16 | 16 | 16 | 16 | |
| Std. Deviation | 0.1223 | 0.07287 | 0.43661 | 0.1291 | |
| Total | Mean | 1.2438 | 0.3753 | 13.6427 | 2.3428 |
| N | 150 | 150 | 150 | 150 | |
| Std. Deviation | 0.31474 | 0.08541 | 3.49274 | 0.64559 | |
| P value = 0.000 |
Table 9: Compares mean measurement in different indication for ultrasound in case group using ANOVA test.
| Present of ascites | PVD\cm | HAD\cm | Liver ccl\cm | Caudate lobe \cm | |
|---|---|---|---|---|---|
| Massive ascites | Mean | 1.383 | 0.441 | 11 | 3.06 |
| N | 20 | 20 | 20 | 20 | |
| Std. Deviation | 0.3052 | 0.11991 | 2.09008 | 0.41977 | |
| Mild ascites | Mean | 1.2 | 0.3883 | 15.3333 | 2.4383 |
| N | 6 | 6 | 6 | 6 | |
| Std. Deviation | 0.34059 | 0.03656 | 3.86868 | 0.68412 | |
| Moderate ascites | Mean | 1.43 | 0.3832 | 12.5974 | 2.6837 |
| N | 38 | 38 | 38 | 38 | |
| Std. Deviation | 0.38006 | 0.07888 | 3.64569 | 0.53247 | |
| NO | Mean | 1.1322 | 0.3556 | 14.6012 | 2.0187 |
| N | 86 | 86 | 86 | 86 | |
| Std. Deviation | 0.22434 | 0.07306 | 3.23716 | 0.51027 | |
| Total | Mean | 1.2438 | 0.3753 | 13.6427 | 2.3428 |
| N | 150 | 150 | 150 | 150 | |
| Std. Deviation | 0.31474 | 0.08541 | 3.49274 | 0.64559 | |
| P value = 0.000 |
Table 10: Compares mean measurement in different degree of ascites in case group using ANOVA test.
| Correlations | PVD\ | HAD\ | Liver ccl\cm | Caudate lobe \cm | |
|---|---|---|---|---|---|
| cm | cm | ||||
| Age | Pearson Correlation | 0.007 | 0.105 | -.356** | 0.023 |
| Sig. (2-tailed) | 0.929 | 0.2 | 0 | 0.775 | |
| PVD\cm | Pearson Correlation | 1 | .222** | -.283** | .570** |
| Sig. (2-tailed) | 0.006 | 0 | 0 | ||
| HAD\ cm | Pearson Correlation | .222** | 1 | -.315** | .369** |
| Sig. (2-tailed) | 0.006 | 0 | 0 | ||
| Liver ccl\cm | Pearson Correlation | -.283** | -.315** | 1 | -.286** |
| Sig. (2-tailed) | 0 | 0 | 0 | ||
| Caudate lobe \cm | Pearson Correlation | .570** | .369** | -.286** | 1 |
| Sig. (2-tailed) | 0 | 0 | 0 | ||
| **. Correlation is significant at the 0.01 level (2-tailed). | |||||
| Correlations | PVD\ cm | HAD\cm | Liver ccl\cm | Caudate lobe \cm | |
| Age | Pearson Correlation | 0.154 | -0.022 | .272** | .293** |
| Sig. (2-tailed) | 0.061 | 0.791 | 0.001 | 0 | |
| PVD\cm | Pearson Correlation | 1 | -.275** | 0.049 | .260** |
| Sig. (2-tailed) | 0.001 | 0.552 | 0.001 | ||
| HAD\cm | Pearson Correlation | -.275** | 1 | 0.077 | -0.083 |
| Sig. (2-tailed) | 0.001 | 0.346 | 0.313 | ||
| Liver ccl\cm | Pearson Correlation | 0.049 | 0.077 | 1 | .597** |
| Sig. (2-tailed) | 0.552 | 0.346 | 0 | ||
| Caudate lobe \cm | Pearson Correlation | .260** | -0.083 | .597** | 1 |
| Sig. (2-tailed) | 0.001 | 0.313 | 0 |
Table 11: Correlation between age, portal vein diameter, hepatic artery diameter, liver, and caudate lobe measurements in case gro
- Table 14: Independent sample t-test to compares mean age, OVD, HAD, liver and caudate lobe size per cm between case and control group. (A. Mean). t df
- Sig.
- (2-tailed)
- Mean Difference
- Std. Error Difference
- Age
- -3.073
- 298
- 0.002
- -0.08593
- 0.02796
- -0.14097
- -0.0309
- -3.073
- 187
- 0.002
- -0.08593
- 0.02796
- -0.1411
- -0.03077
- PVD\cm
- 1.951
- 298
- 0.052
- 0.01987
- 0.01018
- -0.00017
- 0.03991
- 1.951
- 231.2
- 0.052
- 0.01987
- 0.01018
- -0.0002
- 0.03993
- HAD\cm
- -2.322
- 298
- 0.021
- -0.7526
- 0.32418
- -1.39
- -0.11462
- -2.322
- 227.7
- 0.021
- -0.7526
- 0.32418
- -1.3913
- -0.11382
- Liver ccl\cm
- 7.525
- 298
- 0
- 0.50487
- 0.06709
- 0.37284
- 0.63689
- 7.525
- 282.4
- 0
- 0.50487
- 0.06709
- 0.37281
- 0.63692
- Caudate lobe
- \cm
- -3.073
- 298
- 0.002
- -0.08593
- 0.02796
- -0.14097
- -0.0309
- -3.073
- 187
- 0.002
- -0.08593
- 0.02796
- -0.1411
- -0.03077
Table 12: t-test for compares means.
| Group Statistics | |||||
|---|---|---|---|---|---|
| group | N | Mean | Std. D | Std. Error Mean | |
| PVD\cm | Case group | 150 | 1.1548 | 0.32221 | 0.02631 |
| Control group | 150 | 1.2407 | 0.11614 | 0.00948 | |
| HAD\cm | Case group | 150 | 0.3558 | 0.05998 | 0.0049 |
| Control group | 150 | 0.3359 | 0.10934 | 0.00893 | |
| Liver ccl\cm | Case group | 150 | 13.6693 | 3.50152 | 0.2859 |
| Control group | 150 | 14.4219 | 1.87181 | 0.15283 | |
| Caudate lobe \cm | Case group | 150 | 2.3428 | 0.64559 | 0.05271 |
| Control group | 150 | 1.8379 | 0.50828 | 0.0415 |
Table 13: Correlation between age, portal vein diameter, hepatic artery diameter, liver, and caudate lobe measurements in case gro
- Table 14: Independent sample t-test to compares mean age, OVD, HAD, liver and caudate lobe size per cm between case and control group. (A. Mean). t df
- Sig.
- (2-tailed)
- Mean Difference
- Std. Error Difference
- Age
- -3.073
- 298
- 0.002
- -0.08593
- 0.02796
- -0.14097
- -0.0309
- -3.073
- 187
- 0.002
- -0.08593
- 0.02796
- -0.1411
- -0.03077
- PVD\cm
- 1.951
- 298
- 0.052
- 0.01987
- 0.01018
- -0.00017
- 0.03991
- 1.951
- 231.2
- 0.052
- 0.01987
- 0.01018
- -0.0002
- 0.03993
- HAD\cm
- -2.322
- 298
- 0.021
- -0.7526
- 0.32418
- -1.39
- -0.11462
- -2.322
- 227.7
- 0.021
- -0.7526
- 0.32418
- -1.3913
- -0.11382
- Liver ccl\cm
- 7.525
- 298
- 0
- 0.50487
- 0.06709
- 0.37284
- 0.63689
- 7.525
- 282.4
- 0
- 0.50487
- 0.06709
- 0.37281
- 0.63692
- Caudate lobe
- \cm
- -3.073
- 298
- 0.002
- -0.08593
- 0.02796
- -0.14097
- -0.0309
- -3.073
- 187
- 0.002
- -0.08593
- 0.02796
- -0.1411
- -0.03077
Table 12: t-test for compares means.
t-test for Equality of Means
95% Confidence Interval of the Difference
Lower Upper
Conclusions
This study is concerned with assessing the hepatic arterial buffer response in chronic liver disease comparing to control group by using ultrasound. The study compares the hepatic arterial buffer response in different chronic liver diseases and correlate with liver CCL, caudate lobe size, age and gender. Ultrasound scanning is noninvasive, informative, and cost-effective tools measuring compensatory liver mechanism for blood flow regulation. There is significance relation between Hepatic artery diameter and portal vein diameter. In liver cirrhosis portal vein dilate with Hepatofugal flow away from liver combined with dilated hepatic artery to compensate the liver supply. In case of fatty liver infiltration, the portal vein decrease diameter and flow associated with increase liver size and hepatic artery diameter to supply the liver. In liver tumor HCC the portal vein decrease diameter and flow associated with increase liver size and hepatic artery diameter. In hepatitis both portal vein and hepatic artery dilated to increase supply to the liver. As in cirrhosis in case of portal hypertension the portal vein dilated with reverse flow associated with compensatory dilated hepatic artery. The result was expected and goes with previous study. The ultrasound is a valuable noninvasive screening tool for patients with chronic liver diseases. Significant relation is found between the hepatic artery diameter and portal vein flow in healthy subjects compared with those with decrease PV flow or portal hypertension. Therefore, there is a need to combine the classical ultrasound appearance of disease with any HABR impairment and become as imaging protocol for a better assessment of these patients.
Recommendations
Measurement of portal vein diameter and hepatic artery diameter is important in ultrasound examination in order to early detecting of impairment of HABR, It can be helpful in early detection of portal hypertension as well as to have indigenous index for correlate that with body characteristic.
- Sonographer should be well trained in taking measurement accurately
- Taking into account the patient preparation before ultrasound get correct measurements.
- Observance the important of buffer response that affect in chronic liver disease.
- Further studies are recommended to correlate the portal vein diameter and hepatic artery diameter with liver size by using large sampling for accurate result.
Ethical Consideration
The researcher preservers all special data of the population of study and all the data written in data collecting sheets by their agreement no individual subject information should be out this study.
References
-
Aoki T, Imamura H, Kaneko J, Sakamoto Y, Matsuyama Y, et al. (2005) Intraoperative direct measurement of hepatic arterial buffer response in patients with or without cirrhosis. Liver Transplant 11(6): 684-691.
-
Cruz RJ, Ribeiro EA, Poli De Figueiredo LF, Cantos OR, Rocha E Silva M (2005) Hepatic arterial buffer response fails to restore hepatic oxygenation after temporary liver dearterialization in canines. Transplant Pro 37(10): 4560-4562.
-
Lautt WW (2007) Regulatory processes interacting to maintain hepatic blood flow constancy: Vascular compliance, hepatic arterial buffer response, hepatorenal reflex, liver regeneration, escape from vasoconstriction. Hepatol Res 37(11): 891-903.
-
Lautt WW (1980) Control of hepatic arterial blood flow: Independence from liver metabolic activity. Am J Physiol - Hear Circ Physiol 8(4).
-
Burton OR (1911) The Vascularity of the Liver. I. The Influence of the Portal Blood‐Flow of the Flow in the Hepatic Artery. Q J Exp Physiol 4(1): 93-102.
-
Randhir J, Chandrasekaran S, Sathiyasekaran M, Venkataraman J (2013) Hepatic Artery Doppler Indices in Children with Extra Hepatic Portal Vein Obstruction. J Clin Exp Hepatol 3(2): 102-105.
-
Eipel C, Abshagen K, Vollmar B (2010) Regulation of hepatic blood flow: The hepatic arterial buffer response revisited. World J Gastroenterol 16(48): 6046-6057.
-
Park HS, Desser TS, Jeffrey RB, Kamaya A (2017) Doppler ultrasound in liver cirrhosis: Correlation of hepatic artery and portal vein measurements with model for end-stage liver disease score. J Ultrasound Med 36(4): 725-730.
-
Balci A, Karazincir S, Sumbas H, Oter Y, Egilmez E, et al. (2008) Effects of diffuse fatty infiltration of the liver on portal vein flow hemodynamics. J Clin Ultrasound 36(3): 134-140.
-
Tanaka K, Mitsui K, Morimoto M, Numata K, Inoue S, et al. (1993) Increased hepatic arterial blood flow in acute viral hepatitis: Assessment by color doppler sonography. Hepatology 18(1): 21-27.
-
Richter S, Mücke I, Menger MD, Vollmar B (2000) Impact of intrinsic blood flow regulation in cirrhosis: Maintenance of hepatic arterial buffer response. Am J Physiol - Gastrointest Liver Physiol 279(2): 454-462.
-
Tadros T, Traber DL, Herndon DN (2000) Hepatic blood flow and oxygen consumption after burn and sepsis. J Trauma - Inj Infect Crit Care 49(1): 101-108.
-
Rumack CM, Wilson SR, Charboneau JW, Levine D (2011) Diagnostic Ultrasound. 4th (Edn.), Mosby Elsevier Philadelphia, 1: 648-650.
- Ultrasound Guided Therapeutic Nerve Blocks
- Cyclops Lesion Without ACL Reconstruction: A Rare Case in a Patient with Intact Anterior Cruciate Ligament and Tibial Plateau Fracture
- Dosimetric Comparison between Two Dose Calculation Algorithms in SBRT Treatment of Lung Cancer in Ring-based and C-arm Radiation Therapy Equipment
- Adolescent Testicular Adrenal Rest Tumors: A Case Report and Review of the Literature
- Giant Intrathoracic Lipoma: A Rare Presentation
- Image of a Right Renal Angiomyolipoma Complicated by Hemorrhage