Comparison between Computed and Displayed Average Glandular Dose in Hologic Dimensions Mammography System
Purpose: To investigate how the displayed average glandular dose (AGD) of Hologic 3Dimensions mammography systems compares to computed AGD, and how this comparison is modulated by breast thickness, and the assumptions in women breast glandularity. Methods: Using 2, 4, 6, and 8 centimeter (cm) of BR-12 (47% glandular / 53% adipose, CIRS, VA, USA), exposures were acquired using the Auto-Filter automatic exposure control (AEC) mode on 13 Hologic 3Dimensions mammography systems. Entrance exposures and half-value-layer (HVL) were measured using solid state detectors, and the displayed entrance skin dose (ESD), displayed AGD, and displayed exposure index (EI) were recorded. The AGD was first computed under the assumption of 50% glandular, 50% adipose tissue composition. It was then computed using the assumption of breast composition for the average woman aged 40-49 years old (100%, 65%, 35% and 14% glandularity for 2, 4-, 6- and 8-cm breast thickness, respectively). The AGD computed using these assumptions was compared to the displayed AGD. Results: Under the assumption of 50% glandularity, the deviation between displayed AGD and computed AGD is statistically significant at 2cm thickness in 2D mode, and at the thicknesses of 4, 6 and 8 cm in 3D mode (p<0.05). Using the assumption of glandularity based on the average woman aged 40-49 years old, the deviation between displayed AGD and computed AGD is statistically significant at the largest thickness of 6 and 8 cm in 2D mode; and also significant at thicknesses 2, 4, and 8 cm in 3D mode. Conclusion: While AGD may not estimate the patient breast’s dose accurately due to uncertainty in the amount and distribution of glandular tissues in the breast, AGD may be useful in the optimization of a mammographic procedure. The knowledge of the displayed AGD performance across different thicknesses may help in the optimizations.
Introduction
Breast cancer is the most common and frequent cancer among women and one of the two leading causes of death worldwide. According to the World Health Organization (WHO), more than 2.26 million new breast cancer cases were diagnosed and more than 685,000 deaths were reported worldwide in 2020. (https://www.who.int/news-room/fact- sheets/detail/cancer) Digital mammography, considered the gold-standard in breast imaging, provides critical information along with other imaging studies, e.g. breast ultrasound and breast MRI, in breast tumor diagnosis [1, 2, 3]. Implementation of mammographic screening programs has significantly increased the numbers of early detection cases, and improved the prognosis of breast cancer. Screening in many countries typically starts at ages as early as 40 years or even earlier depending on the patient’s medical history [4]. The average 5-year survival rate for patients with detected Stage I breast tumors has been reported to be more than 90%, compared to 20% for breast cancers detected in Stage IV [5, 6].
Breast glandular tissue is one of the most radiosensitive tissues in the body; hence dose to the breast should be kept reasonably low during recurring annual exposures. Screening protocols must meet stringent risks to benefits assessments to minimize concerns regarding radiation- induced carcinogenesis [7]. Dose to the breast is quantified using Average Glandular Dose (AGD) [8]. Modern digital mammographic systems display the AGD value after each image acquisition. Displayed AGD is used to monitor patient doses during mammographic examinations and also to evaluate and optimize screening protocols. Displayed AGD also serves as a good indicator to estimate potential risks from mammograms which is especially important for younger healthy populations [6, 9]. The computed AGD during annual physics equipment evaluations or following major repairs/ replacements on mammographic units is based on the guidelines provided by the Mammography Quality Standards Act of 1992 (MQSA) and the American College of Radiology (ACR) [10]. ACR requires computed AGD, for all screening studies, to be less than 3 mGy using a dedicated breast phantom of 4.2 cm thickness and composition equivalent to 50% glandular/50% adipose tissue (average breast density). This computed AGD represents dose under very specific conditions but does not reflect dose for various breast thicknesses and densities. Breast density has generally been considered to decrease with age and previous studies have reported an inverse linear relationship [10, 11, 12, 13]. A recent study looked at comparison between the system displayed AGD and the Patient specific AGD (psAGD) where the patients displayed AGD is modulated by the system calibration factor and an automated breast glandularity estimation [14].
The purpose of this study was to investigate how accurate the displayed AGD is with regard to computed AGD for various breast thicknesses and to elucidate how the comparison between the displayed and computed AGD is modulated by assumptions in breast composition for Hologic Dimensions Digital Breast Tomosynthesis (DBT) units. The study also investigated displayed AGD performance under the glandularity assumption of age 40-49. This age group has the highest percentage of breast glandularity of the population of women that may undergo mammography and therefore most radiosensitive [12].
Methods
Data was acquired from a total of 13 mammographic surveys on Hologic Dimensions Digital Breast Tomography systems. To calculate AGD, the Entrance Skin Exposure (ESE) was initially measured according to the procedures described in the following manufacturer’s QC manuals: Selenia QC Manual MAN-01476 Revision 001 (June 2009), Selenia Dimensions MAN-01965 Rev. 008 (July 2014), and Dimensions QC Manual MAN-03706 Revision 007 (March 2018). The procedures on measuring ESE and testing AEC remain unchanged among three manuals.
BR-12 blocks of various thicknesses were used as surrogates for different breast thicknesses (2, 4, 6 and 8 cm respectively). BR-12 blocks (47% glandular / 53% adipose) also simulate real breast tissue composition close to 50% glandular/50% adipose tissue [15]. The 18 x 24 cm screening compression paddle was used for all exposures and compression was applied until the displayed thickness matched the thickness of BR-12 blocks used. All exposures were performed using the following technique: Auto filter mode, large focal spot, density 0, and AEC position 2.
ESE measurements were acquired using a calibrated Raysafe X2 [Fluke Biomedical, Glenwood, IL] solid-state detector. The detector was positioned in the x-ray field beside the BR-12 blocks, centered 4 cm in from the chest-wall edge of the image receptor and taped right under the surface of the compression paddle. Digital 2D and tomosynthesis 3D images were acquired for each BR-12 thickness. The displayed AGD (in mGy) and ESD (in mGy), the EI, kV, mAs, and filter were recorded. In addition, ESE (in Roentgen) and HVL were also recorded after each exposure.
In the current study, AGD was computed using the simplified mathematical model described by Dance et al. for 2D and 3D imaging (Equation 1) [16, 17, 18].
D Kgcs = (1)
Where D represents AGD in mGy and 𝐾 is the incident air kerma (in mGy). Factor ‘𝑔 estimates the AGD for Breast composition equivalent to 50% glandular/50% adipose tissue, factor “𝑐” corrects dose for breast compositions deviating from average breast density, and “s” corrects for different target/filter combinations used.
For 3D tomosynthesis acquisitions, the equation is extended to angular dependence as shown in equation 2 below:
D KgcsT = (2)
Where T is the aggregate of the contribution of different projection angles to the computed AGD.
l l i T t α = ∑ (3)
The ‘g’ factors used for this study were interpolated from the data of ‘g’ as a function of breast thicknesses and HVL as reported by Dance, et al. [17]. Similarly, the ‘c’ factors used were interpolated from the plots of breast thickness and HVL as presented in Dance, et al. [17]. The T value used are 0.997, 0.996, 0.994, 0.993 for 20, 40, 60-mm and 80-mm thickness respectively and s value for various filter combinations were taken from Dance, et al. [17].
Statistical analysis was performed in Rstudio using the R programming language. To compare computed and displayed AGD for different BR-12 thicknesses and imaging modes (2D and 3D), t-test statistics was used, with p-values less than 0.05 considered statistically significant.
Results
Tables 1and 2 show the mean value ± SD of the displayed and computed AGD for various breast thicknesses and for the two assumptions regarding glandularity. Figures 1-4 shows the distribution of computed and displayed doses at various thicknesses in 2D and 3D mode. Figure 5 shows the distribution of displayed ESD and measured ESE. Box plots in the figures represent the median dose, 25th and 75th percentile in each case.
| Mode | Thickness (cm) | Computed AGD (mGy) | Displayed AGD (mGy) | P-value |
|---|---|---|---|---|
| 2D | 2 | 0.68 ± 0.05 | 0.61 ± 0.02 | 0.0005 |
| 4 | 1.09 ± 0.09 | 1.04 ± 0.03 | 0.05 | |
| 6 | 2.39 ± 0.17 | 2.38 ± 0.08 | 0.96 | |
| 8 | 3.78 ± 0.26 | 3.89 ± 0.14 | 0.2 | |
| 3D | 2 | 0.93 ± 0.08 | 0.93 ± 0.04 | 0.99 |
| 4 | 1.28 ± 0.10 | 1.36 ± 0.02 | 0.03 | |
| 6 | 2.06 ± 0.14 | 2.26 ± 0.04 | 0.003 | |
| 8 | 3.40 ± 0.28 | 3.77 ± 0.10 | 0.001 |
Table 1: Mean value ± SD of displayed and computed AGD for various BR-12 compressed thicknesses in 2D and 3D mode for 50% glandul
| Mode | Thickness (cm) | Computed AGD (mGy) | Displayed AGD (mGy) | P-value |
|---|---|---|---|---|
| 2D | 2 | 0.62 ± 0.04 | 0.61 ± 0.02 | 0.7 |
| 4 | 1.04 ± 0.09 | 1.04 ± 0.03 | 0.99 | |
| 6 | 2.55 ± 0.19 | 2.38 ± 0.08 | 0.008 | |
| 8 | 4.47 ± 0.33 | 3.89 ± 0.14 | 0.00002 | |
| 3D | 2 | 0.84 ± 0.08 | 0.93 ± 0.04 | 0.001 |
| 4 | 1.22 ± 0.10 | 1.36 ± 0.02 | 0.0002 | |
| 6 | 2.21 ± 0.15 | 2.26 ± 0.04 | 0.303 | |
| 8 | 3.99 ± 0.31 | 3.77 ± 0.10 | 0.034 |
Table 2: Mean value ± SD of displayed and computed AGD for various BR-12 compressed thicknesses in 2D and 3D mode for average bre
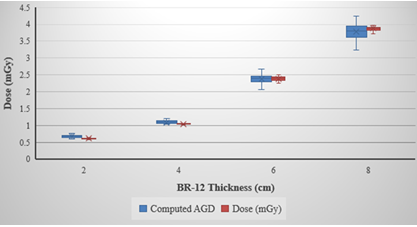
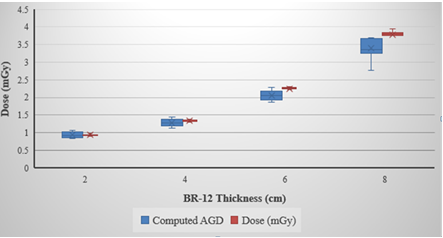
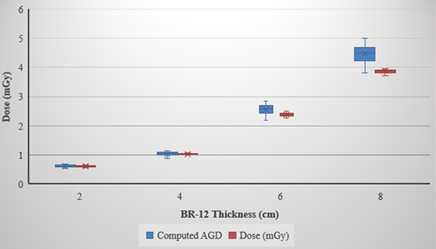
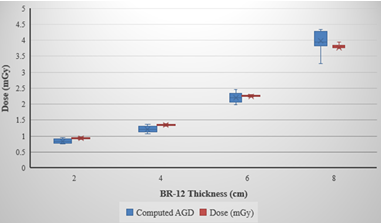
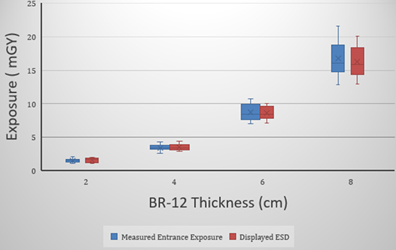
Table 3 shows a comparison between the displayed ESD and measured ESE over at different BR-12 thickness and in 2D and 3D mode. No statistically significant differences were observed between the displayed ESD and measured ESE across all thicknesses and in 2D and 3D mode.
| Mode | Thickness (cm) | Measured ESE (mGy) | Displayed ESD (mGy) | P-value |
|---|---|---|---|---|
| 2D | 2 | 1.24 ± 0.09 | 1.2 ± 0.04 | 0.46 |
| 4 | 3.16 ± 0.25 | 3.12 ± 0.11 | 0.6 | |
| 6 | 9.7 ± 0.7 | 9.6 ± 0.36 | 0.26 | |
| 8 | 18.85 ± 1.6 | 18.3 ± 0.76 | 0.08 | |
| 3D | 2 | 1.82 ± 0.16 | 1.93± 0.1 | 0.06 |
| 4 | 3.76 ± 0.26 | 3.95± 0.21 | 0.12 | |
| 6 | 7.71 ± 0.5 | 7.8 ± 0.24 | 0.61 | |
| 8 | 14.7 ± 0.89 | 14.3 ± 0.45 | 0.17 |
Table 3: Mean value ± SD of Displayed ESD and Measured ESE for various BR-12 compressed thicknesses in 2D and 3D. Statistical dif
Assumption 1: Breast Composition Equivalent to 50% Glandular/50% Adipose Tissue.
In 2D mode, computed AGD was significantly higher than displayed AGD at 2 cm thickness as shown in Table 1. Computed and displayed AGD was 0.68 ± 0.05 mGy and 0.61 ± 0.02 mGy at 2 cm respectively (p=0.0005). No other statistically significant difference was observed between displayed and computed doses for other breast thicknesses. In 3D mode, displayed AGD was significantly higher than computed AGD for 4, 6 and 8 cm. (Table 1). Difference between doses at 2 cm breast thickness was not statistically significant.
Assumption 2: Breast Composition Equivalent to Average Breast Density of 40-49 Year Old Women.
In 2D mode, displayed AGD was significantly lower than computed AGD at 6 and 8 cm thickness as shown in Table 2. Differences between doses were statistically insignificant for 2 and 4 cm breast thickness respectively. In 3D mode, displayed AGD was significantly higher than computed AGD for 2 and 4 cm. In addition, displayed AGD was lower than computed at 8 cm breast thickness (Table 2). Computed AGD was 3.99 ± 0.31 mGy compared to 3.77 ± 0.10 mGy for displayed AGD (p=0.034).
Discussion
For 2D Mode
Our results suggest the displayed AGD is underestimating computed breast dose at 2 cm (thinner breast) under 50/50 glandularity assumption with average percentage difference of 10% underestimation. Similarly, at 6 cm and 8 cm (larger breast), the displayed AGD is underestimating computed breast dose under the assumption of age 40-49 glandularity with average percentage difference of 13% and 7% respectively. There are no significant differences for other thicknesses and glandularity assumptions in 2D mode.
For 3D Mode
Our result suggests that the displayed AGD is overestimating computed dose at 4, 6 and 8 cm under 50/50 glandularity assumption with average percentage differences of 6%, 9.7% and 8.8% respectively. Similarly, at 2 and 4 cm thicknesses and under the assumption of age 40-49 glandularity assumption, the displayed AGD is overestimating computed dose by 10% and 11.5% respectively. However, at 8 cm thickness, displayed dose is underestimating computed dose by 5% under the assumption of age 40-49 glandularity.
One of the possible sources of errors in computation of AGDs is the entrance skin exposure measurements. Data presented in this study were collected by 4 physicists using 4 different dosimetry systems. Each dosimetry system was calibrated on time by a certified calibration lab with accuracy of the calibration within acceptance limits of the national standard. Some physicists in the group consider the pre- exposure when calculating the AGDs, however, this may not contribute significantly to the observed differences between displayed AGD and computed AGD. Figure 5 suggests that these variabilities of techniques may not significantly affect the result as our measured ESE agrees with the displayed ESD. While the exact algorithm used by vendor to estimate the AGD is proprietary, it can be assumed to include the use of the system displayed ESD.
Based on our discussion with a Hologic engineer, DBT systems estimate AGD in patient views and flat field views using the same algorithm. The AEC performance testing is done in flat view field; therefore, we believe that AEC evaluation QC is a good surrogate to evaluate the system displayed AGD under different conditions. A possible future improvement to this study is to use phantoms with various breast compositions. This may allow a more realistic comparison between displayed and computed AGD.
Conclusion
While it is true that the displayed AGD cannot currently be used to estimate the patient breast’s dose directly due to uncertainty in the amount and distribution of glandular tissues, the displayed AGD may be useful as an approximate metric of radiation dose that can be useful in the optimization of a mammographic procedure. It would be useful for clinicians to be conversant with conditions where the displayed AGD may be overestimating or underestimating the computed AGD.
Acknowledgements
The authors wish to thank Dr. Sean Rose for a very fruitful discussion. We are grateful to Dr. Tianliang Gu and Luong Thai for their technical assistance to this project.
References
-
(2010) Advances in breast imaging, although mammography remains standard for breast cancer screening, several newer technologies are helping to fine-tune diagnosis. Harv Womens Health Watch 17(9): 1-3.
-
Forrai G, Szabo E, Ormandi K, Ambrozay E, Pentek Z (2010) Imaging methods in the current diagnosis of and screening for breast cancer. Magy Onkol 54(3): 211-216.
-
Shamsi M, Pirayesh IJ (2017) Breast cancer: early diagnosis and effective treatment by drug delivery tracing. Nucl Med Rev Cent East Eur 20(1): 45-48.
-
Elezaby M, Lees B, Maturen KE, Barroilhet L, Wisinski KB, et al. (2019) BRCA Mutation Carriers: Breast and Ovarian Cancer Screening Guidelines and Imaging Considerations. Radiology 291(3): 554-569.
-
Santis C, Ma J, Bryan L, Jemal A (2014) Breast cancer statistics, 2013. CA Cancer J Clin 64(1): 52-62.
-
Grady OS, Morgan MP (2018) Microcalcifications in breast cancer: From pathophysiology to diagnosis and prognosis. Biochimica et Biophysica Acta (BBA) - Reviews on Cancer 1869(2): 310-320.
-
Hooshmand S, Reed WM, Suleiman ME, Brennan PC (2023) RRIMS: Radiation Risk In Mammography Screening - model evaluation. Br J Radiol 96(1152): 20230250.
-
Lekatou A, Metaxas V, Messaris G, Antzele P, Tzavellas G, et al. (2019) Institutional Breast Doses in Digital Mammography. Radiat Prot Dosimetry 185(2): 239-251.
-
Pasicz K, Fabiszewska E, Grabska I, Skrzynski W (2016) Mean glandular doses in mammography: a comparison of values displayed by a mammography unit with in- house values, both using the method proposed by Dance. J Radiol Prot 36(3): 709-715.
-
Oshiro T, Bassett LW (2018) An Overview of Digital Mammography Technology and MQSA Requirements. Oxford Medicine Online, pp: 48-62.
-
Checka CM, Chun JE, Schnabel FR, Lee J, Toth H (2012) The Relationship of Mammographic Density and Age: Implications for Breast Cancer Screening. American Journal of Roentgenology 198(3): W292-W295.
-
Kang YJ, Ahn SK, Kim SJ, Oh H, Han J, et al. (2019) Relationship between Mammographic Density and Age in the United Arab Emirates Population. J Oncol pp: 1-6.
-
Norhashimah MN, Justine GMS, Rathieswari R, Shantini A, Muhammad KAK (2023) Impact of age and breast thickness on mean glandular dose of standard digital mammography and digital breast tomosynthesis. Appl Radiat Isot 192: 110525.
-
Gisella G, Sofia B, Melissa LH, Roberto S (2020) Accuracy of mammography dosimetry in the era of the European Directive 2013/59/Euratom transposition. Eur J Radiol 127: 108986.
-
Argo WP, Hintenlang K, Hintenlang DE (2004) A tissue- equivalent phantom series for mammography dosimetry. J Appl Clin Med Phys 5(4): 112-119.
-
Dance DR, Young KC, Engen RE (2011) Estimation of mean glandular dose for breast tomosynthesis: factors for use with the UK, European and IAEA breast dosimetry protocols. Phys Med Biol 56(2): 453-471.
-
Dance DR, Skinner CL, Young KC, Beckett JR, Kotre CJ (2000) Additional factors for the estimation of mean glandular breast dose using the UK mammography dosimetry protocol. Phys Med Biol 45(11): 3225-3240.
-
Dance DR, Young KC, Engen RE (2009) Further factors for the estimation of mean glandular dose using the United Kingdom, European and IAEA breast dosimetry protocols. Phys Med Biol 54(14): 4361-4372.
- Ultrasound Guided Therapeutic Nerve Blocks
- Cyclops Lesion Without ACL Reconstruction: A Rare Case in a Patient with Intact Anterior Cruciate Ligament and Tibial Plateau Fracture
- Dosimetric Comparison between Two Dose Calculation Algorithms in SBRT Treatment of Lung Cancer in Ring-based and C-arm Radiation Therapy Equipment
- Adolescent Testicular Adrenal Rest Tumors: A Case Report and Review of the Literature
- Giant Intrathoracic Lipoma: A Rare Presentation
- Image of a Right Renal Angiomyolipoma Complicated by Hemorrhage