Comprehensive Effects of Different Chemical Preservatives On Dehydrated Diced Radish During Storage
This study aimed to the effect of chemical preservatives on dehydrated diced radish, as well as their effect on the taste, nutritional value and shelf life of the final product. Before dehydration turnip diced were treated with different chemical preservatives and their different concentrations viz. The eight samples were added T1 = 0.1% potassium metabisulphite, T2 = 0.1% sodium benzoate, T3 = 0.1% potassium sorbate, T4 = 0.05% potassium metabisulphite + 0.05% sodium benzoate, T5 = 0.05% potassium metabisulphite + 0.05% potassium sorbate, T6 = 0.05% sodium benzoate + 0.05% potassium sorbateT7 = 0.05% potassium metabisulphite + 0.025% sodium Benzoate + 0.025% potassium sorbate, T0 = no chemical preservative. Samples were evaluated for physiochemical (moisture, pH, total solid, titratable acidity, ash and ascorbic acid), sensory (color, texture, taste and overall acceptability) and total bacterial count at 15 days interval of 90 days storage. Moisture value was decreased during storage. Maximum decreased was found in T0 (8.65) 3.52% while minimum decrease was observed in T1 (9.23)1.40%. pH was decreased during storage. The maximum decrease was observed in T0 (5.44) 16.10%. While minimum decreased found in T1 (5.64) 6.36%. Titratable acidity value was increased during storage. Maximum increase was observed in T0 (1.96) 17.78% while minimum increase was observed in T1 (1.81) 8.05%. Total solid was increased during storage. Maximum increase was found in T0 (91.35) 0.34 % and lower limit was detected in T1 (90.77) 0.14%. Ash content was increased with storage interval. Maximum increased in T0 (6.57) 2.31% while minimum in T1 (6.08) 0.99%. Ascorbic acid was decreased during storage. Maximum decreased in T0 (6.15)80.48% while minimum in T1 (9.05) 37.79%. Color, Texture, Taste and Overall acceptability were decreased with storage interval. Color maximum score was found in T1 (7.70) while minimum score was found in T0 (3.97). Texture maximum score was found in T1 (8.06) and minimum score in T0 (2.97). Taste maximum score was found in T1 (7.56) while minimum was noticed in T0 (3.33). Maximum score of overall acceptability was found in T1 (7.77) while minimum score obtained by T0 (3.42). Total bacterial count was increased with storage interval. Maximum increased in T0 (24.43x10⁷) 800% while minimum increased in T1 (10.57x10⁷cfu/g) 375%. Both chemical preservatives and storage intervals resulted in highly significant (p < 0.000) differences for all parameters. When comparing the chemical preservatives, the best acceptability among all the treatments was obtained by T1 which was treated with 0.1% potassium metabisulphite.
Introduction
Brassica vegetables also contain significant levels of other health-promoting compounds, such as polyphenols, carotenoids, tocopherols, and vitamin C [1]. One of the first cultivated vegetables that has been used by human in nutrition is Turnip (Brassica rapa subsp. rapa.) since times immemorial [2]. The composition of raw turnip (65g ) consists of energy (18kcal), water (92%), dietary fiber (1g), carbohydrates (4g), protein (1g) and it comprises of mineral; calcium (20mg), potassium (124mg), magnesium (7mg), phosphorous (18mg), turnip have vitamin C (14mg), vitamin B6 (0.1mg) and folate (9µg). Turnip greens are described by a sulfurous whiff, pungent taste, and a vicious taste due to isothiocyanates, degradation products of glycosylates [3]. Brassica vegetables also contain significant levels of other health-promoting compounds, such as polyphenols, carotenoids, tocopherols, and vitamin C [1].
Several studies have shown the turnip in modified atmosphere packaging (MAP) were stored for 5 or 10 d, at 5°C or 10°C. Two passive and one active (flushed with 5% O2 at sealing) modified atmospheres were tested, Low temperature and short storage time were the most important criteria to prevent changes of appearance, odors, taste and flavors, and contents of sugar and glycosylates of fresh-cut swede and turnip[4].
One of the oldest methods used for preserving food is drying. Different methods can be used for drying purposes like solar drying, oven drying, and drying by using cabinet- type dryers. Before the biblical period; Chinese, Hindus, Persians, Greeks, and Egyptians used solar energy for drying the food. The benefit of dried food is that they do not require big space and refrigeration etc. A large variety of foods can be included in our diet by simply using the drying technique. It is a comparatively easy and less expensive preservation method but requires much more time, skills, and knowledge of drying principles [5].
Most of the vegetables are experience spoilage within two days perhaps due to chemical, physical and microbial activities. To prolong their shelf life, vegetables are chemically pretreated with the sodium salt of ethylene diamine tetra acetic acid (sodium EDTA), calcium chloride (CaCl2), citric acid and potassium metabisulphite (K2O5S2) dehydrated up to 30 percent moisture. Pretreatment using a combination of 1 mm EDTA, 2.5 percent K2O5S2, 0.5% citric acid, and 2.5% CaCl2 and dehydration of ash gourd sample to 30% moisture observed to be a good process in the preservation of cut ash gourd pieces.
The food though drying is preserved by removing water from it thus making an environment of the food unfavorable for the growth of microorganisms.
Materials and Methods
Materials and treatments
Materials
The fresh turnip was collected directly from the Peshawar vegetable market; the turnip was washed with tap water in order to remove dirt, dust and other foreign material.
Treatments: After washing the turnip was peeled and cut
into uniform pieces using stainless steel peeler and knife.
To prevent browning (oxidation) and cutting of turnip was
carried out in 1% citric acid solution. To control enzymatic
deterioration and improve the color and shape of turnip
dices, blanching was carried out in hot water for two minutes.
Different concentrations of potassium sorbate, sodium
benzoate, and potassium metabisulphite were used to treat
the turnips before drying. Before dehydration of turnip, it
was processed by different chemical preservatives as listed
$$ \begin{array}{l} \mathrm {b e l e w}. \\ \mathrm {T} _ {0} \\ \mathrm {T} = \\ \end{array} $$
Diced turnip + no chemical preservative.
T1 = Diced turnip + (0.1%) potassium metabisulphite. T2 =
Diced turnip + (0.1%) sodium benzoate.
T3 =
Diced turnip + (0.1%) potassium sorbate.
$$ \mathrm {T} _ {4} ^ {3} = \mathrm {Diced} \mathrm {tURNIP} + (0.05 \%) \mathrm {potassium} $$
metabisulphite + (0.05%) sodium benzoate.
$$ \mathrm {T} _ {5} = \mathrm {Diced} \mathrm {turnip} + (0.05 \%) \mathrm {potassium} $$
metabisulphite + (0.05%) potassium sorbate.
T6 =
Diced turnip + (0.05%) sodium benzoate +
(0.05%) potassium sorbate.
$$ \mathrm {T} _ {7} \quad \mathrm {Diced turnip} + [ 0.05 \% ] \mathrm {potassium} $$
metabisulphite + (0.025%) sodium benzoate + (0.025%)
potassium sorbate. 2Dehydration
Turnip was placed in the oven at 65℃ to dehydrate the
turnip dice for 24 hrs. The process was repeated until the
desired moisture content of 8-10% was obtained.
Packaging and storage: Diced turnip sample was packed in polyethylene bags and stored at ambient temperature for 90 days. Samples were evaluated for physiochemical (moisture, pH, total solids, titratable acidity, ash, and ascorbic acid), sensory (color, texture, taste, and overall acceptability), and total bacterial count at 15 days 90 days storage.
Physiochemical Analysis
Moisture Content: A.O.A.C. [6] oven drying method was used to measure the moisture content. Sample was placed at 60OC in oven until it dried and constant weight of sample was obtained. The moisture percentage was calculated by formula given beneath.
$$\text{Moisture \%} = \frac{W_1 - W_2}{\text{Weight of sample}} \times 100$$
Where $W_1$ was the weight of petri dish add sample after heated in oven, $W_2$ was the weight of empty petri dish.
Ascorbic Acid: Ascorbic acid solution (50mg) was taken in a flask and made 250 volumes of solution with oxalic acid were used as a blank. It was prepared 24 hrs. before use and kept in a cool dry place.
Dye Factor: The titration method was used to determine the ascorbic content of the sample as stated in A.O.A.C. Briefly, Sodium bicarbonate (42mg) and 2, 6-Dichlorophenol indophenol dye (50mg) was mixed with distilled water in a beaker. 250ml volume of solution was made, filtered, and stored in a cool dry place.
Two grams of oxalic acid were brought and mixed with distilled water. 500ml volume of solution was prepared for formulation of (0.4%) oxalic acid solution. 5ml solutions of standard ascorbic acid were added in a conical flask and standard dye solution were used to titrate it, unless until the pink light color was obtained for 15 seconds for Calibration of dye. The Dye Factor of the sample was expressed as scavenging rate%
Dye Factor
$$\text{Dye Factor} = \frac{\text{ln 6 ascorbic acid solution taken}}{\text{Volume 6 dye used}}$$
Ascorbic Acid: 10g oven dehydrated turnips were taken in a measuring beaker and added 0.4% oxalic acid solution till 100ml volume of solution was prepared and made slurry. The slurry of turnips (10ml) was added to a flask and it titrated with standard dye unless until pink light color was obtained for 15 seconds. The formula for calculating Ascorbic acid content
$$\text{Ascorbic acid (mg/100g)} = \frac{V \times F \times 100 \times 100}{D \times B}$$
Where $V$ was the ml of dye volume used, $D$ was the weight of sample selected for dilution, $B$ was the ml of sample volume selected for titration, $F$ was the Dye factor.
**Ash**
The ash content of the sample was concluded by A.O.A.C [6] method. A 2g well-mixed sample was taken in a cleaned and dried vessel (W1). It was first burnt with blower pipe and a partly burnt sample was put in a muffle furnace at 550°C until a constant weight was obtained along with vessel (W2). After heating the sample was turned into white ash. The ash content was measured by the following formula.
$$\text{%Ash} = \frac{W - W_1}{Wt \times 6 \text{ sample}} \times 100$$
Where $W_1$ was the empty crucible weight, $W_2$ was weight of ash add crucible.
**Titratable Acidity**
It was calculated by A.O.A. C’s [6] standard method.
Calibration of NaOH (0.1N) Solution: 1000ml solution was made by mixing 6.3g oxalic acid in distilled water. 1000ml solution of NaOH was made by mixing 4.5g NaOH in distilled water. The burette was filled with crudely 0.1N NaOH solution. 0.1N oxalic acid (10ml) was carried in the conical flask. 2-3 drops of the indicator were added to the flask. The 0.1N NaOH solution in the burette was allowed to titrate flask solution dropwise, unless until pink color is obtained. Three successive readings were taken from the burette. The normality of NaOH was determined by the formula given below.
$$N_1V_1 = N_2V_2$$
Where $V_1$ was the Vol. of oxalic acid, $N_1$ was the oxalic acid Normality, $V_2$ was the Vol. of NaOH, $N_2$ was the NaOH Normality.
Samples Titration: 10ml Turnip slurry was taken in a conical flask and 2-3 drops of phenolphthalein (indicator) were added. 0.1N NaOH solution was taken in a burette and titrated against turnip slurry. Three corresponding readings were taken and calculated the acidity with the help of the formula given below.
$$\text{Acidity \%} = \frac{0.0067 \times T \times 10 \times 100}{L \times M}$$
Where $T$ was the ml of NaOH used, $L$ was the sample taken for dilution; $M$ was the ml of diluted sample taken for titration
pH: The pH meter was used to measure the pH according to the standard method of A.O.A.C [6].
**Total solid**
The total solid content was calculated by the standard method of A.O.A.C. [6] A 20g sample of dehydrated turnip was placed in the dish and it was kept in the oven for 24 hours at 600C. After 24 hours it was allowed to cool in desiccators. Dished was weight along with dried weight. It was calculated by the following formula.
$$\text{Total solid (\%)} = \frac{K - Y}{Z - Y} \times 100$$
Where $X$ was the dry sample weight add dish weight, $Y$ was the dish weight, $Z$ was the fresh sample weight add dish weight.
Microbial count
General-purpose media (Nutrient Agar) was used in the dilution plate method to determent the total bacterial count of the sample as reported by Collins. Ten-fold serial dilutions of the sample were prepared. Six test tubes were taken and each filled with 9ml saline solution and labeled from 1-6 numbers. Then 1ml of the sample was added to the first test tube and mixed gently. Then 1ml sample was taken from 1st test tube and added to 2nd one. The process was repeated till the 6th test tube and 1ml from the last one was discarded. In each step of Ten-fold serial dilution, the sample was diluted by the number of six and we have shown it as 101 102, 103, 104, and so on. We poured a 50µl sample into pre-incubated plates of nutrient agar from test tubes with the help of a micropipette. Plates were incubated in an incubator for 24 hours at 27-30oC. After incubation plate was selected with approximately 300-500 Cru and calculated the bacterial colonies were with help of the colony counter.
Cru/g = dilution factor × spread volume factor × no. of colonies
Sensory evaluation
Sensory quality of Taste, color, texture, and overall acceptability of dehydrated turnip sample was accomplished by trained person panel through using 9 points hedonic scale of Lamond.
Statistical Analysis
All Data were analyzed statistically by using 2 factorial (without any interaction) complete randomized designs (CRD) through using computer M-Stat-C program and LSD were used to separate their means as described by Steel and Torrie [7].
Results and Discussion
Physio-chemical analysis
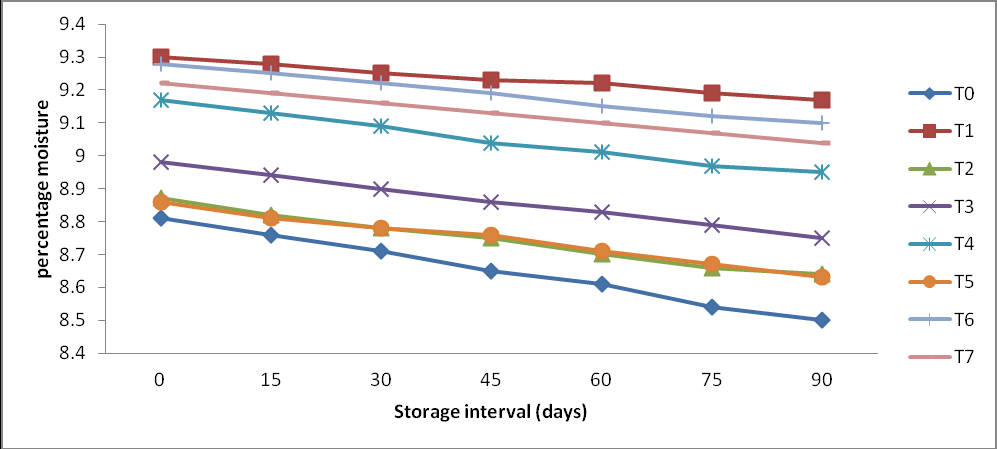
Moisture Content: The dehydrated diced turnip was treated with different chemical preservatives and analyzed for moisture during 90 days storage at 15 days intervals. The result relating to the response of storage interval and the effect of different chemical preservatives on the moisture of dehydrated diced turnip is shown in Table 1 and Figure 1.
The result indicated that the value of moisture content was decreased by storage interval. The minimum decrease was observed in T1 (9.3 to 9.17) 1.40% and the maximum decrease was detected in T0 (8.81 to 8.85) 3.52%. The upper limit of the mean value obtained in T1 (9.23%) and lower limit mean value was found in T0 (8.65%).
Similarly, these findings are in close conformity with the finding of Chaudhary, et al. [8], who reported that during storage a decrease in moisture content was noticed in packed solar-dried persimmon.
| Tart. | Storage intervals | Mean | % Dec. | ||||||
|---|---|---|---|---|---|---|---|---|---|
| Initial | 15 | 30 | 45 | 60 | 75 | 90 | |||
| T 0 | 8.81 | 8.76 | 8.71 | 8.65 | 8.61 | 8.54 | 8.5 | 8.65g | 3.52 |
| T 1 | 9.3 | 9.28 | 9.25 | 9.23 | 9.22 | 9.19 | 9.17 | 9.23a | 1.40 |
| T 2 | 8.87 | 8.82 | 8.78 | 8.75 | 8.7 | 8.66 | 8.64 | 8.75f | 2.59 |
| T 3 | 8.98 | 8.94 | 8.9 | 8.86 | 8.83 | 8.79 | 8.75 | 8.86e | 2.56 |
| T 4 | 9.17 | 9.13 | 9.09 | 9.04 | 9.01 | 8.97 | 8.95 | 9.05d | 2.40 |
| T 5 | 8.86 | 8.81 | 8.78 | 8.76 | 8.71 | 8.67 | 8.63 | 8.75f | 2.60 |
| T 6 | 9.28 | 9.25 | 9.22 | 9.19 | 9.15 | 9.12 | 9.1 | 9.19b | 1.94 |
| T 7 | 9.22 | 9.19 | 9.16 | 9.13 | 9.1 | 9.07 | 9.04 | 9.13c | 1.95 |
| Means | 9.07a | 9.03b | 8.99c | 8.96d | 8.92e | 8.88f | 8.85g |
Table 1: Chemical preservatives effects on moisture content of dehydrated diced turnip.
Statistical analysis (Appendix-I) shows that the moisture content results of the different treatments were highly significant (P<0.05). Results regarding the storage period of dehydrated diced turnip at different intervals were also highly significant (P<0.05).
pH: The dehydrated diced turnips were treated with different chemical preservatives (sodium benzoate, potassium metabisulphite, and potassium sorbate) and their different concentrations were analyzed for pH during the 90 days storage period at each 15 days interval. The result concerning pH is shown in Table 2 and also graphically in Figure 2.
Results showed that pH value was decreased with storage interval. The maximum decrease occurred in T0 (5.84 to 4.9) while the minimum decrease was found in T1 (5.82 to 5.45). The minimum mean value was obtained by T0 (5.44) and the maximum mean value was recorded in T1 which was (5.64). These results are partially supported by the work of Akhtar and Jived [9] and reported a significant decrease in pH during the storage study of apple slices.
| Tart. | Storage intervals | Mean | % Dec. | ||||||
|---|---|---|---|---|---|---|---|---|---|
| Initial | 15 | 30 | 45 | 60 | 75 | 90 | |||
| T 0 | 5.84 | 5.74 | 5.65 | 5.42 | 5.35 | 5.2 | 4.9 | 5.44e | 16.10 |
| T 1 | 5.82 | 5.78 | 5.71 | 5.65 | 5.57 | 5.49 | 5.45 | 5.64a | 6.36 |
| T 2 | 5.85 | 5.6 | 5.55 | 5.48 | 5.39 | 5.31 | 5.13 | 5.47de | 12.31 |
| T 3 | 5.86 | 5.68 | 5.59 | 5.5 | 5.45 | 5.36 | 5.15 | 5.51cd | 12.12 |
| T 4 | 5.87 | 5.71 | 5.63 | 5.57 | 5.53 | 5.4 | 5.2 | 5.56bc | 11.41 |
| T 5 | 5.83 | 5.62 | 5.5 | 5.44 | 5.38 | 5.3 | 5.05 | 5.45e | 13.38 |
| T 6 | 5.9 | 5.76 | 5.7 | 5.62 | 5.54 | 5.45 | 5.32 | 5.61ab | 9.83 |
| T 7 | 5.89 | 5.74 | 5.68 | 5.59 | 5.5 | 5.42 | 5.25 | 5.58ab | 10.87 |
| Means | 5.86a | 5.70b | 5.63c | 5.53d | 5.46e | 5.37f | 5.18g |
Table 2: Different chemical preservatives effects on pH of dehydrated diced turnip.
Results of pH of dehydrated diced turnip showed a highly significant difference (P<0.05) in different treatment and storage periods (Appendix II).
![Figure 2: Results showed that pH value was decreased with storage interval. The maximum decrease occurred in T0 (5.84 to 4.9) while the minimum decrease was found in T1 (5.82 to 5.45). The minimum mean value was obtained by T0 (5.44) and the maximum mean value was recorded in T1 which was (5.64). These results are partially supported by the work of Akhtar and Jived [9] and reported a significant decrease in pH during the storage study of apple slices.](/fulltextimages/8865/fig_2.png)
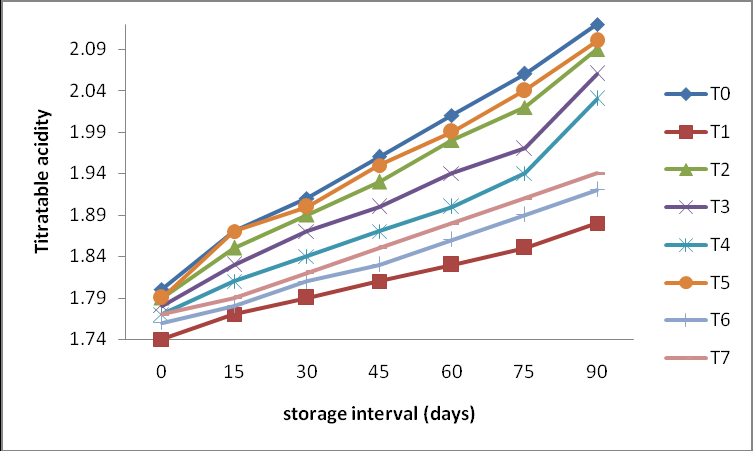
Titratable acidity: Dehydrated diced turnips which were treated with different chemical preservatives and their different concentrations were analyzed for titratable acidity at each 15 days interval during the 90 days storage periods. Results data concerning titratable acidity of dehydrated diced turnip samples are presented in Table and Figure 3.
Results pointed that titratable acidity was increased in all samples during 3-month storage period. The maximum increase was occurring in T0 (1.8 to 2.12) at 17.78% while the minimum increase was occurring in T1 (1.74 to 1.88) at 8.05%. During 3-month storage of dehydrated diced turnip, the highest mean value was obtained by T0 (1.96) while the lowest mean value was obtained by T1 (1.81).
| Tart. | Storage intervals | Mean | % Inc. | ||||||
|---|---|---|---|---|---|---|---|---|---|
| Initial | 15 | 30 | 45 | 60 | 75 | 90 | |||
| T 0 | 1.8 | 1.87 | 1.91 | 1.96 | 2.01 | 2.06 | 2.12 | 1.96a | 17.78 |
| T 1 | 1.74 | 1.77 | 1.79 | 1.81 | 1.83 | 1.85 | 1.88 | 1.81d | 8.05 |
| T 2 | 1.79 | 1.85 | 1.89 | 1.93 | 1.98 | 2.02 | 2.09 | 1.94a | 16.76 |
| T 3 | 1.78 | 1.83 | 1.87 | 1.9 | 1.94 | 1.97 | 2.06 | 1.91b | 15.73 |
| T 4 | 1.77 | 1.81 | 1.84 | 1.87 | 1.9 | 1.94 | 2.03 | 1.88b | 14.69 |
| T 5 | 1.79 | 1.87 | 1.9 | 1.95 | 1.99 | 2.04 | 2.1 | 1.95a | 17.32 |
| T 6 | 1.76 | 1.78 | 1.81 | 1.83 | 1.86 | 1.89 | 1.92 | 1.84cd | 9.09 |
| T 7 | 1.77 | 1.79 | 1.82 | 1.85 | 1.88 | 1.91 | 1.94 | 1.85c | 9.60 |
| Means | 1.78g | 1.82f | 1.85e | 1.89d | 1.92c | 1.96b | 2.02a |
Table 3: Different chemical preservatives effects on titratable Acidity of dehydrated diced turnip.
Statistical analysis (Appendix-III) shows that the titratable acidity results of the different treatments were highly significant (P < 0.000). Results regarding storage period of dehydrated diced turnip at different intervals were also highly significant (P < 0.000).
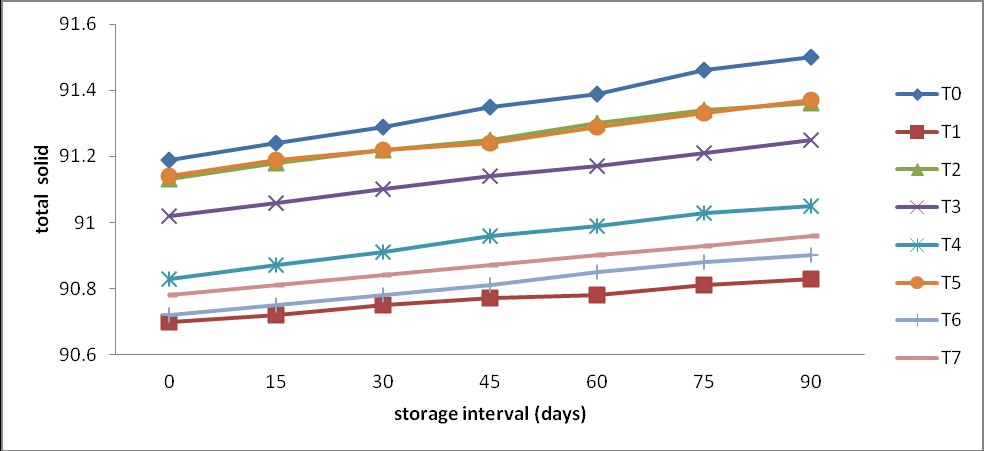
Total Solid: During the three months of the storage period, dehydrated diced turnips which were treated with different chemical preservatives were examined for total solid content at each 15 days interval. Results related to storage interval and chemical preservatives of dehydrated diced turnip are demonstrated in Table 4 and Figure 4.
The result indicated that the total solid value was increased during the storage period. The maximum increase was found in T0 (91.19 to 91.5%) 0.34% and the minimum increase were found in T1 (90.7 to 90.83%) 0.14%. The highest mean value was observed in T0 which was 91.35% and the lowest mean value was found in T1 which was 90.77%.
| Tart. | Storage intervals | Mean | % Inc | ||||||
|---|---|---|---|---|---|---|---|---|---|
| Initial | 15 | 30 | 45 | 60 | 75 | 90 | |||
| T 0 | 91.19 | 91.24 | 91.29 | 91.35 | 91.39 | 91.46 | 91.5 | 91.35a | 0.34 |
| T 1 | 90.7 | 90.72 | 90.75 | 90.77 | 90.78 | 90.81 | 90.83 | 90.77g | 0.14 |
| T 2 | 91.13 | 91.18 | 91.22 | 91.25 | 91.3 | 91.34 | 91.36 | 91.25b | 0.25 |
| T 3 | 91.02 | 91.06 | 91.1 | 91.14 | 91.17 | 91.21 | 91.25 | 91.14c | 0.25 |
| T 4 | 90.83 | 90.87 | 90.91 | 90.96 | 90.99 | 91.03 | 91.05 | 90.95d | 0.24 |
| T 5 | 91.14 | 91.19 | 91.22 | 91.24 | 91.29 | 91.33 | 91.37 | 91.25b | 0.25 |
| T 6 | 90.72 | 90.75 | 90.78 | 90.81 | 90.85 | 90.88 | 90.9 | 90.81f | 0.20 |
| T 7 | 90.78 | 90.81 | 90.84 | 90.87 | 90.9 | 90.93 | 90.96 | 90.87e | 0.20 |
| Means | 90.94g | 90.98f | 91.01e | 91.05d | 91.08c | 91.12b | 91.15a |
Table 4: Different chemical preservatives effects on total solid of dehydrated diced turnip.
Statistical analysis (Appendix-IV) shows that the total solid results of the different treatments were highly significant (P<0.000). Results regarding storage period of dehydrated diced turnip at different intervals were also highly significant (P<0.000).
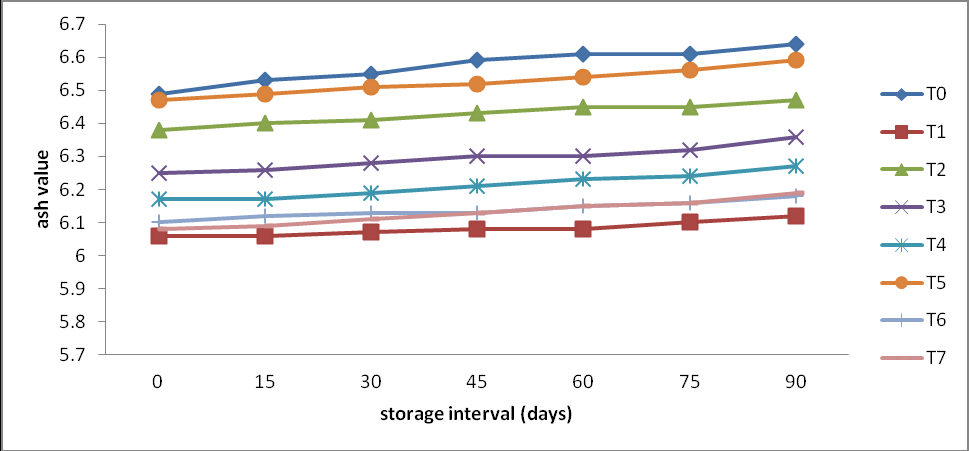
Ash: The diced dehydrated turnips treated with different chemical preservatives were analyzed for ash content at each 15 days interval during three months of storage. Results considering the different chemical preservatives effect and storage interval of ash content of dehydrated diced turnip are presented in Table 5 and Figure 5.
The result showed that the value of ash was increased with storage interval. The maximum increased occurs in T0 (6.49 to 6.64) 2.31% while the minimum increase occurs in T1 (6.06 to 6.12) 0.99%. Among all the dehydrated diced turnip treatments the maximum mean value was noticed in T0 (6.57%) and the lowest mean value found in T1 (6.08%).
The results obtained from this study were closely in agreement with Sounded and Rheba, they reported that during the six-month storage of Yam (Dioscuri spa) ash content slightly increased while moisture content was reduced.
Similarly, these results are a partial agreement to the Melda, et al. They reported during sun drying moisture content is decreased while increased protein, lipids, crude fiber, and total ash in leafy vegetables.
| Tart. | Storage intervals | Mean | % Inc. | ||||||
|---|---|---|---|---|---|---|---|---|---|
| Initial | 15 | 30 | 45 | 60 | 75 | 90 | |||
| T 0 | 6.49 | 6.53 | 6.55 | 6.59 | 6.61 | 6.61 | 6.64 | 6.57a | 2.31 |
| T 1 | 6.06 | 6.06 | 6.07 | 6.08 | 6.08 | 6.1 | 6.12 | 6.08g | 0.99 |
| T 2 | 6.38 | 6.4 | 6.41 | 6.43 | 6.45 | 6.45 | 6.47 | 6.43c | 1.41 |
| T 3 | 6.25 | 6.26 | 6.28 | 6.3 | 6.3 | 6.32 | 6.36 | 6.30d | 1.76 |
| T 4 | 6.17 | 6.17 | 6.19 | 6.21 | 6.23 | 6.24 | 6.27 | 6.21e | 1.62 |
| T 5 | 6.47 | 6.49 | 6.51 | 6.52 | 6.54 | 6.56 | 6.59 | 6.53b | 1.85 |
| T 6 | 6.10 | 6.12 | 6.13 | 6.13 | 6.15 | 6.16 | 6.18 | 6.14f | 1.31 |
| T 7 | 6.08 | 6.09 | 6.11 | 6.13 | 6.15 | 6.16 | 6.19 | 6.13f | 1.81 |
| Means | 6.25f | 6.27e | 6.28d | 6.30c | 6.31b | 6.33b | 6.35a |
Table 5: Different chemical preservatives effects on ash of dehydrated diced turnip.
Statistical analysis (Appendix-V) shows that the ash results of the different treatments were highly significant (P<0.05). Results regarding storage period of dehydrated diced turnip at different intervals were also highly significant (P<0.05).
Ascorbic Acid
The dehydrated diced turnip treated with different chemical preservatives and their different concentrations were analyzed for ascorbic acid content during three-month storage at each 15 days storage interval is shown in Table 6 and Figure 6.
The result showed ascorbic acid value was decreased during three-month storage. Maximum decrease was found in T0 (10.5 to 2.05%) 80.48% while the minimum decrease was found in T1 (11.3 to 7.03%) 37.79%. The minimum mean value was found in T0 (6.15) while the maximum mean value was found in T1 (9.05). These results are partially supported by the work of Negi and Roy [10]. They reported that blanching, drying, and storage period reduced ascorbic acid content in carrot products. Similarly, Chawla, et al. [11] reported that ascorbic acid decreased in the dehydrated product may be due to light, temperature and oxidation occurred during storage.
| Tart. | Storage intervals | Mean | % Dec. | ||||||
|---|---|---|---|---|---|---|---|---|---|
| Initial | 15 | 30 | 45 | 60 | 75 | 90 | |||
| T 0 | 10.5 | 8.9 | 6.8 | 6 | 5.35 | 3.45 | 2.05 | 6.15f | 80.48 |
| T 1 | 11.3 | 10.41 | 9.71 | 9.01 | 8.3 | 7.6 | 7.03 | 9.05a | 37.79 |
| T 2 | 10.2 | 9 | 7.4 | 6.8 | 6 | 5.2 | 4 | 6.94de | 60.78 |
| T 3 | 10.3 | 9.4 | 7.7 | 7.2 | 6.4 | 5.6 | 4.8 | 7.34cd | 53.40 |
| T 4 | 10.6 | 9.8 | 8.1 | 7.9 | 7.1 | 6.2 | 5.1 | 7.83bc | 51.89 |
| T 5 | 10.1 | 9 | 7.1 | 6.5 | 5.8 | 5 | 3.99 | 6.78e | 60.50 |
| T 6 | 11.5 | 10.65 | 9.25 | 8.98 | 8.27 | 7.57 | 7 | 9.03a | 39.13 |
| T 7 | 10.9 | 10 | 8.5 | 8.22 | 7.42 | 6.72 | 6.15 | 8.27b | 43.58 |
| Means | 10.68a | 9.65b | 8.07c | 7.58d | 6.83e | 5.92f | 5.02g |
Table 6: Different chemical preservatives effects on ascorbic acid of dehydrated diced turnip.
Statistical analysis (Appendix-VI) shows that the ascorbic acid results of the different treatments were highly significant (P<0.05). Results regarding the storage period of dehydrated diced turnip at different intervals were also highly significant (P<0.05).
![Figure 6: The result showed ascorbic acid value was decreased during three-month storage. Maximum decrease was found in T0 (10.5 to 2.05%) 80.48% while the minimum decrease was found in T1 (11.3 to 7.03%) 37.79%. The minimum mean value was found in T0 (6.15) while the maximum mean value was found in T1 (9.05). These results are partially supported by the work of Negi and Roy [10]. They reported that blanching, drying, and storage period reduced ascorbic acid content in carrot products. Similarly, Chawla, et al. [11] reported that ascorbic acid decreased in the dehydrated product may be due to light, temperature and oxidation occurred during storage.](/fulltextimages/8865/fig_6.png)
Sensory evaluation
Sensory evaluation of dehydrated diced turnips was evaluated for color, texture, taste and overall, all acceptability. Dehydrated samples were demonstrated to 10 well trained food science panelist and the judges had previous experience of foods. The color, taste, texture and overall acceptability of dehydrated diced turnip samples were evaluated at each 15 days interval of 90 days storage. They were called for rank all the samples by using 9-point hedonic scale in which 1disliked extremely and 9 liked extremely. Color: All the dehydrated diced turnips samples were treated with different chemical preservatives (sodium benzoate, potassium metabisulphite, and potassium sorbate) and their different concentrations were analyzed for color for each storage interval of three-month storage presented in Table 7 and Figure 7.
Color quality was decreased during three-month storage period of dehydrated diced turnip. The maximum decrease of color quality has occurred in T0 (6.2 to 3) 51.61%. While minimum decreases were found in T1 (8.6 to 7.0) 18.60%. The maximum mean score was noticed in treatment T`1 which was 7.70. While treatment T0 (3.97) was obtained minimum mean score. These results are partially agreement to Sani et al. [12]. They reported that potassium metabisulphite helps to reduce browning in fruit pulp and they concluded from research, during storage the reduction of color might be due to milord reaction.
| Tart. | Storage intervals | Mean | %Dec. | ||||||
|---|---|---|---|---|---|---|---|---|---|
| Initial | 15 | 30 | 45 | 60 | 75 | 90 | |||
| T 0 | 6.2 | 4.2 | 4 | 3.8 | 3.4 | 3.2 | 3 | 3.97f | 51.61 |
| T 1 | 8.6 | 8.2 | 7.9 | 7.6 | 7.4 | 7.2 | 7 | 7.70a | 18.60 |
| T 2 | 7 | 6.3 | 5.9 | 5.6 | 4.4 | 4 | 3.7 | 5.27df | 47.14 |
| T 3 | 7.2 | 6 | 5.6 | 5.2 | 4.9 | 4.6 | 4.2 | 5.39d | 41.67 |
| T 4 | 7.4 | 7 | 6.8 | 6.6 | 6.3 | 6 | 5.8 | 6.56c | 21.62 |
| T 5 | 6.4 | 5.8 | 5.4 | 5 | 4.4 | 3.9 | 3.6 | 4.93e | 43.75 |
| T 6 | 8 | 7.6 | 7.2 | 7 | 6.8 | 6.6 | 6.4 | 7.09b | 20.00 |
| T 7 | 7.8 | 7.4 | 7.1 | 6.8 | 6.6 | 6.3 | 6 | 6.86bc | 23.08 |
| Means | 7.33a | 6.56b | 6.24bc | 5.95c | 5.53d | 5.23de | 4.96e |
Table 7: Different chemical preservatives effects on color of dehydrated diced turnip.
Statistical analysis (Appendix-VII) shows that results regarding to color of the different treatments of dehydrated turnip were highly significant (P<0.05). Results regarding storage period of dehydrated diced turnip at different intervals were also highly significant (P<0.05).
![Figure 7: Color quality was decreased during three-month storage period of dehydrated diced turnip. The maximum decrease of color quality has occurred in T0 (6.2 to 3) 51.61%. While minimum decreases were found in T1 (8.6 to 7.0) 18.60%. The maximum mean score was noticed in treatment T`1 which was 7.70. While treatment T0 (3.97) was obtained minimum mean score. These results are partially agreement to Sani et al. [12]. They reported that potassium metabisulphite helps to reduce browning in fruit pulp and they concluded from research, during storage the reduction of color might be due to milord reaction.](/fulltextimages/8865/fig_7.png)
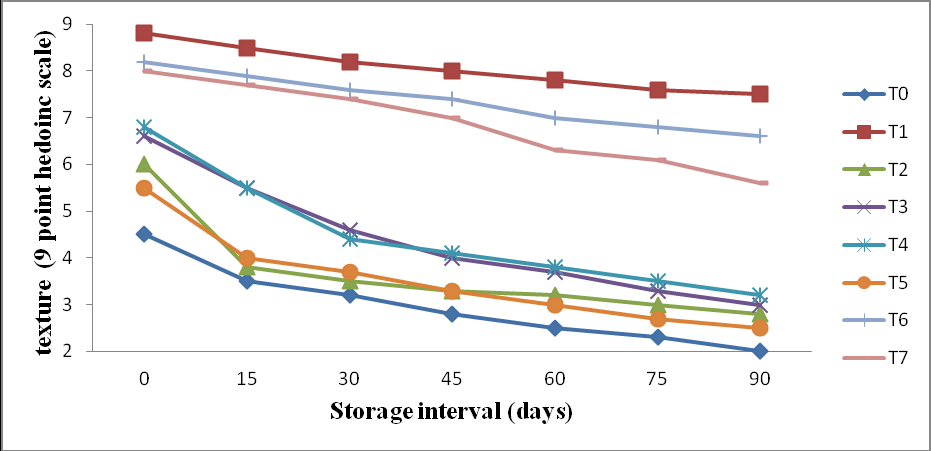
Texture: Dehydrated diced turnips treated with different chemical preservatives of different ratio were analyzed for sensory evaluation of texture during three-month storage of each 15 days interval. Data regarding to texture is shown in Table 8 and Figure 8.
Textures quality of dehydrated diced turnip was decreased during 90 days storage. The maximum decreased was found in treatment T0 (4.5 to 2) 55.56 % while minimum decreased was found in T1 (8.8 to 7.5) 14.77%. The highest mean score was found in T1 (8.06) while lowest mean score found in T0 (2.97).
| T art. | Storage intervals | Mean | %Dec. | ||||||
|---|---|---|---|---|---|---|---|---|---|
| Initial | 15 | 30 | 45 | 60 | 75 | 90 | |||
| T 0 | 4.5 | 3.5 | 3.2 | 2.8 | 2.5 | 2.3 | 2 | 2.97f | 55.56 |
| T 1 | 8.8 | 8.5 | 8.2 | 8 | 7.8 | 7.6 | 7.5 | 8.06a | 14.77 |
| T 2 | 6 | 3.8 | 3.5 | 3.3 | 3.2 | 3 | 2.8 | 3.66e | 53.33 |
| T 3 | 6.6 | 5.5 | 4.6 | 4 | 3.7 | 3.3 | 3 | 4.39d | 54.55 |
| T 4 | 6.8 | 5.5 | 4.4 | 4.1 | 3.8 | 3.5 | 3.2 | 4.47d | 52.94 |
| T 5 | 5.5 | 4 | 3.7 | 3.3 | 3 | 2.7 | 2.5 | 3.53e | 54.55 |
| T 6 | 8.2 | 7.9 | 7.6 | 7.4 | 7 | 6.8 | 6.6 | 7.36b | 19.51 |
| T 7 | 8 | 7.7 | 7.4 | 7 | 6.3 | 6.1 | 5.6 | 6.87c | 30.00 |
| Means | 6.80a | 5.80b | 5.33c | 4.99cd | 4.66de | 4.41ef | 4.15f |
Table 8: Different chemical preservatives effects on texture of dehydrated diced turnip.
Statistical analysis (Appendix-VIII) shows that results regarding the texture of the different treatments of dehydrated turnip were highly significant (P<0.05). Results regarding the storage period of dehydrated diced turnip at different intervals were also highly significant (P<0.05).
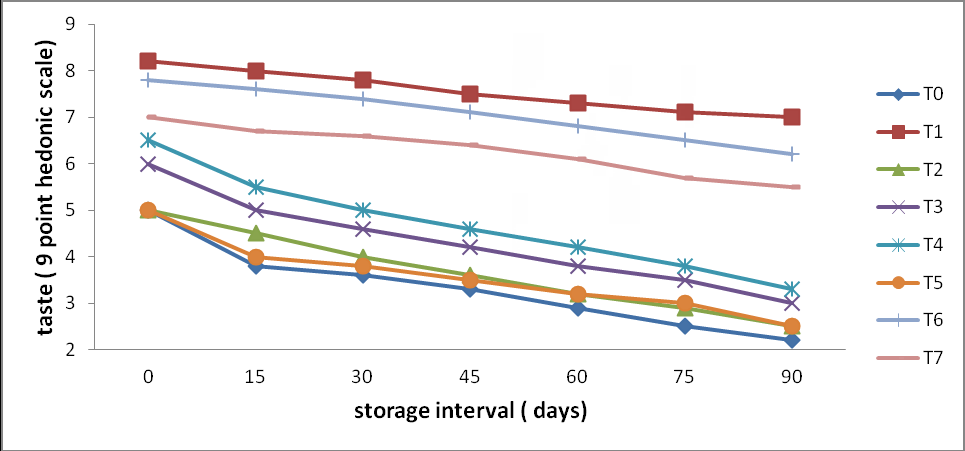
Taste: Dehydrated diced turnips were treated to different chemical preservatives ratio and stored it in polythene bags for 90 days. The result regarding the sensory evaluation of taste through 9 points hedonic scale is shown in Figure 9 and also in Table 9.
The result showed that the taste of dehydrated diced turnip decreased during 90 days of storage. The maximum decrease in score rate was occurred in T0 (5 to 2.2) 56% and while the minimum decrease occurred in T1 (8.2 to 7) 14.63%. From all the treatment the maximum mean score obtained by T1 which was (7.56). And minimum mean score was obtained by T0 (3.33).
| Tart. | Storage intervals | Mean | %Dec. | ||||||
|---|---|---|---|---|---|---|---|---|---|
| Initial | 15 | 30 | 45 | 60 | 75 | 90 | |||
| T 0 | 5 | 3.8 | 3.6 | 3.3 | 2.9 | 2.5 | 2.2 | 3.33g | 56.00 |
| T 1 | 8.2 | 8 | 7.8 | 7.5 | 7.3 | 7.1 | 7 | 7.56a | 14.63 |
| T 2 | 5 | 4.5 | 4 | 3.6 | 3.2 | 2.9 | 2.5 | 3.67f | 50.00 |
| T 3 | 6 | 5 | 4.6 | 4.2 | 3.8 | 3.5 | 3 | 4.30e | 50.00 |
| T 4 | 6.5 | 5.5 | 5 | 4.6 | 4.2 | 3.8 | 3.3 | 4.70d | 49.23 |
| T 5 | 5 | 4 | 3.8 | 3.5 | 3.2 | 3 | 2.5 | 3.57fg | 50.00 |
| T 6 | 7.8 | 7.6 | 7.4 | 7.1 | 6.8 | 6.5 | 6.2 | 7.06b | 20.51 |
| T 7 | 7 | 6.7 | 6.6 | 6.4 | 6.1 | 5.7 | 5.5 | 6.29c | 21.43 |
| Means | 6.31a | 5.66b | 5.36c | 5.03d | 4.07e | 4.40f | 4.06g |
Table 9: Different chemical preservatives effects on taste of dehydrated diced turnip Statistical analysis (Appendix-IX) shows th
Table 9: Different chemical preservatives effects on taste of dehydrated diced turnip Statistical analysis (Appendix-IX) shows that results regarding the taste of the different treatments of dehydrated turnip were highly significant (P<0.000). Results regarding the storage period of dehydrated diced turnip at different intervals were also highly significant (P<0.000).
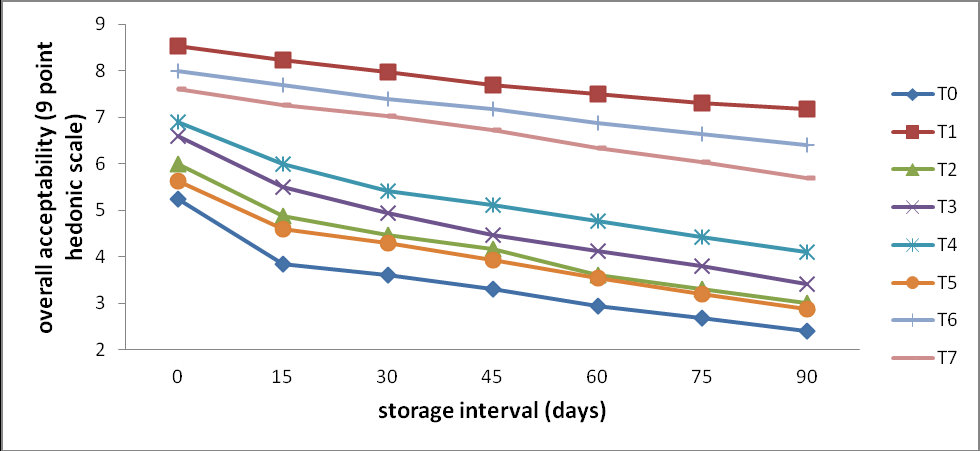
Overall acceptability: The dehydrated diced turnips were treated with different chemical preservatives (potassium sorbate, potassium metabisulphite, and sodium benzoate) and their different concentrations were analyzed for overall acceptability during storage periods. Findings considering to overall acceptability of dehydrated diced turnip during 90 days storage are shown in Table 10 and Figure 10.
The results of overall acceptability were showed a decreasing pattern with the storage period. The highest score rate decrease has occurred in T0 (5.23 to 2.4) 54.11%. While minimum decreases occur in T1 (8.53 to 7.17) 15.94%. The maximum mean score was obtained by T1 (7.77). While the minimum mean score got by T0 (3.42).
These findings are in close conformity with Jolson et al. [13]. They found that tomato paste preserved with potassium metabisulphite holds the best overall acceptability score and negligible microorganism.
| Tart. | Storage intervals | Mean | %Dec. | ||||||
|---|---|---|---|---|---|---|---|---|---|
| Initial | 15 | 30 | 45 | 60 | 75 | 90 | |||
| T 0 | 5.23 | 3.83 | 3.6 | 3.3 | 2.93 | 2.67 | 2.4 | 3.42g | 54.11 |
| T 1 | 8.53 | 8.23 | 7.97 | 7.7 | 7.5 | 7.3 | 7.17 | 7.77a | 15.94 |
| T 2 | 6 | 4.87 | 4.47 | 4.17 | 3.6 | 3.3 | 3 | 4.20f | 50.00 |
| T 3 | 6.6 | 5.5 | 4.93 | 4.47 | 4.13 | 3.8 | 3.4 | 4.69e | 48.48 |
| T 4 | 6.9 | 6 | 5.4 | 5.1 | 4.77 | 4.43 | 4.1 | 5.24d | 40.58 |
| T 5 | 5.63 | 4.6 | 4.3 | 3.93 | 3.53 | 3.2 | 2.87 | 4.01f | 49.02 |
| T 6 | 8 | 7.7 | 7.4 | 7.17 | 6.87 | 6.63 | 6.4 | 7.17b | 20.00 |
| T 7 | 7.6 | 7.27 | 7.03 | 6.73 | 6.33 | 6.03 | 5.7 | 6.67c | 25.00 |
| Means | 6.81a | 6.00b | 5.64c | 5.32d | 4.96e | 4.67f | 4.38g |
Table 10: Different chemical preservatives effects on overall acceptability of dehydrated diced turnip.
Statistical analysis (Appendix-X) shows that results regarding to taste of the different treatments of dehydrated turnip were highly significant (P<0.05). Results regarding storage period of dehydrated diced turnip at different intervals were also highly significant (P<0.05).
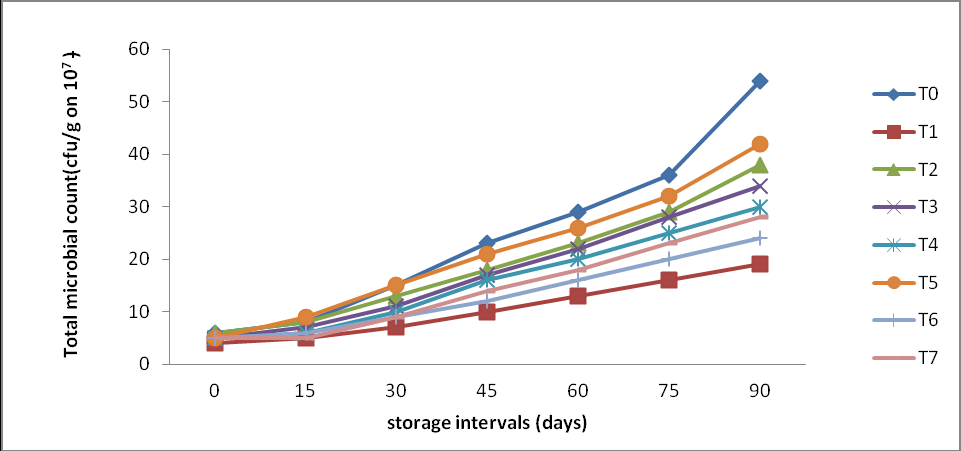
Total microbial count
The total microbial bacterial count was examined for different treatments of dehydrated diced turnip during 3-month storage period. Results regarding total bacterial count are shown in Table 11 and Figure 11.
The total bacterial count was increased in dehydrated diced turnip samples with storage intervals. Maximum increase of bacterial count was observed in T0 (6 x10⁷ to
54 x 107cfu/g) 800% While minimum percentage increase of bacterial count found in T1 (4 x 10⁷ to19 x 107cfu/g) 375%. During 90 days storage period, the maximum mean value obtained by treatment T0 (24.43 x 10⁷cfu/g) while the minimum mean value got by T1 (10.57 x 10⁷cfu/g).
These results are partially agreement with Hashmi, et al. (2007) [14] they reported that bacterial count was increased during the six-month storage of dehydrated mango pickles.
Statistical analysis (Appendix-XI) shows that results regarding the bacterial count of different treatments of dehydrated turnip were highly significant (P<0.05). Results regarding the storage period of dehydrated diced turnip at different intervals were also highly significant (P<0.05).
| Tart. | Storage intervals | Mean | %inc. | ||||||
|---|---|---|---|---|---|---|---|---|---|
| Initial | 15 | 30 | 45 | 60 | 75 | 90 | |||
| T 0 | 6x 10⁷ | 8x10⁷ | 15x107 | 23 x107 | 29 x107 | 36 x107 | 54 x107 | 24.43 x10⁷a | 800 |
| T 1 | 4 x10⁷ | 5 x10⁷ | 7 x10⁷ | 10 x107 | 13 x107 | 16 x107 | 19 x107 | 10.57 x10⁷f | 375 |
| T 2 | 6 x10⁷ | 8 x10⁷ | 13x107 | 18 x107 | 23 x107 | 29 x107 | 38 x107 | 19.29 x10⁷bc | 533.33 |
| T 3 | 5 x10⁷ | 7 x10⁷ | 11x107 | 17 x107 | 22 x107 | 28 x107 | 34 x107 | 17.71x10⁷bcd | 580 |
| T 4 | 5 x10⁷ | 6 x10⁷ | 10x107 | 16 x107 | 20 x107 | 25x107 | 30 x107 | 16.00x10⁷cde | 500 |
| T 5 | 5 x10⁷ | 9 x10⁷ | 15x107 | 21 x107 | 26 x107 | 32 x107 | 42 x107 | 21.43x10⁷ab | 740 |
| T 6 | 5 x10⁷ | 6 x10⁷ | 9 x10⁷ | 12 x107 | 16x107 | 20 x107 | 24 x107 | 13.14x10⁷ef | 380 |
| T 7 | 5 x10⁷ | 5 x10⁷ | 9 x10⁷ | 14 x107 | 18x107 | 23 x107 | 28 x107 | 14.57x10⁷de | 460 |
| Means | 5.13x10⁷f | 6.75x10⁷f | 11.13x10⁷e | 16.38x10⁷d | 20.88x10⁷c | 26.13x10⁷b | 33.63x10⁷a |
Table 11: Different chemical preservatives effects on total bacterial count of dehydrated diced turnip.
Conclusions
Results on the storage life of dehydrated turnip treated with different preservative chemicals revealed a significant influence of both storage life and chemical preservative treatments. Although a decrease in organoleptic quality was observed for the storage intervals, this decrease varied according to the chemical preservative. Among all the samples the treatment with 0.1% potassium metabisulphite was observed to be the most acceptable pretreatment on the overall quality basis of dehydrated diced turnip. Similarly, other physic-chemical traits responded variably according to the chemical preservative at different storage intervals [15, 16, 17].
Acknowledgement
The authors are thankful to the Ministry of Agriculture of the Republic of Kazakhstan for funding this research work: Development of technologies using new strains of beneficial microorganisms, enzymes, nutrients, and other kits in the production of special dietary food products IRN: BR10764998
References
-
Borowski J, Szajdek A, Borowska EJ, Ciska E, Zieliński H (2007) Content of selected bioactive components and antioxidant properties of broccoli (_Brassica oleracea_ L.). European Food Research and Technology. 226(3): 459- 465.
-
Fernandes F, Valentao P, Sousa C, Pereira J, Seabra R, et al. (2007) Chemical and antioxidative assessment of dietary turnip (Brassica rapa var. rapa L.). Food Chemistry 105(3): 1003-1010.
-
Jones G, Sanders OG (2002) A sensory profile of turnip greens as affected by variety and maturity. J Food Sci 67(8): 3126-3129.
-
Helland HS, Leufvén A, Bengtsson GB, Skaret J, Lea P, et al. (2016) Storage of fresh-cut swede and turnip in modified atmosphere: effects on vitamin C, sugars, glucosinolates and sensory attributes. Postharvest Biology and Technology 111: 150-160.
-
Brennand CP (1994) Home drying of food. Utah State University, USA.
-
AOAC (2000) Offical methods of analysis Association of official and analytical chemists 13th(Edn.). Washington, DC
-
Steel RGD, Torrie JH (1980) Principles and procedures of statistics McGraw Hill Co. New York,USA. 2nd: 137-175.
-
Chaudhary MA, Bibi N, Khan D, Khan F, Sattar A (1995) Solar dehydration of fruits and vegetables. Annual Report, Nuclear Institute for Food and Agric.(NIFA) Peshawar. pp. 87-92.
-
Akhtar S, Javed B (2013) Physiochemical anaylsis and quality evaluation of intermediate moisture in apple slices. Wyno J Bio Sci 1(3): 15-19.
-
Negi PS, Roy SK (2000) Effect of low cost storage and packaging on quality and nutritive value of fresh and dehydrated carrots. J Sci Food and Agri 80(15): 2169- 2175.
-
Chawla, P., S. Ghai, and K.S. Sandhu. 2005, Studies on the nutritional and organoleptic characteristics of carrot pickle during storage. J Food Sci Tech 42(4): 358-360.
-
Sain S, Sogi DS, Bawa AS (2000) Shelf life studies on chemically preserved sand pear (pyrus pyrifolia cv patharnakh) pulp. J Food Sci Tech Mysore 40(2): 230- 232.
-
Jolson MA, Bravemen JBS (1998) The chemistry and technology of pretreatment and preservation of fruits and vegetables products with sulpher dioxide and suphites. Adv In Food Res 40(5): 97-160.
-
Hashmi MS, Alam S, Riaz A, Shah AS (2007) Studies on microbial and sensory quality of mango pulp storage with chemical preservatives. Pak J Nutrition 6(1): 85-88.
-
Inyang UE, Lke CI (1998) Effect of blanching, dehydration method and temperature on the ascorbic acid, color,sliminess and other constituents of okra fruit. Inter J Food Sci and Nutrition 49(2): 125-130.
-
Mepba HD, Eboh L, Banigo DEB (2007) Efects of processing treatments on the nutritive composition and consumer acceptance of some Nigerian edible leafy vegetables. African J Food Agri Nutr and Development 7(1): 1684-5374.
-
Osunde ZD, Ovrhevba BA (2009) Effects of storage condition and storage period on nutritional and other qualities of stored yam(sioscorea spp) tubers. African J. Food Agri. Nutr. & development 9(2): 1684-5374.
- The Role of Podocyte Apoptosis and the Involvement of SIRT1 in Diabetic Nephropathy
- Dealcoholization of Beer by Osmotic Distillation for the Beverage Industry
- Biopolymer-Based Edible Packaging- Biomaterials, Methods, and Applications in Food Industry: An Updated Review
- Influence of Bioprocessing Methods on 'China Rice' (Gawal R1), and Soyabean Supplementation on the Quality of Complementary Food
- Cassava (Manihot esculenta) Varietal Growth, Yield and Cyanide Content Performance in Three Sites in the South- Eastern Semi Arid Regions of Kenya
- Food Waste Treatment, Recycling, Management and Production of Value-Products-An Update on Methodologies and Current Trends