Enhancement of Spices’ Inherent Characteristics Using Mid-Infrared Ray – A Pioneering Research
Spices are vital ingredients in cuisine, traditional medicine, pharmaceutical, and nutraceutical industries. Increasing the potency of the organoleptic properties of spices may reduce the quantity of use, hence conserving natural resources and reducing cost. However, the technology to accomplish this has not yet been developed. We have invented a 2-6 μm Mid-Infrared Generating Atomizer (MIRGA), which was applied externally over packaged spices. We discovered the changes in spices’ chemistry which was responsible for their enhanced inherent characteristics (aroma and taste). In addition, the required quantity of the treated spices for recipe preparation was 20-40% less versus control. The irradiation using MIRGA is economical, easy to use at any level from consumer to industry, safe and eco-friendly. The research is illustrated with organoleptic tests, instrumental measurements and mineral estimation of black cumin.
Introduction
Spices are now very commonly used. The most common include black pepper, chili pepper, ginger, fenugreek, cardamom, cumin, and coriander, among others [1]. When spices are used in proper quantities, they can be very beneficial for food flavor, culinary and industrialized foods [2]. Therefore, spices always have a high commercial demand.
Besides being useful to improve food sensorial properties, spices have many uses such as medicinal, dietary and can be used as food preservatives [3, 4]. Spices also have antimicrobial, antioxidant, and pharmaceutical properties and, hence, are regarded as a functional ingredient for food. However, spices have shortcomings such as microbial spoilage, oxidation, and short shelf life [5]. Thus, efforts are being made to increase spices productivity and improving its quality [6].
Spices have many different functional groups that confer the typical flavors and aroma. These functional groups are alcohols, esters, aldehydes, terpenes, and acids. Molecules such as capsaicin (chili pepper), piperine, melanin (black pepper), cineole (cardamom), turmeric (cumin), geraniol (coriander), essential oils, among others, have an abundance of the mentioned functional groups [7, 8, 9].
Mid-IR is biologically harmless and penetrates most obscurants [10, 11]. All molecules of Earth (including spices) absorb mid-infrared radiation [12]. Thus, mid-IR could be used to improve the quality and organoleptic properties of spices. Therefore, our work had the objective of studying the improvements of spices after 2-6μm mid- IR irradiation using chemical and physicochemical characterization along with sensorial analysis.
Materials and Methods
Materials
Pepper (Piper nigrum), chili pepper (Capsicum annum), ginger (Zingiber officinale), fenugreek (Trigonella foenum- greacum), cumin (Cuminum cyminum), black cumin (Nigella sativa), coriander (Coriandrum sativum) and cardamom (Elettaria cardamomum) were bought at a local market. For each spice, different brands were individually tested, but the brand/batch was never mixed.
MIRGA Apparatus
MIRGA (patent no.: 401387) is a 20 ml pocket sized atomizer (Supplementary file – figure F1) containing inorganic water based solution in which approximately two sextillion cations and three sextillion anions are contained. During spraying, depending on pressure (vary with the user) applied to plunger, every spraying generates 2-6µm mid- IR. Design of the MIRGA and emission of 2-6µm mid-IR has been presented in detail [13, 14, 15, 16]. Every time spraying emits 0.06ml which contains approximately seven quintillion cations and eleven quintillion anions. (details about MIRGA available in supplementary text T1). The 2-6µm mid- IR penetrates the packaging [11] and act on the inside content. Close spraying does not generate energy. Spraying was performed from 0.25–0.50 meter towards the packaged (paper, cloth, polythene) spices (Method of MIRGA spraying in Supplementary file – video V1). This distance is essential for ions oscillation and 2-6μm mid-infrared generation.
Mid-Infrared Spraying of Spices
A control sample was taken from a package containing 1000gm of a spice and subjected to sensory and instrumentation analysis. The packets with remaining spice were sealed, then given one MIRGA spraying, opened and taken sample for sensory instrument analysis. Then the packet with remaining spice was sealed, given 2 MIRGA sprayings, opened and taken sample for sensory and instrumentation analysis. These steps were continuously repeated with increasing the repetitions of spraying. After every spraying, the sample was subjected to sensory evaluation (9 points hedonic) based on Everitt M and Wichchukit, et al. [17, 18] 1 - Dislike extremely, 2 - Dislike very much, 3 - Dislike moderately, 4 - Dislike slightly, 5 - Neither like nor dislike, 6 - Like slightly, 7 - Like moderately, 8 - Like very much, 9 - Like extremely. The spraying and sensory tests were repeated until a poorer sensory attribute was found. Based on the sensory evaluation, the samples with the highest and lowest scores and control were individually powdered and subjected to instrumental testing. This method was performed for the eight spices. The trials were repeated for accuracy. The sample for a trial and control were taken from the same source packet. The difference among the samples was only the number of MIRGA sprayings they received.
Spices Sensorial Attributes Evaluation
To evaluate the effects of MIRGA, the services of a sensory expert panel (n:6) from the condiment industry and a panel of untrained experts (cooks n:15) were employed. Additionally, the control and enhanced samples were used as ingredients in cooking. The quantity required to achieve routine taste and aroma was also recorded, and the results were compared.
Spices Characterization
The instruments used to characterize the sprayed spices were: high-performance liquid chromatography (HPLC), gas chromatography-mass spectrometry (GC-MS), Fourier- transform infrared spectroscopy (FTIR),powder X-Ray diffraction (PXRD),transmission electron microscopy (TEM), and nuclear magnetic resonance spectroscopy (NMR) and inductively coupled plasma-atomic emission spectroscopy (ICP-AES) (details in Supplementary file). All the samples for a trial were taken from the same source packet, and packets of different batches and brands were not mixed in any trial.
Results and Discussion
Sensorial Tests
Tables 1-3 presents the sensorial panel scores for the sprayed spices. The control samples had a natural taste and aroma. During the spraying and sensorial tests, it was found that a certain number of spraying enhanced the taste and aroma of the spice, but beyond a given number of spraying, it was found reduced taste, gradually leading to more inferior sensory attributes than the control. In the tested spices, 2 or 3 sprayings were enough to reach the maximum acceptability score except for chili peppers that required 6 sprayings. The enhanced sensory characteristics were recorded between 1-5 minutes. The maximum acceptability means that the panel found the spices to have increased inherent character and palatability. On the other hand, 6 sprayings were enough to reduce the acceptability of some spices, with the maximum repetitive sprayings set at 12 also for the chili pepper. The repetitive spraying input infrared energy on the spice samples that cause alterations on the molecules within the spices. These alterations could be responsible for the increase in acceptability as well as its reduction.
| No. of MIRG A sprayings | Pepper | Chili pepper | Ginger | Curry leaves | Fenugreek | Cumin | Black cumin | Coriander seeds | Cardamom | ||||||||
|---|---|---|---|---|---|---|---|---|---|---|---|---|---|---|---|---|---|
| Hotness | Aroma | Hotness | Hotness | Aroma | Taste | Aroma | Bitterness | Aroma | Taste | Aroma | Taste | Aroma | Taste | Aroma | Taste | Aroma | |
| Control | 5 | 5 | 5 | 5 | 5 | 5 | 5 | 5 | 5 | 5 | 5 | 5 | 5 | 5 | 5 | 5 | 5 |
| 1 | 7 | 7 | 5 | 7 | 6 | 6 | 6 | 6 | 5 | 6 | 5 | 6 | 6 | 6 | 5 | 6 | 6 |
| 2 | 7 | 8 | 6 | 8 | 7 | 6 | 7 | 6 | 7 | 7 | 6 | 7 | 6 | 7 | 7 | 7 | 8 |
| 3 | 6 | 8 | 6 | 5 | 5 | 8 | 9 | 5 | 5 | 5 | 4 | 7 | 7 | 6 | 5 | 6 | 7 |
| 4 | 5 | 7 | 7 | 4 | 5 | 7 | 9 | 4 | 4 | 4 | 3 | 6 | 6 | 5 | 4 | 6 | 5 |
| 5 | 4 | 6 | 7 | 4 | 4 | 5 | 7 | 2 | 2 | 2 | 2 | 5 | 6 | 4 | 3 | 5 | 5 |
| 6 | 3 | 5 | 8 | 3 | 3 | 5 | 5 | 1 | 1 | 1 | 1 | 5 | 5 | 3 | 2 | 5 | 4 |
| 7 | 3 | 3 | 6 | 2 | 2 | 3 | 4 | - | - | - | - | 4 | 4 | 1 | 1 | 4 | 4 |
| 8 | 2 | 3 | 5 | 1 | 1 | 2 | 4 | - | - | - | - | 3 | 3 | - | - | 4 | 3 |
| 9 | 2 | 2 | 4 | - | - | 1 | 3 | - | - | - | - | 2 | 3 | - | - | 3 | 3 |
| 10 | 1 | 2 | 3 | - | - | - | - | - | - | 2 | 2 | - | - | 2 | 2 | ||
| 11 | - | - | 3 | - | - | - | - | - | - | - | - | - | - | 1 | 1 | ||
| 12 | - | - | 2 | - | - | - | - | - | - | - | - | - | - | - | - |
Table 1: Sensory profiling of spices.
| MIRGA spraying number | Fresh leaf | Chutney | Dried leaf powder | |||
|---|---|---|---|---|---|---|
| Taste | Aroma | Taste | Aroma | Taste | Aroma | |
| Control | 2 | 2 | 2 | 2 | 2 | 2 |
| 1 | 4 | 4 | 4 | 5 | 5 | 4 |
| 2 | 6 | 6 | 6 | 7 | 7 | 6 |
| 3 | 8 | 9 | 9 | 8 | 7 | 9 |
| 4 | 7 | 6 | 8 | 7 | 6 | 6 |
| 5 | 5 | 5 | 6 | 6 | 6 | 5 |
| 6 | 4 | 4 | 5 | 4 | 5 | 4 |
| 7 | 3 | 3 | 4 | 3 | 4 | 3 |
| 8 | 2 | 2 | 3 | 2 | 3 | 2 |
| 9 | 1 | 2 | 1 | 1 | 2 | 1 |
Table 2: Sensory profiling of curry leaf samples.
| S.no | Spice name | Inherent characters | No. of sprays required for inherent characters | ||
|---|---|---|---|---|---|
| Enhancement | Reduction | ||||
| 1 | Pepper | Hotness, aroma | 2 | 10 | |
| 2 | Chili pepper | Hotness | 6 | 12 | |
| 3 | Ginger | Hotness, aroma | 2 | 8 | |
| 5 | Fenugreek | Bitterness, aroma | 2 | 6 | |
| 6 | Cumin | Taste, aroma | 2 | 6 | |
| 7 | Black cumin | Taste, aroma | 3 | 10 | |
| 8 | Coriander seeds | Taste, aroma | 2 | 7 | |
| 9 | Cardamom | Taste, aroma | 2 | 11 | |
| Sr.No | Minerals | Black cumin | Remarks | ||
| Control | 3 sprayed | 10 sprayed | |||
| 1 | Ca | 0.579 | 0.586 | 0.496 | 14% reduction |
| 2 | K | 0.59 | 0.597 | 0.54 | 8% reduction |
| 3 | Mg | 0.285 | 0.288 | 0.275 | 3% reduction |
| 4 | Na | 0.022 | 0.021 | 0.024 | 4-9% reduction |
| 5 | Zn | 0.0045 | 0.0045 | 0.0048 | 6% reduction |
| 6 | P | 0.487 | 0.49 | 0.46 | 5% reduction |
Table 3: Sensorial scores for the tested spices.
Furthermore, the consumer panel’s (house-wives and traders) opinion was similar to the sensory expert panel. On cooking, the enhanced spices’ requirement was 20-40% less than that of non- sprayed (control) All the control spices obtained the hedonic score 5. Whereas for taste and aroma enhancement and reduction, the spices obtained 7, 8 and 9, and 1, 2 and 3 hedonic points, respectively Table 4.
Instrumentation Results
(Raw data of instrumentations and detailed interpretations in Supplementary file) Gas Chromatography-Mass Spectroscopy (GC-MS): Figure 1 presents the GC-MS chromatogram of the tested spices. Each spice chromatogram is discussed individually below.
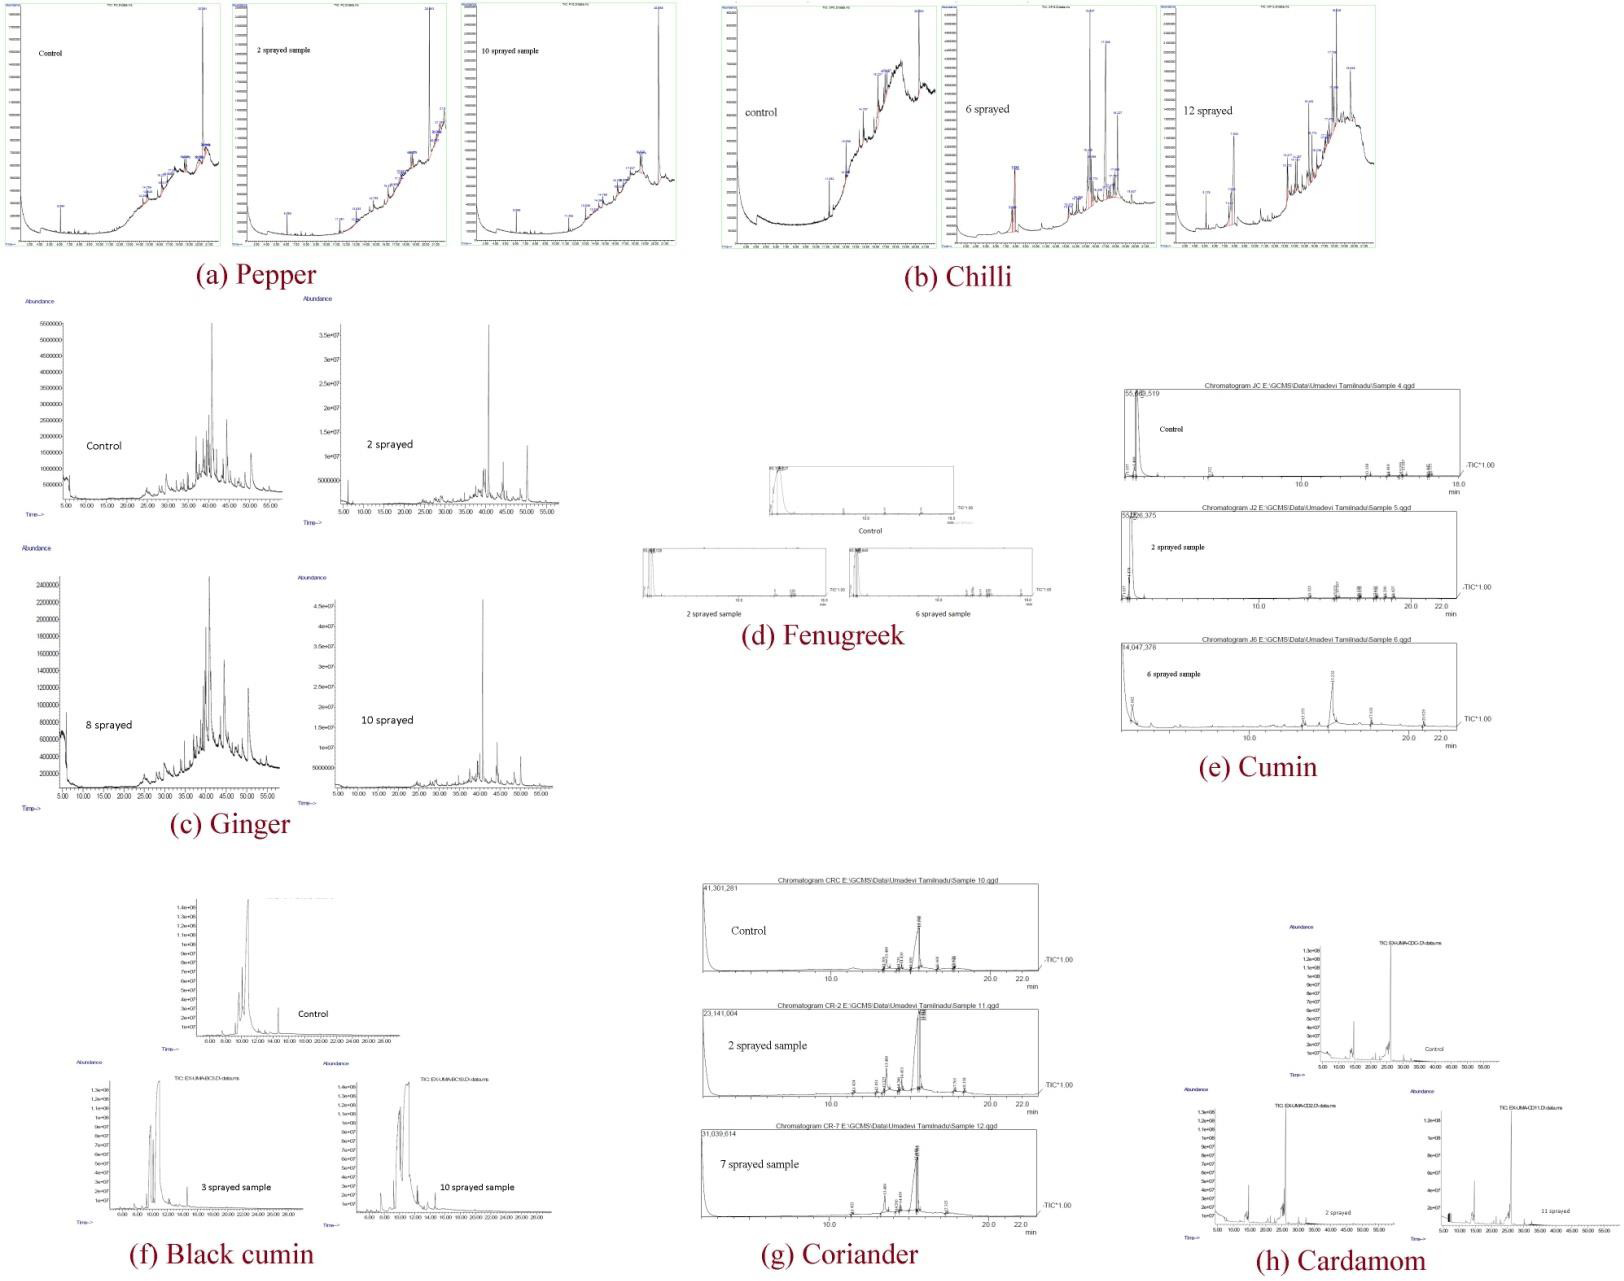
• Pepper: The two main peaks appearing in all the three (control, 2 and 10 sprayed) samples are attributed to Caryophyllene and Piperine at 6.08 min and 20.36 min, respectively. Both compounds are commonly found in black pepper. Caryophyllene is known to contribute to the aroma of black pepper, while piperine contributes to the hotness and pungency. Despite the significant rise in the level of piperine in the sample sprayed 10 times by almost 50%, there was a downgrade for the quality (reduction in both hotness and aroma) of this sample, compared to a control or the 2 times sprayed sample. This is attributed to the formation of other degradation products due to the 10 sprayings which are structurally related to fatty acids, such as the compounds appearing as peaks at 11.36 min and 13.0 min. The three samples contain mostly piperine, and the hotness reduced in 10 sprayed samples is the result of the changes on piperine isomer configuration.
• Chili pepper: Compared to control, samples sprayed 6 times show peaks at the retention times 15.47 min and 17.02 min. The peaks are attributed to capsaicinoid molecules and therefore, are related to the hotness of the sample. Specifically, both peaks on 15.47 min and 17.02 min disappear after the sample is sprayed for 12 times, which explains the hotness reduction. 6 sprayed sample shows new compounds which again disappear in 12 sprayed sample, and these compounds are attributable to capsaicin analogues.
• Ginger: The most intense peak is attributed to Gingerol and is shared among all samples. However, the intensity of the Gingerol peak increased after 2 and 10 sprays when compared to control. Samples sprayed for 8 and 10 times showed some new unique peaks. Interestingly, in the sprayed samples, the peaks attributed to Fumaric acid, myrtenyl octyl ester, 17-Octadecynoic acid, 12-Methyl- E,E-2,13-octadecadienoic-1-ol, 1-Hexadecanol, 2-methyl and Naphthalene, 1- (1-decylundecyl) decahydro were not detected.
• Fenugreek: Compared to control, after 2 sprays, a new peak attributed to Hygrine and traces of Palmitic acid was detected. These molecules are responsible for the enhancement in bitterness. After 6 sprayings, the sample presented a unique peak attributed to Krypton with an increase in oleic acid. This peak is responsible for further loss in bitter taste and aroma.
• Cumin: The control sample contains many long-chain fatty acids, such as oleic acid, palmitic acid, and stearic acid. After 2 sprayings, there was a new peak attributed to Chloroform and a decrease in Palmitic and stearic acid with an increase in Oleic acid. These molecules are responsible for the enhancement of taste and aroma. The 6 times sprayed sample has shown a unique peak of Cyclotetrasiloxane and increases in palmitic and oleic acid. This combination is responsible for the loss of taste and aroma.
• Black Cumin: Control contains fatty acids and its ester such as Hexadecanoic acid, 9,12-Octadecadienoic acid (as major fatty acid), and other molecules such 13-Docosenamide, (Z), Phenol, 4-methoxy-2,3,6- trimethyl etc. 3 sprayed sample there was new peak of 8,11-Octadecadienoic acid, methyl ester. Besides, n-Hexadecenoicacid and 9, 12-Octadecadienoic acid (Z, Z)- were increased after 3 spraying. These all changes are responsible for enhancement of sweetness and aroma characters. 10sprayed sample has shown unique peak of Hexadecanal, 2-methyl and Hexadecanoic acid, 3- [(trimethylsilyl) oxy] propyl ester which are responsible for tastelessness with aroma reduction. Also, n-Hexadecenoic acid & 9,12-Octadecadienoic acid (Z, Z)- were increased after 10 spraying.
• Coriander: The control sample contains many long- chain fatty acids, such as oleic acid, palmitic acid, and linoleic acid. After the 2 sprays, there was a new peak attributed to Erucic acid, C-20 fatty acid, and a decrease in Linoleic acid. The presence of these molecules is responsible for the enhancement of taste and aroma. However, the sample sprayed for 7 times has shown a unique peak of Oleyl alcohol and increases in palmitic acid. This combination is responsible for loss in taste and aroma.
At RT (min) 15.442, 7 times sprayed samples show an oleyl alcohol peak of 58.66, which is absent in control and 2 sprayed samples. Biologically oleyl alcohol acts as energy source and storage, nutrient and membrane stabilizer, and in the industry as surfactant and emulsifier. The linoleic acid at RT (min) 15.502, 76.35% in control, was entirely disappeared after 2 and 6 sprayings, whereas the same was naturally compensated by the reappearance of linoleic acid with 51.37% content at RT (min) 15.433 by 2 spraying which is absent in control. Linoleic acid is a source of energy and maintains the fluidity of the epidermal cell. At RT (min) 15.495 and 15.518 oleic acids are increased by 2 and 6 MIRGA sprayings, respectively which is absent in the control sample. This enhanced oleic acid possess beneficial health effects like anticancer, anti- inflammatory, wound healing, immune-enhancing, and macrophage effects [19]. On the contrary, at RT (min), 15.558 control has an oleic acid peak of 13.81%, which was disappeared in 2 and 6 sprayed samples. Naturally, the disappeared peak of 13.81% was compensated by 12.14% peak at RT (min) 15.555 by 6 sprayings which is absent in control. At RT 15.596, 2 sprayings have caused 12.66% peak of Erucic acid increase, which is absent in control and 6 sprayings. Eruic acid long term intake (like; rapeseed/mustard seed) cause myocardial lipidosis but the effect is only transient and reversible [20] hence safe.
• Cardamom: Control contains Eucalyptol, Cyclohexene, 1-methyl-4-(1-methylethylidene)and 3-Cyclohexene- 1-methanol, α, α4-trimethyl (most abundant peak). 2 sprayed sample has a new major peak of 3- Cyclohexen- 1-ol, 4-methyl-1-(1-methylethyl)-, acetate. Additionally, there was no peak of γ- Himachalene and decrease in peak of Eucalyptol. These differences are responsible for enhancement of inherent characters and dissolutions in powder form of 2 sprayed sample. Whereas 11 sprayed sample has shown most abundant (65.51%) peak of Cyclohexene, 1-methyl- 4-(1-methylethylidene) which was only 1.32 % in control sample. There was reduction of γ- Himachalene peak as compared to control. These attributes to the reduction of inherent characters in 11 sprayed sample.
Fourier Transform Infrared Spectroscopy (FTIR): Figure 2 presents the FTIR spectra of the tested spices. Each spice spectrum is discussed individually below.
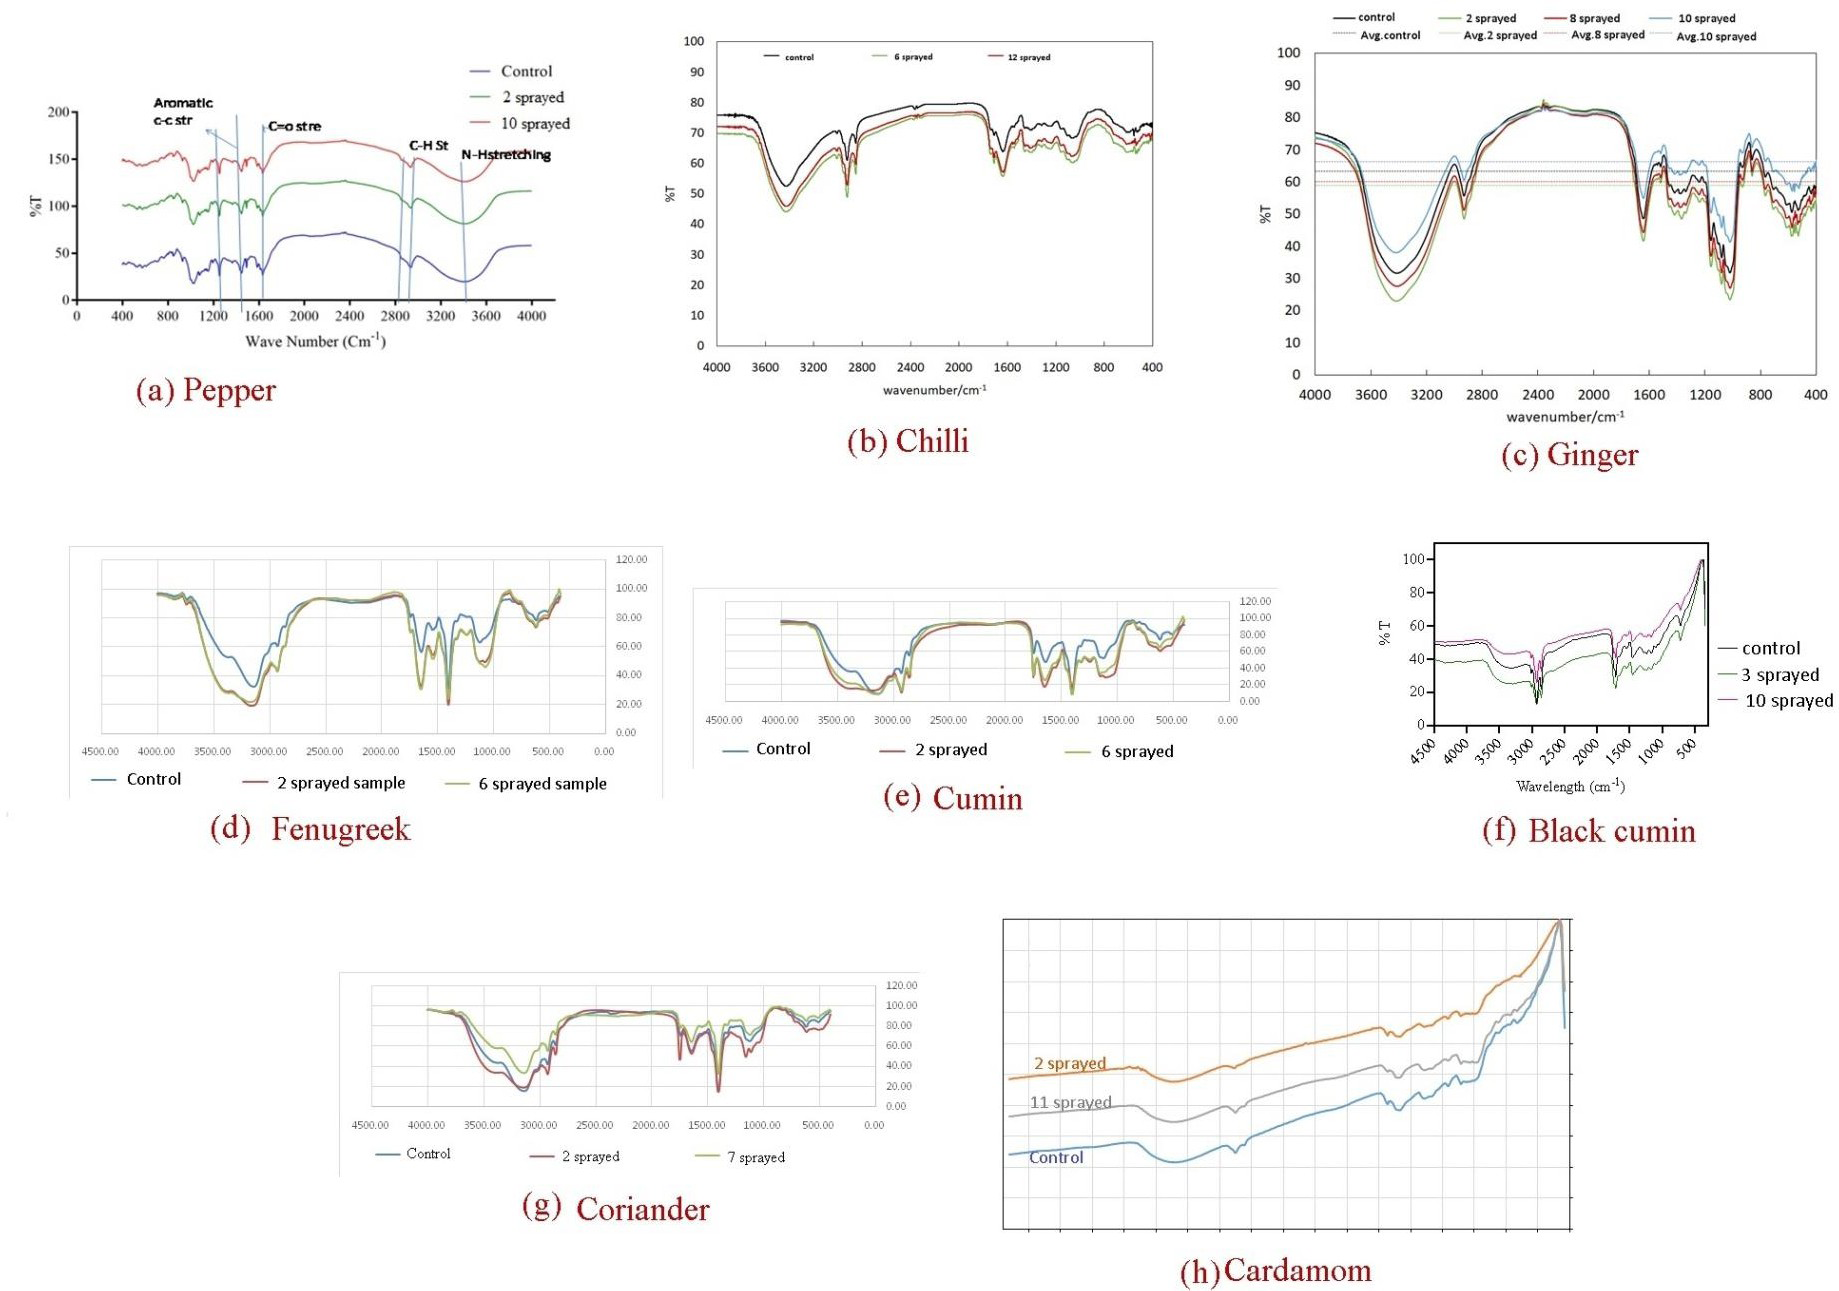
• Pepper: The absorption at 3415cm-1 is attributed to N-H stretching. The 2926cm-1 and 2860cm-1 bands reveal the aliphatic C-H stretching. The peak at 1639cm-1 is due to C=O stretching. The peaks at 1442cm-1 and 1556cm-1are due to C-C stretching in the aromatic ring. Observing the results, there is no significant difference between bond presences in between samples. However, the peak intensity due to N-H stretching and C-H stretching is more intense in the samples sprayed 2 times than in samples sprayed 10 times.
• Chili pepper: The absorption at ~2924 cm-1 is associated with the stretching vibration of N-H in the amine functional group, which increases around 6% in the 6 times sprayed sample, and decreases again by around 2.5% in the 12 times sprayed sample. These changes in the N-H stretching vibration result in more acceptability of the 6 times sprayed sample than the control sample, while the 12 times sprayed sample is less acceptable from a sensorial attribute point of view.
• Ginger: The broad signal in the range of 3200-3600 cm-1is associated with the stretching vibration of O- H in the hydroxyl functional group of ginger. This O-H band intensity increases by around 7.6%, for the 2 times sprayed sample, which means more O-H groups are present. Whereas in 10 times sprayed sample, the O-H band is around 6.4% lower than the control. These observed changes in the O-H stretching vibration could be related to the increasing acceptability of the 2 times sprayed when compared to the control sample, while the 10 times sprayed sample is less acceptable.
• Fenugreek: The peak area increases in the samples sprayed for 2 and 6 times when compared to the control samples. This result suggests that the MIRGA spraying rebuilds the composition of carbohydrates, and thus the peak areas increase.
• Cumin: Similarly, to the fenugreek, the areas of the peaks increase in the samples sprayed for 2 and 6 times. This result suggests that the MIRGA spraying rebuilds the composition of carbohydrates, and thus the areas increase.
• Black Cumin: The difference in the 1658 cm−1 band of the sample sprayed 3 times, which corresponds to the C=O stretching, suggests changes in the C=O groups upon spraying. The decrease in the C=O can explain the reduced aroma of the 10 times sprayed sample. The peak at 1280 cm-1in the spectrum of the 3 and 10 times sprayed samples is not present in the control sample. This peak corresponds to the CH3 bending, suggesting molecular chain cleavage of the cumin upon spraying.
• Coriander: The area of the peaks increases on coriander samples after 2 sprayings and decreases after 7 sprayings. This result suggests an increase in fat and carbohydrate content after 2 sprayings and consequent reduction after 7 sprayings.
• Cardamom: The most remarkable change is the variation in the transmittance (absorption) that is directly related to the concentration. The control sample shows a broad band between 3700-3000 cm-1, which is attributable to O-H stretching of hydroxyl groups (probably, establishing hydrogen bonds).This band can also have the contribution of the stretching of N-H bonds from amines or amides. A more defined band appears between 2800- 3000 cm-1, which is typical of the C-H stretching of saturated moieties, like alkanes or cycloalkanes. Less intense peaks are observed between 1780-1500 cm-1 that could be originated by the stretching of C=O bonds. Below 1500 cm-1, the fingerprint region is located. This region is usually very crowded, and it is difficult to identify peaks accurately. The 2 sprayings sample shows a spectrum with a significantly lower transmittance, pointing to a reduction in the concentration of the compounds. Bands and peaks observed in this sample are quite similar in shape and position compared to the control sample. A special reduction of the transmittance in the bands corresponding to the C-H stretching of saturated moieties (2800- 3000cm-1) is observed in this sample. This could be responsible for the enhanced inherent characteristics. The 11 sprayings sample shows a spectrum with a significantly lower transmittance compared with the control sample, but higher than the transmittance of the 2 sprayings sample. This result points to the fact that the reduction of the concentration of compounds is not so pronounced in the 11 sprayings sample compared with the 2 sprayed sample, hence reduced inherent characteristics.
Powdered X-Ray Diffraction (PXRD): Figure 3 presents the Powder X-ray Diffraction spectra of the tested spices. Each spice spectrum is discussed individually below.
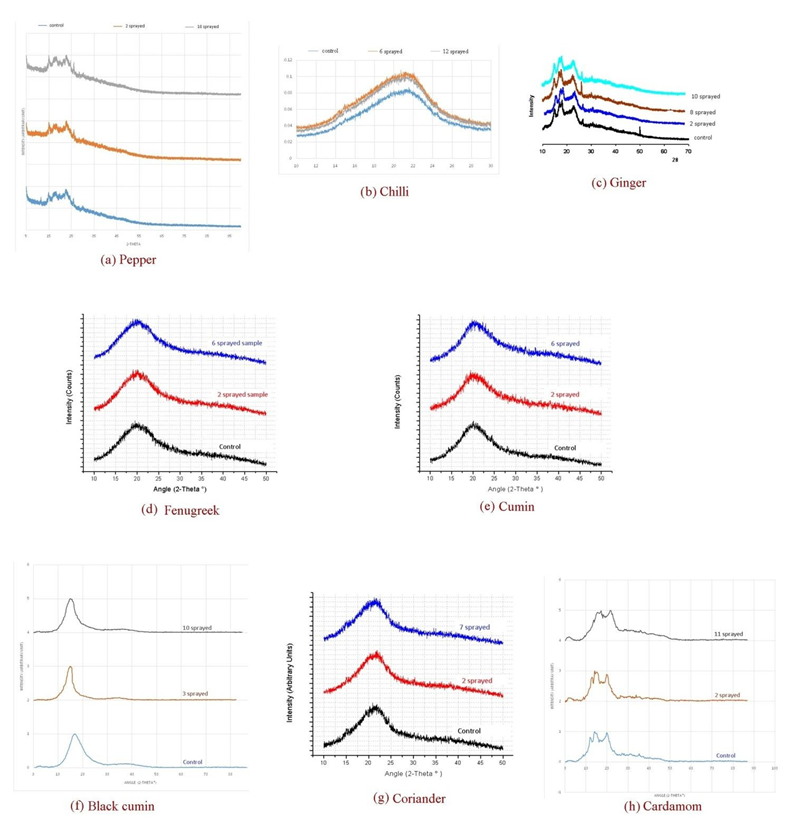
• Pepper: The 10 sprayings sample has the most number of prominent peaks in its XRD among the three samples. Some of the peaks that are merged in both control and 2 sprayings samples’ splits in the 10 sprayed samples. Peak intensity around 26.00 increases with the increase in the number of sprayings. The peak of control around 11.0o is absent in the 2 and 10 sprayings samples. A new peak can be observed in the 10 sprayings sample XRD at 24.0o. Both scenarios indicate the formation of new phases in sprayed samples. The 2 sprayings and the 10 spraying samples show similar XRD, while the control sample shows relatively broader diffraction.
• Chili pepper: All three samples show broad peaks centered at 21.5o, but slightly shifting to higher 20 values with the increasing number of sprayings.
• Ginger: The result shows a decrease in powder crystallinity by increasing the number of sprayings. The 2 and 8 sprayings samples have decreased crystallinity by 3%. The 10 sprayings sample has a decreased crystallinity by 10%.
• Fenugreek: XRD patterns of the control and the sprayed samples are relatively similar to each other. Thus, it can be inferred that the spraying employed in the study retained the initial amorphous nature of the fenugreek sample. However, due to spraying peak intensity varies between the samples, and it can be accounted on crystallite sizes and non-random crystallite orientations, which influenced the inherent characteristics of fenugreek.
• Cumin: XRD signals exhibit broad diffraction patterns with a large amount of noise. This behavior indicates the amorphous nature of the samples. The broad peak observed in the range of 2θ seen in each spectrum indicates the presence of cellulosic contents [21]. The peak of control around 2θ=24.46o is absent in the samples after 2 and 6 sprayings. This scenario indicates that the sprayed samples exhibit the formation of new phases.
• Black Cumin: The 3 sprayings samples produced a narrower intense peak compared to the control. The 10 sprayings samples produced a broader intense peak when compared to the control. These scenarios indicate the significant effect of the number of MIRGA sprayings on the resulting crystallite size of the samples.
• Coriander: The XRD patterns of the control and the sprayed samples are relatively similar to each other. With this, it can be inferred that the sprayings employed in the study retained the initial amorphous nature of the coriander samples.
• Cardamom: The three samples exhibited considerably similar XRD patterns except that some peaks present on the control are not observed on the other two sprayed samples. Peak around 20 = 15.00o is absent at the 11 sprayings sample. Peak around 20 = 34.00o is absent after 2 and 11 sprayings samples. These absences indicate differences in the crystal structure of the samples.
Nuclear Magnetic Resonance (NMR): Figure 4 presents the nuclear magnetic resonance spectra of the tested spices. Each spice spectrum is discussed individually below.
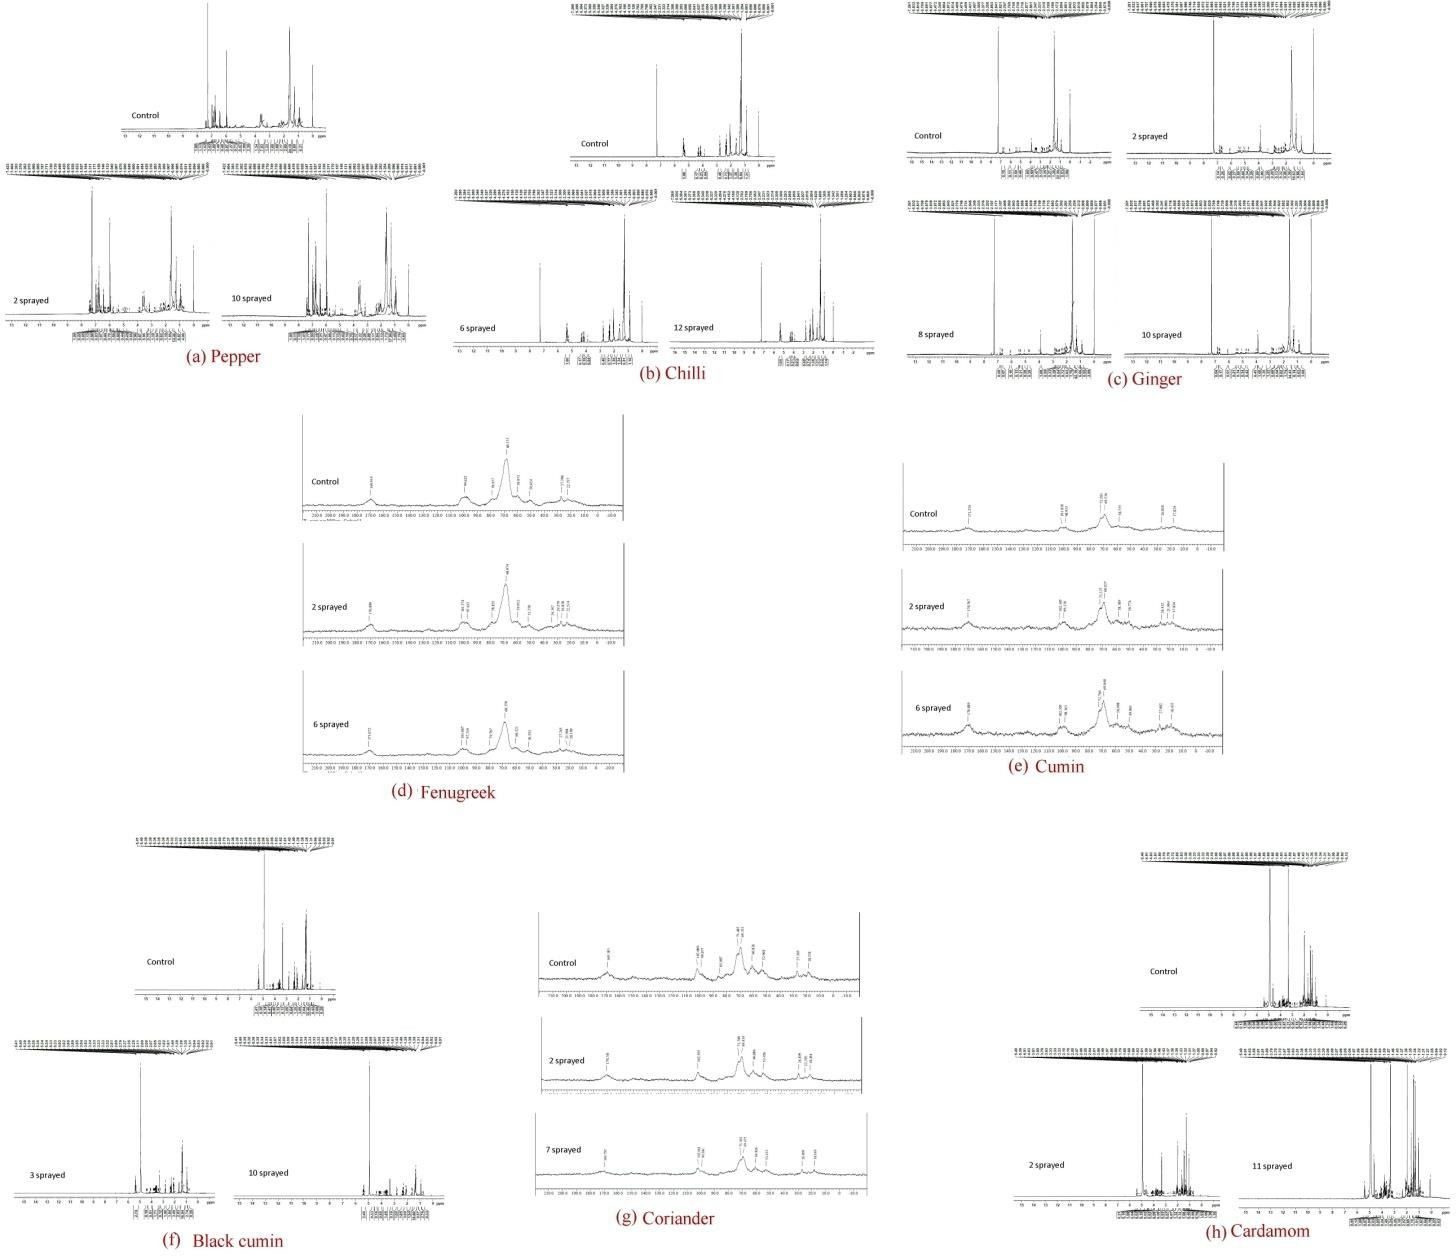
• Pepper: One of the main compositions of pepper is piperine, and the chemical shift of the axially substituted cyclohexane at 3.528 ppm remains the same in (control) and (2 sprayed) and (10 sprayed), so we used this peak as a reference to normalize the integral values in all the three sample data. Concerning the control, the monosubstituted alkane–COOCH3 (0.918 ppm), the monosubstituted alkane–phenyls (1.602 and 2.343 ppm), and the conjugated dienes (5.976 ppm), the saturated alicyclic hydrocarbons (6.420 ppm) decrease in the 2 sprayings sample. However, in the 10 sprayings sample, these integrals increase again. The peak area chart shows the same behavior for the axially substituted cyclohexane at 3.528 ppm. These results could explain why the2 spraying sample is more acceptable than the control sample and the 10 sprayings sample being less acceptable [22, 23, 24].
• Chili: Chili powder main composition is capsaicin, and there is no significant change when comparing the –NH compound at 0.880 ppm in control, 6,and 12 sprayings samples. This peak was used as a reference to normalize the integral values. In order to analyze the data, the peak integral, and the normalized peak integral values are sketched. Concerning the control, the amines and ammonium salts at 1.301 and the monosubstituted alkane at 1.621 ppm and 2.347 ppm increased in the 6 sprayings sample. However, in the 12 sprayings sample, these integrals drop in value again. The peak shows a consistent drop in the –NH compound reference at 0.880 as the spraying increases. The rest of the spectral peaks show insignificant changes in the three samples. Hence interpreted as to the 6 sprayings sample being more favourable than the control sample and the 12 sprayings sample being less favourable [22].
• Ginger: The main composition of ginger is zingiberene, and there is no change in the chemical shift and the integral of monosubstituted alkanes–OCO–phenyl at 3.872 ppm in control, 2, 8 and 10 sprayings samples, thus, this peak was used as a reference to normalize the integral values. Concerning the control, the fatty acid CH3 (0.879 ppm), the monosubstituted alkane –phenyl (1.254 ppm), the axially substituted cyclohexane (1.584 ppm), the saturated alicyclic hydrocarbons (2.051 and 2.186 ppm), the substituted alkane (2.841 ppm), and the substituted ethylene (6.816 ppm) decreased in the 2 sprayings sample. Nevertheless, in the 8 sprayings and the 10 sprayings samples, these integrals increased again, apart from the substituted ethylene (6.816 ppm), which continues dropping consistently. Hence interpreted as to the 2 sprayings sample being more favorable than the control, and the 8 and 10 sprayings samples being less favorable [22, 23, 24].
- Fenugreek: Control shows resonances associated with these classes of compounds and functional groups: acids, esters, RCH2O-, CH3CO-, and R3CH, and R2CH2. These functional groups and classes of compounds are consistent with the reported chemical compositions of fenugreek seeds and leaves below. Compared to the control, the absence of apparent resonance at 27.4 ppm and additional apparent resonances at 34.1 and 29.6 ppm in 2 sprayings sample indicates the compounds that enhanced the bitterness of the 2 sprayings sample. In the 6 sprayings sample, the additional apparent resonances at 21.9 ppm and 20.2 ppm indicated changes that lead to the loss of the bitter taste
- Cumin: The C-13 CPMAS spectrum of control suggests the presence of these classes of compounds and functional groups: C=O, alkenes, RCH2O-, R3CH, R2CH2, and CH3CO-. In the 2 sprayings sample, the additional resonance at 21.9 ppm relative to the control and apparent increase in the intensity of the resonances suggests a more complex number of flavor compounds, whereas the 6 sprayings sample is lacking cuminaldehyde which is related to the absence of the peak at 17.8 ppm.
• Black Cumin: The number of CH3 (and CH3 aromatic) groups are the same in all samples. However, there is a slight decrease in the CH2 groups, and a slight increase in the CH groups in the sample sprayed 10 times, suggesting the changes in the seed structure upon spraying.
• Coriander: The NMR spectrum of control shows peaks that are typical of C=O (acids), C=C, RCH2O-, CH3CO-, R3CH, and R2CH2 functional groups. In the 2 sprayings sample, the additional peaks at 26.9 ppm and 22.4 ppm relative to the control are due to increased concentrations of essential oils and fatty acids, which leads to the increased taste and aroma. The7 sprayings sample lacks an apparent resonance at ~27 ppm and apparent resonances at 26.9 and 22.3 ppm that is correlated with the reduced taste and aroma.
• Cardamom: The 1H NMR spectrum reveals the presence of a three proton singlet at δ 2.2 for a CH3 group on an aromatic ring, two peaks each of three-proton intensity at δ 0.7 and 0.9 for CH3. It also shows a CH2 group at δ 1.2. The CH3 group resonances are attributed to the different CH3 groups. The number of CH3 (and CH3 aromatic) groups is the same in all samples. Other peaks are also similar in all samples.
Transmission electron microscopy (TEM): Figure 5 presents the nuclear magnetic resonance spectra of the tested spices. Each spice spectrum is discussed individually below.
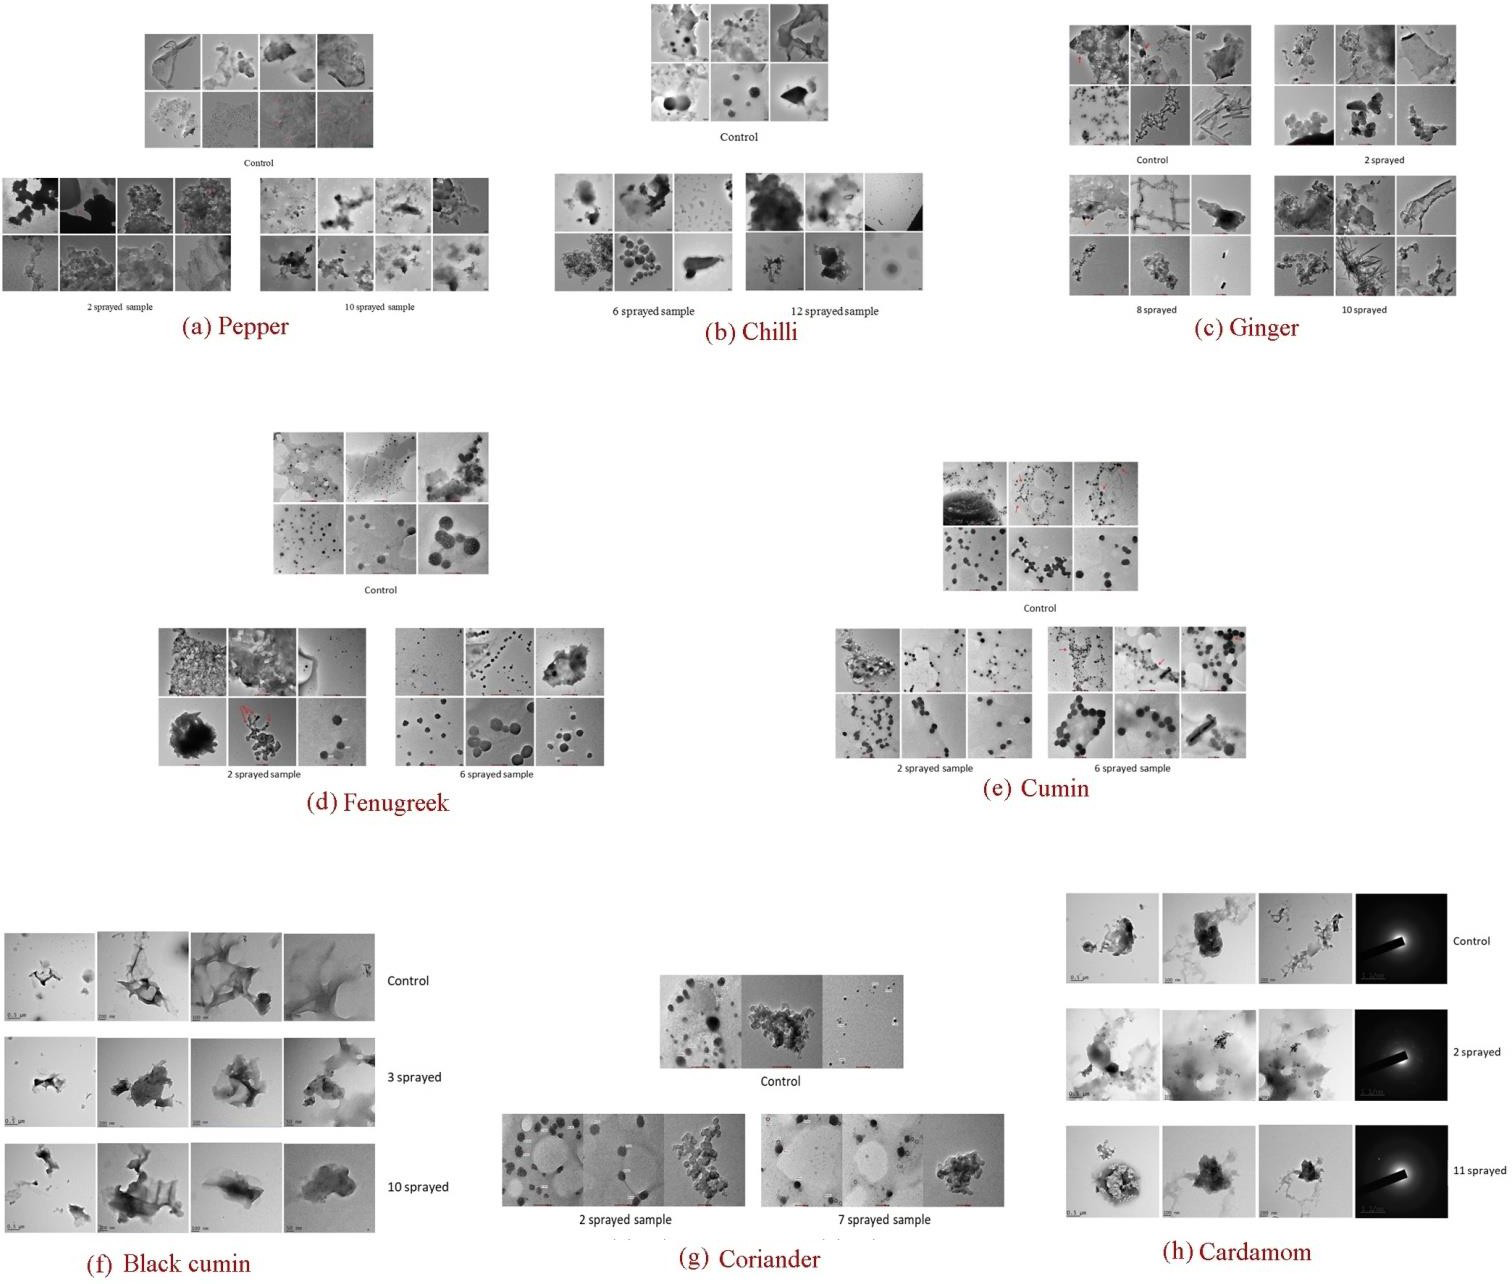
• Pepper: Degree of crystallinity increasing the number of spraying significantly affects the polycrystalline texture of the pepper powder sample. Namely, starting from a polycrystalline texture, in control, where crystallites are abundant, and at least two different crystal phases are observed, 2 spraying leads to a partial loss of crystalline structure, and 10 spraying causes its complete loss, resulting in an amorphous texture. Size of amorphous- shaped fragments: Fragments composing the sample show average size below 1 µm in control, while size increases in both the 2 and 10 sprayings samples (above 1.5 µm, roughly); besides, only in the 2 sprayings sample spherical nanoparticles (10 – 20 nm diameter) are observed, while only in the 10 sprayings sample numerous small fragments (0.1 – 0.5 µm) are observed.
• Chili Pepper: For the control, both 6 and 12 sprayings samples structures appear significantly changed, mainly the type, size and shape of small and nanosized particles, and their spatial relationship with the amorphous fragments. In particular, by 6 sprayings, a disaggregation occured between fragments and individual particles; the size of spherical particle type is one order of magnitude lower than in the control sample (100 – 500 nm in the control, 5 – 50 nm in the 6 sprayed sample), and ellipsoidal nanosized particles are visible, that is not present in the control. Similarly, droplet-like objects are observed; also, these are not present in the control. By 12 spraying, all previously cited particle types are not more observed, with the only exception of droplet-like type.
• Ginger: Compared to control, the responses of the 2 sprayings samples and, to a lesser extent, 8 and 10 sprayed samples show some significant changes in the sample structure; each spraying causes loss of the original particulate composition and features. After 2 sprayings the results are the absence of one particle type (needle-like), absence of individual nanosized particles, changes in the shape of nanoparticles clustering (nest- like instead of chain-like of the control) and the size and shape of nanoparticles themselves (larger size; wavy contour instead of regular contour), the presence of sponge-like large particles (not present in the control). 8 spraying mainly results in the presence of fiber-like particles, that show an organized reciprocal orientation, and of chalk- like particles, likely crystalline. After 10 sprayings, the results are the absence of submicron particles, the absence of individual nanosized particles, changes in the shape of nanoparticle clustering (more nest-like than chain-like of the control). In contrast, the size and shape of nanoparticles themselves are similar to the control, changes in size, clustering shape and orientation of needle-like particles (length-to-width ratio far more substantial than in the control, large and dense clusters instead of small ones in control, no preferential orientation), the presence of sponge-like large particles (not present in the control).
• Fenugreek: Compared to control, 2 and 6 sprayings affect the original sample matrix, and each spraying affects it differently. 2 spraying causes a general decrease of the Nano sized particle fraction, and the loss of the ultrafine fraction; also, particles spatial arrangement is different from control since particle clusters are observed, while in the control particles are observed almost only individually. It is anyway possible that the apparent decrease of the Nano sized particle fraction in the 2 sprayed sample is, instead, the result of a more significant clustering arrangement that affects the number of individual particles. The 6 sprayed sample, instead, causes minor changes concerning the abundance of ultrafine and Nano sized particles, concerning control. However, significant changes concern both the spatial arrangement of particles (alignments) and the distribution of mass within a particle. Significant differences are also observed in the aggregates. Concerning control, due to both 2 and 6 sprayings, aggregates appear denser, that is containing more abundant mass, while the distribution of mass within aggregate remains uneven, although the degree of non-homogeneity decreases from 2 to 6 sprayings.
• Cumin: Two sprayings affected the sample matrix mildly, since all features concerning the matrix components, dimensional ranges, morphology of particulates, relative abundances of components, and spatial arrangements are maintained similar to those of the control, with the only exception of the morphology (and distribution of mass) of the “spherical shape” type of aggregate. Differently, 6 sprayings affected the sample more significantly. This concerns both aggregate types and small particles. In the first case, only one of the two types identified in the control and 2 sprayed sample is observed in 6 sprayed sample, and with evident differences of aspect/ morphology; in the second case, small particles show higher numerosity, narrower size range, and partially different spatial arrangement, concerning control and the 2 sprayings samples.
• Black Cumin: The control sample has an amorphous shape. However, small crystalline particles are appearing upon 3 sprayings (increasing the taste and aroma). These small particles are coated on the big particles. These small particles disappeared upon 10 sprayings, which results in decreasing organoleptic properties, namely the taste and aroma. Table 4 presents the inductively coupled plasma - atomic emission spectroscopy (ICP- AES) analysis of black cumin. From table 2, it is observed a reduction in mineral content after the samples being sprayed for 10 times, whereas 3 sprayings has slightly increased the mineral contents.
• Coriander: Control particles present agglomerated individual rounded particles with sizes ranging from 14.5 to 88 nm. These particles contain organic compounds such as fatty acids, volatile oil, CHO and also C, O2, Cu, Si, K, Ca, Co. The 2 times sprayed sample has individual rounded particles ranging from 57.5 to 84.7 nm that present agglomeration as well; the particles contain C, O2, Fl, Mg, K, S, Cl, Ca, Cu, and linolenic acid, camphor, cyclohexanol acetate. The changes in the particle size are related to the increase in the taste and aroma. The 7 sprayings sample showed both individual rounded particles and agglomeration of these rounded particles, but the agglomeration is in lesser degree but with higher density. The particles present a size of 49.9 nm and are ring-like structures. The larger particle (100nm-120nm) is denser and similar to the control particle. Contains C, O2, Si, K, Ca, Co, Cu. The ring-like structure is related to the difference in the profile compared to control and the 2 times sprayed samples.
• Cardamom: The structure of the sample has been broken upon spraying. The 2 times sprayed sample, which is easily dissolvable, shows a clear different response in the TEM analysis. While the TEM images of the 11 sprayings samples are more or less similar to the control sample, there is evidence of tiny particles (generated due to the spraying). The aroma and taste of the sample follow the TEM response.
Spices and Action of 2-6 Μm Mid-IR on the Spices: Culinary spices have been historically used for their medicinal properties and health benefits. They contain phytochemicals that can boost protective immunity, reduce respiratory viral burden, and offer therapeutic benefits against various diseases [25, 26, 27]. Culinary herbs and spices, such as those from the genera Curcuma and Zingiber, have been found to have therapeutic benefits in managing Type 2 Diabetes Mellitus and Alzheimer’s Disease [28]. Additionally, spices commonly used in Indian kitchens, such as cumin, cardamom, and cloves, have pharmacological activities that enhance appetite, digestion, and possess anti-inflammatory and analgesic properties [29]. Furthermore, spices like Xylopia aethiopica, Piper guineense, and Rhaphiostylis beninensis are rich in bioactive components with antioxidant, antimicrobial, and anti-inflammatory properties, making them potential lead compounds for drug and nutraceutical formulation.
In pepper, sensory quality parameters include aroma, flavor, color, pungency, and taste. Capsaicinoids are responsible for the pungency, carotenoids and flavonoids promote color, and capsaicinoids and esters contribute to the spicy taste [30]. Piperine has its role as a bio-enhancer for other drugs, increasing their absorption and reducing dose-related toxic potential [31]. Chilli pepper sensory quality parameters include texture, flavor, aroma, and color [32, 33]. Capsaicinoids, including capsaicin, have shown promising potential in the fight against cancer and have been extensively studied for their biological activities [34]. In Ginger sensory quality parameters include color, flavor, tenderness, juiciness, and overall acceptability [35]. Studies have shown that gingerol can enhance cellular immune responses in human neutrophils [36]. The studies found that the sensory parameters of fenugreek, include odour, taste, and mouth sensation [37]. Fenugreek seed lipids consist mainly of triacylglycerides, with oleic acid and linoleic acid found preferentially in the 2 and 1,3 positions of the glycerol backbone, respectively [38]. Cumin and black cumin seeds are rich in oleic acid, which is the main fatty acid found in the fixed oil of cumin seeds [39]. Coriander sensory parameters include flavor, aroma, color, taste, spiciness, aftertaste, and warm sensation [40]. Enhanced oleic acid in sprayed sample posses beneficial health effects like anticancer, anti- inflammatory, wound healing, immune-enhancing, and macrophage effects. Cardamom sensory parameters include flavor, aroma, color, taste, spiciness, aftertaste, and warm sensation [40]. We studied the effect of mid-IR on the general sensory attributes the spices have.
Invention background, definition, technique of mid-IR generation from MIRGA, toxicological study on MIRGA, safety of the MIRGA sprayed usable and primeval and future scope of MIRGA have been described by Umakanthan, et al. [13] (detailed discussion on MIRGA available in supplementary text T2).
The methodology of 2-6 μm mid-IR application is: Living cells are active in mid-IR region of electromagnetic spectra, because their chemical bonds vibrational frequencies are located in this wavelength range [41]. The instrumentation data showed the molecular level changes [42] due to photo stimulation and photo modulation [43] causing physical and chemical alterations [44, 45] thereby potentiation of spices to our favour. Generally stereo chemical configuration influence sensory attributes [46]. Irradiation, ethylene oxide processing and steam processing found to have improved the sensory characteristics of a few spices, however additional safety processing mostly degrades the food. And consumers acceptance for high dose irradiated food is less [47]. Considering the present technologies, MIRGA is a better choice in terms of easy to perform, safe and economical (USD 0.35/ ton of any spice).
Through the sensory and instrumentation analyses, we illustrated the effect of MIRGA, in compound transformation through GC-MS, and NMR, configuration changes in terms of rearrangement of atoms/ dimensions through XRD and TEM; chemical bond stretching of N–H, C–H, C=O and –OH and –CH3 bond bending through FTIR studies and mineral estimation through ICP-AES. The changes influenced the taste and aroma of spices. Similar desirable results in coffee, tea, cocoaa, edible salts and terminalia were achieved using MIRGA spraying [13, 14, 15, 16]. The inorganic compounds used in the generation of MIR are a perspective for biomedical applications [48, 49]. It is also a new synthesis method for preparation of functional material (2-6 µm mid-IR) [50, 51]. It is well known that the combination of different compounds, which have excellent electronic properties, leads to new composite materials, which have earned great technological interest in recent years [52, 53].
Future benefits of the enhanced spices are: a) reduction of required quantity by 30-40% thereby increasing economy of use, saving natural resources, savings and increasing health benefits, without genetic manipulation; b) planting of MIRGA sprayed seeds may give an enhanced yield with improved characteristics.
Conclusion
This present work successfully improved several spices using the effect of mid-IR. Spices properties were altered by the effect of mid-IR on the chemistry of spices, such as chemical bonds, configuration, chemical compound transformation, resulting in improved spices’ sensory attributes. This improvement led to a reduction of required quantity by 30-40% while cooking, thereby increasing the economy of use, saving natural resources, and increasing health benefits. Finally, it is believed that this methodology could be used in other food products and on seeds that, after cultivation, could yield crop benefits.
Acknowledgement
Authors thank multi-Faculty scientists of different labs, institutions, universities, etc., around the world for their technical guidance and help; also thank Dr. George Tranter, Chiralabs Ltd., Begbroke Centre for Innovation & Enterprise, Oxfordshire, UK; Dr. Jan IC Vermaak, Manager of Engineering, Nuclear Science Center - Texas A&M University, USA; Dr. Takashiro Akitsu, Professor, Department of Chemistry, Faculty of Science, Tokyo University of Science, Japan; Dr. Kam-Hung Low, X-ray Facility manager, Department of Chemistry, The University of Hong Kong; Ms. Satitaphorn Sriphuttha, Tokyo University of Science, Japan; Ms. Shiho Murakami, Mr. Kanai and other Spectroscope specialists of Hitachi High-Tech, Japan; Mr. Gary Powell, Light wind corporation, Petaluma, California, USA; Dr. Senthil Kumar Rajendran, Cell Biology, Biosciences, Åbo Akademi Univesity, Finland; Dr. Ramakrishnan, Head, Indian Veterinary Research Institute, Mukteshwar, India; Dr. R Prabhakaran, Assistant Professor, Department of Chemistry, Bharathiar University, Coimbatore, India; Prof. Dr. Haluk Yucel, Institute of Nuclear Sciences of Ankara University, Tandogan Yerleskesi, 06100, Ankara, Turkey; Dr. Anuradha Das, NISER, Bhubaneshwar; Adriana Pietrodangelo, PhD, C.N.R. Institute for Atmospheric Pollution Research, Italy; Dr. Morteza Erfani, Ray Technology, UK; Mr. Akram Hebaish, Analytical Development Scientist, Australia; Dr.Carlos Romero, Carabobo State University, Venezuela; and other Kolabtree experts; All financiers who funded this research for nearly 2 decades; And we would also like to apologize to all scientists and other helpers around the world who are not cited here now.
Author Contribution
Umakanthan: Conceptualization, Methodology, Supervision, Validation. Madhu Mathi: Data curation, Investigation, Visualization, Writing - Original draft preparation. Umadevi: Project administration, Resources Umakanthan, Madhu Mathi: Writing- Reviewing and Editing.
Competing Interest
In accordance with the journal’s policy and our ethical obligation as researchers, we submit that the authors Dr. Umakanthan and Dr. Madhu Mathi are the inventors and patentee of Indian patent for MIRGA (granted-patent no.: 401387) which is a major material employed in this study.
Data and Materials Availability
All data is available in the manuscript and supplementary materials. https://docs.google.com/document/d/1YCOjnhhUNcKsNH dwM8R8FzlGdYab3acC/edit?usp=sharing&ouid=11110138 7151809704391&rtpof=true&sd=true
Funding
The authors received no specific funding for this research.
References
-
Yashin A, Yashin Y, Xia X, Nemzer B (2017) Antioxidant activity of spices and their impact on human health: A review. Antioxidants (Basel) 6(3): 70.
-
Alezandro MR, Lui MCY, Lajolo FM, Genovese MI (2011) Commercial spices and industrial ingredients: evaluation of antioxidant capacity and flavonoids content for functional foods development. Food Science and Technology 31(2): 527-533.
-
Singh S, Omre PK, Mohan SM (2014) Curry leaves (Murraya Koenigii Linn. Sprengal) – A miracle plant. Indian J Sci Res 4(1): 46-52.
-
Barth J (2019) Pepper: A Guide to the World’s favourite spice. The Rowman & Littlefield, USA.
-
Teng X, Zhang M, Devahastin S (2019) New developments on ultrasound-assisted processing and flavor detection of spices: A review. Ultrasonics sonochemistry 55: 297- 307.
-
Das A, Sharangi AB (2018) Post Harvest Technology and Value Addition of Spices, Indian Spices. Springer, pp: 249-276.
-
Suresh D, Manjunatha H, Srinivasan K (2007) Effect of heat processing of spices on the concentrations of their bioactive principles: Turmeric (Curcuma longa), red pepper (Capsicum annuum) and black pepper (Piper nigrum). Journal of Food Composition and Analysis 20(3-4): 346-351.
-
Shahwar MK, El-Ghorab AH, Anjum FM, Butt MS, Hussain S, et al. (2012) Characterization of coriander (Coriandrum sativum L.) seeds and leaves: volatile and non-volatile extracts. International Journal of food properties 15(4): 736-747.
-
Caporaso N, Paduano A, Nicoletti G, Sacchi R (2013) Capsaicinoids, antioxidant activity, and volatile compounds in olive oil flavored with dried chili pepper (C apsicum annuum). European journal of lipid science and technology 115(12): 1434-1442.
-
Prasad NS (2005) Optical communications in the mid- wave IR spectral band. Springer Science Journal Opt Fiber commun Rep 2, pp: 558-602.
-
Pereira MF, Shulika O (2011) Terahertz and Mid Infrared Radiation: Generation, Detection and Applications. Springer Science, Business Media BV, Netherlands.
-
Waynant RW, Ilev IK, Gannot I (2001) Mid-infrared laser applications in medicine and biology. Phil Trans R Soc Lond A 359(1780): 635-644.
-
Umakanthan T, Mathi M (2022) Decaffeination and improvement of taste, flavor and health safety of coffee and tea using mid-infrared wavelength rays. Heliyon 8(11): e11338.
-
Umakanthan T, Mathi M (2022) Quantitative reduction of heavy metals and caffeine in cocoa using mid-infrared spectrum irradiation. Journal of the Indian Chemical Society 100(1): 100861.
-
Umakanthan T, Mathi M (2023) Increasing saltiness of salts (NaCl) using mid- infrared radiation to reduce the health hazards. Food Science & Nutrition 11(6): 3535- 3549.
-
Umakanthan T, Mathi M (2023) Potentiation of Siddha medicine using Muppu (Universal Potentiator). International Journal of Pharmaceutical Research and Applications 8(4): 2070-2084.
-
Everitt M (2009) Consumer-Targeted Sensory Quality. Global Issues in Food Science and Technology, pp: 117- 128.
-
Wichchukit S, O’Mahony M (2014) The 9-point hedonic scale and hedonic ranking in food science: some reappraisals and alternatives. Journal of the Science of Food and Agriculture 95(11): 2167-2178.
-
Sales-Campos H, Souza PRD, Peghini BC, Silva JSD, Cardoso CR (2012) An Overview of the Modulatory Effects of Oleic Acid in Health and Disease. Mini reviews in medicinal chemistry 13(2): 201-210.
-
Knutsen HK, Alexander J, Barregård L, Bignami M, Brüschweiler B, et al. (2016) EFSA Panel on Contaminants in the Food Chain (CONTAM). Scientific Opinion on erucic acid in feed and food. EFSA Journal 14(11): 4593.
-
Siddiqui SI, Rathi G, Chaudhry SA (2018) Acid washed black cumin seed powder preparation for adsorption of methylene blue dye from aqueous solution: Thermodynamic, kinetic and isotherm studies. Journal of Molecular Liquids 264: 275-284.
-
Badertscher M, Bühlmann P, Pretsch E (2009) Structure Determination of Organic Compounds. Springer.
-
Leila G, Mohammadi M, Najafpour GD, Nikzad M (2017) Piperine-The Bioactive Compound of Black Pepper: From Isolation to Medicinal Formulations. Comprehensive Reviews in Food Science and Food Safety 16(1): 124- 140.
-
Clarke S (2008) Essential Chemistry for Aromatherapy. 2nd(Edn.), Science direct, pp: 123-229.
-
Kumar MD, Sharma D (2023) Culinary spices and herbs in managing early and long-COVID-19 complications: A comprehensive review. Phytotherapy Research 37(11): 4908-4931.
-
Yasodha S, Sundralingam U, Goh AST, Men TK, Min KVJ (2023) The potential of culinary herbs and spices from the genera Curcuma and Zingiber in the management of type 2 diabetes mellitus and Alzheimer’s disease. Journal of Essential Oil Research 35(4): 325-334.
-
Rishabh C, Maqbool M, Chaudhary K, Chauhan S, Dahiya RS (2023) Phyto-Pharmacology of Most Common Indian Culinary Spices and Their Potential in Developing New Pharmaceutical Therapies. Current traditional medicine 10(2): 1-24.
-
Peters JC, Breen JA, Pan Z (2023) Effects of Culinary Spices on Liking and Consumption of Protein Rich Foods in Community-Dwelling Older Adults. Nutrients 15(5): 1172.
-
Evuen UF, Okolie NP, Apiamu A (2022) Evaluation of the mineral composition, phytochemical and proximate constituents of three culinary spices in Nigeria: a comparative study. Dental science reports 12(1): 20705.
-
Freitas MND, Rosa SDVFD, Pereira CC, Malta MR, Dias CTDS (2020) Identification of physiological analysis parameters associated with coffee beverage quality. Ciência e Agrotecnologia 44(1).
-
Bakshi H, Nagpal M, Singh M, Dhingra GA, Aggarwal G (2021) Propitious Profile of Peppery Piperine. Current Molecular Pharmacology 14(4): 477-486.
-
Jing Z, Wang C, Wang J, Yang Y, Han K, et al. (2023) Comprehensive fruit quality assessment and identification of aroma-active compounds in green pepper (Capsicum annuum L.). Frontiers in Nutrition 9: 1027605.
-
Toontom N, Meenune M, Posri W, Lertsiri S (2012) Effect of drying method on physical and chemical quality, hotness and volatile flavour characteristics of dried chilli. International food research journal 19(3): 1023- 1031.
-
Huang XF, Xue JY, Jiang AQ, Zhu HL (2013) Capsaicin and its analogues: structure-activity relationship study. Current Medicinal Chemistry 20(21): 2661-2672.
-
Surachman S, Dewi YSK (2022) Ginger (Zingiber officinale) Mass Ratio on Physicochemical And Sensory Characteristics of Liang Tea. Gorontalo Agriculture Technology Journal 5(2): 1-14.
-
Gaby A, Kahlenberg K, Krautwurst D, Somoza V (2022) [6]-Gingerol Facilitates CXCL8 Secretion and ROS Production in Primary Human Neutrophils by Targeting the TRPV1 Channel. Molecular Nutrition & Food Research 67(4): e2200434.
-
Ghosaliya BK (2018) Effect of Limited Irrigation on Quality Parameters of Fenugreek [Trigonella foenum- graecum (L.)] Genotypes(SKNAU).
-
Ciftci ON, Przybylski R, Rudzińska M, Acharya S (2011) Characterization of Fenugreek (Trigonella foenum- graecum) Seed Lipids. Journal of the American Oil Chemists’ Society 88(10): 1603-1610.
-
Mohamed FR (2020) Cold pressed cumin (Cuminum cyminum) oil. Cold Pressed Oils, pp: 695-702.
-
Ghosh M, Ghosh D, Bhattacharyya N (2022) Cardamom Quality Evaluation Employing Electronic Nose. EasyChair Preprint, pp: 7272.
-
Toor F, Jackson S, Shang X, Arafin S, Yang H (2018) Mid- infrared Lasers for Medical Applications: introduction to the feature issue. Biomed Opt Express 9(12): 6255-6257.
-
Tsai SR, Hamblin MR (2017) Biological effects and medical applications of infrared radiation. J Photochem Photobiol B 170: 197-207.
-
Pollack GH (2015) Cell Electrical Properties: Reconsidering the Origin of the Electrical Potential. Cell Biology International 39(3): 237-242.
-
Datta SN, Trindle CO, Illas F (2014) Theoretical and Computational Aspects of Magnetic Organic Molecules. Imperial College Press, London, pp: 224.
-
Yi GC (2012) Semiconductor Nanostructures for Optoelectronic Devices: Processing, Characterization and Applications. Berlin, Heidelberg: Springer-Verlag, pp: 198.
-
Williamson KL, Masters KM (2011) Macroscale and Microscale Organic Experiments. 6th(Edn.), Brooks/ Cole C engage learning, CA, pp: 720.
-
Duncan SE, Moberg K, Amin KN, Wright MA, Newkirk JJ, et al. (2017) Processes to Preserve Spice and Herb Quality and Sensory Integrity During Pathogen Inactivation. Journal of Food Science 82(5): 1208-1215.
-
Tishkevich DI, Korolkov IV, Kozlovskiy AL, Anisovich M, Vinnik DA, et al. (2019) Immobilization of boron- rich compound on Fe3O4 nanoparticles: Stability and cytotoxicity. J Alloys Compd 797: 573-581.
-
Dukenbayev K, Korolkov IV, Tishkevich DI, Kozlovskiy AL, Trukhanov SV, et al. (2019) Fe3O4 nanoparticles for complex targeted delivery and boron neutron capture therapy. Nanomaterials (Basel) 9(4): 494.
-
Kozlovskiy AL, Alina A, Zdorovets MV (2021) Study of the effect of ion irradiation on increasing the photocatalytic activity of WO3 microparticles. J Mater Sci Mater Electron 32(5): 3863-3877.
-
El-Shater RE, Shimy HE, Saafan SA, Darwish MA, Zhou D, et al. (2022) Synthesis, characterization, and magnetic properties of Mnnanoferrites, J. Alloys Compd 928: 166954.
-
Kozlovskiy AL, Zdorovets MV (2021) Effect of doping of Ce4+/3+ on optical, strength and shielding properties of (0.5-x)TeO2-0.25MoO-0.25Bi2O3-xCeO2 glasses. Mater Chem Phys 263: 124444.
-
Almessiere MA, Algarou NA, Slimani Y, Sadaqat A, Baykal A, et al. (2022) Investigation of exchange coupling and microwave properties of hard/ soft (SrNi0.02Zr0.01Fe11.96O19)/(CoFe2O4)x nanocomposites. Mat Today Nano 18: 100186.
- The Role of Podocyte Apoptosis and the Involvement of SIRT1 in Diabetic Nephropathy
- Dealcoholization of Beer by Osmotic Distillation for the Beverage Industry
- Biopolymer-Based Edible Packaging- Biomaterials, Methods, and Applications in Food Industry: An Updated Review
- Influence of Bioprocessing Methods on 'China Rice' (Gawal R1), and Soyabean Supplementation on the Quality of Complementary Food
- Cassava (Manihot esculenta) Varietal Growth, Yield and Cyanide Content Performance in Three Sites in the South- Eastern Semi Arid Regions of Kenya
- Food Waste Treatment, Recycling, Management and Production of Value-Products-An Update on Methodologies and Current Trends