Evaluation of Morphometric Differences among Local Chicken Populations in Doba and Mesala Districts, West Hararghe Zone, Ethiopia
The study was conducted in the Doba and Mesala district of the West Hararghe Zone, Oromia Regional State, Ethiopia to evaluate the morphometric difference among indigenous chicken populations. Samples were selected purposively based on the extent of chicken production potential and the agroecology of the districts. From each district, three kebeles were selected and 200 respondents (102 from the Doba and 98 from Mesala) were randomly selected from households included in the study for the questionnaire survey. A total of 420 adult live chickens of both sexes, 210 chickens (92 male and 118 female) older than 24 weeks from Doba, and 210 chickens (65 male and 145 female) from Mesala were employed for gathering information on both quantitative and qualitative traits. Multivariate variance analysis was used to determine major traits that differentiate the chicken population. Canonical discriminant multivariate statistical analysis was conducted for more powerful trait comparisons. Stepwise discriminant analysis was conducted to check the discriminating power of the traits. For both male and female hens, the stepwise discriminate analysis showed that the majority of quantitative variables showed significant (p<.0001) discriminating power in phenotypic variation. The Wilks' Lambda test reveals that differences within populations, rather than the variation between populations were accountable for 43% of the variability in the female sample population and 68% in the male sample population. Agro-ecologically sound and community-based genetic improvement programs should be developed and implemented with the inclusion of breeding objectives, trait preferences, and a production system that is focused on the market. Generally, there were morphological trait variations observed among the indigenous chicken populations across the study districts and between sexes, which suggests that there is an opportunity for genetic improvement through selection. Thus, farmers should get technical support on how to select the best indigenous chicken for breeding purposes and the formulation of a breeding plan should be implemented to conserve indigenous chicken genetic resources for genetic improvement strategies.
Introduction
Poultry production is one of the integral parts of livestock farming activities in the country. Indigenous chickens are owned by smallholder farmers and they are widely widespread almost in every rural area of the country to supply eggs and meat. In Ethiopia, local chickens are found in huge numbers distributed across different agro ecological zones under a traditional family-based scavenging management system and variations in morphological and morphometric traits are common among local chicken populations. However, they showed a diverse variation in their production environment that may be due to their widespread distribution and adaptive response to different ecological conditions [1, 2, 3, 4]. The local chickens that have mainly been selected naturally or by the farmers who keep them for their adaptive fitness to a specific area are often poor in their egg production and characterized by late maturation as well as long broodiness due to the prevalence of diseases and predators, low genetic potentials, feed shortage and limited feed resources, constraints related to institutional, infrastructural, socio-economic and the economic contribution of local chicken is not proportional to their huge number [5]. Therefore, identifying adapted local chicken genotypes for market requirements, genetic improvement, and production circumstances through investigation of morphometric variation of local chickens for future improvements should be inhaled.
Several researchers have tried to investigate the morphometric differences such as body length, chest circumference, shank length, keel length, and wing length. The identification of breeds important for selection in breeding programs for genetic improvement chickens. The importance of information on breed identification of local chicken has been studied by many scholars. However, the morphometric and morphological variation, within and between local chickens in the study area are not studied. Thus, the objective of this study is to evaluate the morphometric differences of local chicken’s population in the study area.
Materials and Methods
Description of the Study Area
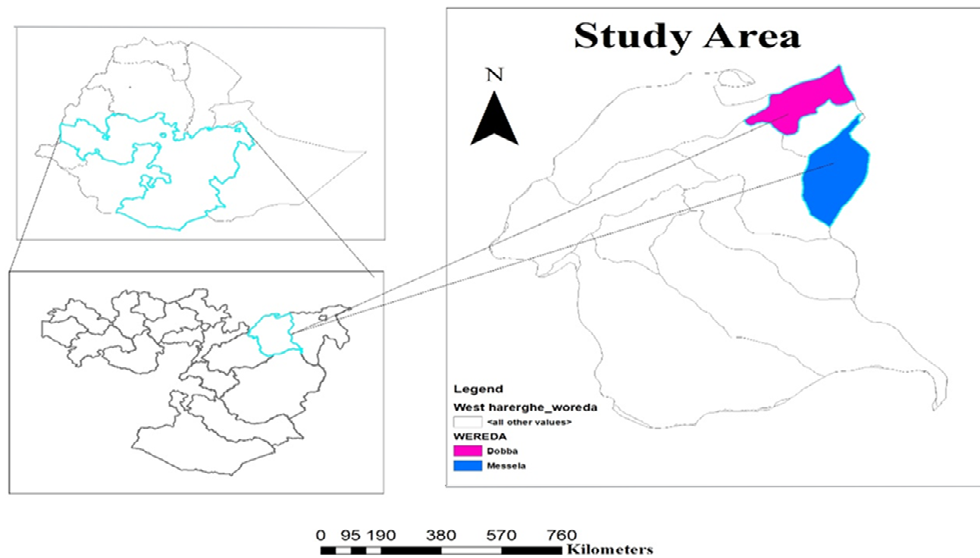
The study was conducted in the West Hararge zone of Oromia Regional State. Two districts namely Doba and Mesala districts were selected purposively based on their extent of chicken production potential and agroecology. The Doba district is located in West Hararge zone Oromia Regional State at a distance of 382 Km from East Addis Ababa at 9° 15’ N latitudes and 41° 00’ E longitudes with an altitude of the area ranging from 1200 to 2200 meters above sea level. The district capital town is also called Doba and is located 10 Km from the Hirna, turning inside the main highway from Addis Ababa to Harar, in the Northeast and North it has a border with the Somali region of Bike and Afidem district that is found on the main railroad of Ethio- Djibouti. The total land mass is about 730 sq. km, divided into 33 kebele (31 rural and 2 urban). The lowland agro- ecological zone is dominantly characterized by a mixed farming system. Mesala district is situated in the Southeast highlands of Ethiopia. The astronomical location of the district is between 8045’00’’N to 9010’30’’N latitude and 47005’30’’E to 47017’30’’E 14 Longitude. The district is one of the seventeen districts of the Western Hararghe zone of the Oromia Regional State. It is located at a distance of 69 km away from Chiro, the capital town of the West Hararghe zone, and 395 km from Addis Ababa, the capital city of Ethiopia. The district shares a boundary line with the Melka Balo district on the Southeast, East, and Northeast, the Chiro district on the West and Tullo district on the North and Northwest, and the Gemachis district on the South and Southwest. Based on the data obtained from the district agriculture office, from the total land of the district about 654.4 1 km2 of land is under agriculture, 326.81 km2 is under forest, 15.17 km2 is used for grazing land and 7.54 km2 is for other land use. In general Mesala district produces cereals, and pulses and oil crops are major crop production activities. These annual cereals contribute a large amount of production followed by pulses and oil seeds. Over 50 km2 of land is planted with this crop and chat. Coffee grown in Mesala is well known for its high quality. As data obtained from the district livestock agency indicate, the district has 210595 cattle, 71041 goats, 52836 sheep, 216 horses, 228 mules, 11300 donkeys, 445 camels, and 254889 chickens. The three characteristics of the agro-climatic zone represented in the district are 15% lowland, 20% midland, and 65% highland area covering the total land of the district. The climate of the district is moderately cool air condition and experiences a mean monthly minimum and maximum temperature ranging from 16oC-20oC and 20oC- 24oC respectively. The remaining type is cool and moderately warm having temperature ranges of 10oC-15oCand 24oC- 28oC respectively. The annual rainfall of the district ranges from 700mm-1000mm and the average rainy days are 180 days per year. The rainfall pattern is bi-modal, which are short rainy seasons in the Belg season from March to April and a long rainy season in the Meher season from June to September (Figure 1).
Multivariate Analysis
Multivariate analyses were used to investigate the morphological variables and quantify differences between sex and populations.
Discriminant Analysis
The quantitative variables from female and male chickens were separately subjected to discriminant analysis (PROC DISCRIM of SAS version 9.4) which is most important to validate the differences between different ecotypes according to morphological or morphometric structural models with the relationship between independent and dependent variables. Stepwise Analysis A stepwise discriminant analysis procedure (PROC STEPDISC of SAS, version 9.4) was run to determine the best combination of variables that would differentiate the study ecotypes.
Canonical Discriminant Analysis
The canonical discriminant analysis measures the strength of the overall relationship between the linear composite of the predicted set of variables. The canonical discriminant analysis (SAS, version 9.4) program used was used to identify certain differences in the existence of population-level phenotypic variation by taking sample chicken ecotypes in the study area.
Multivariate Analysis
Multivariate discriminant analysis was conducted using quantitative traits for male and female chickens separately to distinguish significant discriminative traits; obtain distances between sample populations; determine correct assignments of each bird and observe the spatial distribution of sample populations.
Stepwise Discriminate Analysis for Female Chickens
The result of the stepwise discriminant analysis is presented in Table 1. The stepwise discriminant analysis was run with eleven quantitative traits (i.e. BL, CC, ShL, CL, CH, EL, SpL, WL, ShC, KL, and BkL) to assess the significance of these traits in discriminating among the sampled chicken population in a stepwise fashion. The significance of the traits in discriminating among the two chicken ecotypes is evaluated in a stepwise fashion. At each step, the significance of already entered traits is evaluated based on the significance for staying (p-value: 0.15) criterion, and the significance of newly entering traits are evaluated based on the significance for entering (p-value: 0.15) criterion. The stepwise selection procedure stops when no traits can be removed or entered. Stepwise discriminant analysis is used to discover the best subset of discriminator variables to use in discriminating groups. Wilk’s lambda test shows that all traits considered were significant (p<0.0001) contributors to the discrimination of the total ecotypes in separate groups. The best variable that discriminated against the sample female ecotypes was beak length, comb length, and body weight. This result is not in line with the report of Kawole, et al. [6] who suggested that wingspan, shank circumstance, neck length, and chest circumstance as the most discriminating variables for female chickens in the West Hararghe zone. These differences might be associated with agro ecological differences and the care of producers for their flocks.
| Number in Character* | Partial R-square | F value | Pr > F | Wilks’ Lambda | Pr < Lambda | Average squared canonical correlation (ASCC) | Pr>(ASCC) |
|---|---|---|---|---|---|---|---|
| BkL | 0.34 | 134.42 | <0.0001 | 0.66 | <.0001 | 0.34 | <.0001 |
| CL | 0.19 | 63.76 | <0.0001 | 0.53 | <.0001 | 0.47 | <.0001 |
| BW | 0.11 | 31.58 | <0.0001 | 0.47 | <.0001 | 0.53 | <.0001 |
| BL | 0.05 | 14.19 | 0.0002 | 0.45 | <.0001 | 0.55 | <.0001 |
| ElL | 0.04 | 12.47 | 0.0005 | 0.43 | <.0001 | 0.57 | <.0001 |
| ShL | 0.02 | 6.17 | 0.0136 | 0.42 | <.0001 | 0.58 | <.0001 |
Table 1: Significant traits that discriminated among the female chicken ecotypes. *BKL, Beak Length; CL, Comb Length; BW, Body We
Canonical Discriminant Analysis for Female Chicken Ecotypes
The canonical discriminant analysis measures the strength of the overall relationship between the linear composite of the predictor set of a variable. Multivariate statistics for differences between the districts were highly significant (p<0.0001) in all of the four multivariate tests (Wilks’ Lambda, Pillai’s Trace, Hotelling-Lawley Trace, and Roy’s Greatest Root) for female chicken (Table 2).
| Statistic | Value | F Value | Num DF | Den DF | Pr > F |
|---|---|---|---|---|---|
| Wilks’ Lambda | 0.43 | 57.76 | 6 | 256 | <.0001 |
| Pillai’s Trace | 0.58 | 57.76 | 6 | 256 | <.0001 |
| Hotelling-Lawley Trace | 1.35 | 57.76 | 6 | 256 | <.0001 |
| Roy’s Greatest Root | 1.35 | 57.76 | 6 | 256 | <.0001 |
Table 2: Multivariate statistical of female ecotypes.
The Wilks’ Lambda test for the female sample population was 0.43. This indicates that 57% of the variability in the discriminator variables was the difference between the populations. Within a population, variability is important for local chicken improvement through selection rather than between-population variability. Value close one indicates that almost all of the variability is due to within-group differences. A value close to zero indicates that almost all of the variability in the discriminator variable is due to group differences [7].
Pairwise squared Mahalanobis distances between the two districts for female sample populations were highly significant at (p<0.001) across the districts. This shows that female ecotypes have distinct and measurable group differences across the districts (Table 3).
| From District | Doba | Mesala |
|---|---|---|
| Doba | ++ | 5.75 |
| Mesala | 6.11 | ++ |
Table 3: Squared Mahalanobies’ distance between female sample ecotypes.
Stepwise Discriminate Analysis for Male Chickens
All quantitative variables for males were subjected to the STEPDISC procedure of SAS 9.4 and four variables were identified as the best discriminating variables on the step- wise section summary. The best variables that discriminated the sample male ecotypes were chest circumstance, ear lobe length, comb length, and shank length to have more discriminating power in assessing morphological variation among the chicken population sampled (Table 4). By comparing the F value and the P-value statistics for the significant independent variable we can conclude that chest circumstance and ear lobe length have the highest amount of significant discriminating power. The variation in morphological traits observed between chicken ecotype in the present study is in contrast with the result of Petros [8] reported in Eastern Harerghe which reveals that shank length and comb length has more discriminant power. These variables can be used to characterize and differentiate between isolated populations of local chickens.
| Number in Character* | Partial R-square | F value | Pr > F | Wilks’ Lambda | Pr < Lambda | Average squared canonical correlation (ASCC) | Pr>(ASCC) |
|---|---|---|---|---|---|---|---|
| CC | 0.33 | 77.27 | <0.0001 | 0.67 | <.0001 | 0.33 | <.0001 |
| ELL | 0.09 | 16.88 | <0.0001 | 0.6 | <.0001 | 0.39 | <.0001 |
| CL | 0.03 | 4.83 | 0.0295 | 0.58 | <.0001 | 0.42 | <.0001 |
| ShL | 0.02 | 2.34 | 0.1278 | 0.57 | <.0001 | 0.43 | <.0001 |
Table 4: Significant traits that discriminated among the male chicken ecotypes. Cc=Chest Circumstance; ELL= Ear Lobe Length; CL =
Canonical Discriminant Analysis for Male Chicken Ecotypes
All multivariate statistics for differences between the district was significant (p<0.01) in all of the four multivariate tests (Wilks’ Lambda, Pillai’s Trace, Hotelling-Lawley Trace, and Roy’s Greatest Root). Wilks’ Lambda for the male sample populations shows that most (68%) of the variability in the discriminator variables was due to differences within populations rather than the variation between populations (Table 5).
| Statistic | Value | F Value | Num DF | Den DF | Pr > F |
|---|---|---|---|---|---|
| Wilks’ Lambda | 0.68 | 8.56 | 8 | 148 | <.0001 |
| Pillai’s Trace | 0.32 | 8.56 | 8 | 148 | <.0001 |
| Hotelling- Lawley Trace | 0.46 | 8.56 | 8 | 148 | <.0001 |
| Roy’s Greatest Root | 0.46 | 8.56 | 8 | 148 | <.0001 |
Table 6: Multivariate statistical of male ecotypes.
The discriminant function is estimated by measuring the generalized squared distance. The Mahalanobis distances (Table 6) among all pair-wise comparisons were significant (P<0.001). The greatest distance value was observed between male ecotypes when compared with the female chicken population, though the distance obtained among all the populations was significant. The distance obtained in the present study is lower than what Petros [8] obtained in morphological variation between male local chicken ecotypes. This may be due to less interaction of two ecotypes in a socio-economic relationship.
| From district | Doba | Mesala |
|---|---|---|
| Doba | ++ | 1.18 |
| Mesala | 15.11 | ++ |
Table 5: Squared Mahalanobies’ distance between male sample ecotypes.
Univariate Analysis
Univariate analysis of variance (ANOVA) reveals highly significant (P<0.0001) differences in Chest circumstance, Shank length, Ear lobe length, and Beak length (Table 7). By comparing the F value and the highest amount of significant discriminating potential wattle length has the least amount to discriminate both districts followed by comb length and body weight.
| Variable | Pooled STD | Between STD | F Value | P-value |
|---|---|---|---|---|
| Body weight | 0.9982 | 0.1099 | 2.54 | 0.1114 |
| Chest circumstance | 0.9629 | 0.3872 | 33.95 | <.0001 |
| Shank length | 0.9578 | 0.4111 | 38.69 | <.0001 |
| Comb length | 0.9986 | 0.1011 | 2.15 | 0.1432 |
| Ear lobe length | 0.9608 | 0.3973 | 35.91 | <.0001 |
| Wattle length | 1.0003 | 0.0601 | 0.76 | 0.3843 |
| Beak length | 0.892 | 0.6415 | 108.63 | <.0001 |
Table 7: Univariate test statistics.
Discriminant Analysis Classification for Males and Females
The overall average error count estimate was 13% for all observations from all districts, which means that 87.01 percent of the samples were correctly classified (Table 8).
The correct classification for the female sample population ranged from 86.44 to 87.59% in the study districts. This result is close to the finding of Kebede, et al. [9] who suggested that the correct classification for the female sample population ranged from 88.89 to 100 percent in Northwestern Ethiopia.
| From district | Districts | ||
|---|---|---|---|
| Doba | Mesala | Error Count Estimates | |
| Doba | 102 (86.44) | 16(13.56) | 0.14 |
| Mesala | 18 (12.41) | 127 (87.59) | 0.12 |
| Average error count estimates | 0.13 | ||
| Correct classification (%) | 87.01 | ||
| Doba | Mesala | Error Count Estimates | |
| Doba | 83 (90.22) | 9(9.78) | 0.09 |
| Mesala | 28 (43.08) | 37(56.92) | 0.43 |
| Average error count estimates | 0.26 | ||
| Correct classification (%) | 74 |
Table 8: Number of observations and percent classified (in bracket) for female sample population using discriminant analysis.
The error count estimate for male populations was higher than for female populations (26%) with a correct classification of 74% (Table 9). Among both districts’ male chicken ecotypes, Mesala had the least correct classification while Doba had the higher correct classification. This indicates that the sample population from Doba was more homogeneous on the quantitative variables while Males from Mesela were more heterogeneous than in Doba.
References
-
Tadelle D, Kijora C, Peters KJ (2003) Indigenous chicken ecotypes in Ethiopia: Growth and feed utilization potentials. International Journal of Poultry Science 2(2): 144 152.
-
Mogesse HH (2007) Phenotypic and genetic characterization of indigenous chicken populations in Northwest Ethiopia. Bloemfontein, South Africa, pp: 1-175.
-
Moges F, Mellesse A, Dessie T (2010) Assessment of village chicken production system and evaluation of the productive and reproductive performance local chicken ecotype in Bure district, North West Ethiopia. African Journal of Agricultural Research 5(13): 1739-1748.
-
Getachew B, Kefelegn K, Nagasi A (2015) On-farm phenotypic characterization of indigenous chicken and their production system in Bench Maji zone, southwestern Ethiopia. Afr J Online 4(1): 68-73.
-
Bekele G, Kebede K, Amaha N (2016) Study of the indigenous chicken production system in Bench Maji Zone, South-Western Ethiopia. Global Journal of Science Frontier Research: D Agriculture and Veterinary 16(2): 1-11.
-
Kawole BW, Mengesha YT, Zeleke NA (2019) On-farm phenotypic characterization of indigenous chicken ecotypes in West Hararghe zone, Oromia region, Ethiopia. Journal of Veterinary Medicine and Animal Sciences 2(1): 1009.
-
Brown MT, Tinsley HEA (2018) Discriminate analysis. Journal of Leisure Research 15(4): 290-310.
-
Ergicho P (2017) On-farm Phenotypic Characterization of Indigenous Chicken Ecotypes, Breeding, And Husbandry Practices in Eastern Hararghe zone, Oromia Region, Ethiopia. Haramaya, Ethiopia 2(1): 1009.
-
Kebede FG, Komen H, Dessie T, Alemu SW, Hanotte O, et al. (2021) Species and phenotypic distribution models reveal population differentiation in Ethiopian indigenous chickens. Front Genet 12: 723360.
- The Role of Podocyte Apoptosis and the Involvement of SIRT1 in Diabetic Nephropathy
- Dealcoholization of Beer by Osmotic Distillation for the Beverage Industry
- Biopolymer-Based Edible Packaging- Biomaterials, Methods, and Applications in Food Industry: An Updated Review
- Influence of Bioprocessing Methods on 'China Rice' (Gawal R1), and Soyabean Supplementation on the Quality of Complementary Food
- Cassava (Manihot esculenta) Varietal Growth, Yield and Cyanide Content Performance in Three Sites in the South- Eastern Semi Arid Regions of Kenya
- Food Waste Treatment, Recycling, Management and Production of Value-Products-An Update on Methodologies and Current Trends