Determination of Predictive Model for the Saccharification Steps of Breadfruit Starch Hydrolysis by Amyloglucosidase using a Statistical Approach
Saccharification is a multifaceted biochemical process that entails the breakdown of glycosidic bonds in starch into simpler components. A statistical approach was employed to optimize the saccharification steps of breadfruit starch hydrolysis using amyloglucosidase. The optimal conditions for the hydrolysis were determined by utilizing a pure culture of thermostable amyloglucosidase, with enzyme activity evaluated across different pH levels, temperatures, and time durations. A completely randomized experimental design (3 x 3 x 12) was applied, incorporating 3 pH levels (4.0, 4.5, and 5.0), 3 temperatures (50, 55, and 60 °C), and 12 time intervals (6, 12, 18, 24, 30, 36, 42, 48, 54, 60, 66, and 72 hours). The collected data were analyzed using multiple regression, and the correlation between the variables was evaluated. The results indicated that the p-values for model terms related to dry weight, reducing sugar, and dextrose equivalent were statistically significant (p < 0.05). Additionally, the R² values of 92.5% for dry weight, 82.6% for reducing sugar, and 88.8% for dextrose equivalent demonstrated strong correlations, effectively representing the relationships between the selected variables. The optimal levels of reducing sugar and dextrose equivalent were 71.71% and 93.13 DE, respectively, under the conditions of pH 4.0, 60 °C, and 72 hours. This model successfully depicted the relationship between the actual variables and the predicted outcomes, with the glucose produced from the optimized process potentially serving as a precursor for isomerization in the production of fructose syrup.
Pele GI¹*, Pele EO², Sajo OS³ and Adisa AM³
¹Department of Human Nutrition and Dietetics, Federal University of Health Sciences, Ila- Orangun, Nigeria ²Department of Food Technology, Federal Polytechnic, Offa, Nigeria ³Department of Food Science and Technology, Joseph Ayo Babalola University, Ikeji-Arakeji, Nigeria
Introduction
Starch forms a significant portion of the carbohydrates consumed globally, functioning as the main carbohydrate source in the human diet [1]. It consists of two key polymers: amylose and amylopectin. In most natural starches, amylose constitutes between 10% and 30%, while amylopectin makes up about 70% to 90% [2]. Amylose is a linear polysaccharide that consists entirely of D-glucose units linked by α-1,4-glycosidic bonds, which gives it specific structural and functional roles in various food applications. As noted by Aboje [3], amylopectin, in contrast, has a branched structure made up of α-1,4-glycosidic bonds between glucose molecules, with occasional α-1,6-glycosidic bonds causing branching. According to Ayoola, et al. [4], starch is crucial in producing a variety of valuable products, such as organic acids, amino acids, glucose-fructose syrups, maltose, and glucose, all of which are important in the food and pharmaceutical industries. Alpha-amylase, described by Bello-Perez, et al. [2], is a vital enzyme that facilitates starch hydrolysis. This enzyme acts endo-wise, breaking down the α-1,4-glycosidic bonds, and sometimes the branched α-1,6- glycosidic bonds, within the interior of starch molecules. The primary products of this hydrolysis process are maltose, smaller oligosaccharides, and dextrin, as discussed by Betiku, et al. [5]. On the other hand, amyloglucosidase is an exo-acting enzyme, which predominantly targets the α-1,4- glycosidic bonds at the non-reducing ends of starch chains, ultimately producing glucose molecules [2]. The process of acid conversion, as discussed by Betiku, et al. [5], faces several obstacles. These include the need for materials resistant to corrosion due to the acidic conditions, the production of high levels of color and salt ash after neutralization, increased energy demands for heating, and challenges in process control due to its exothermic characteristics. Starch can be converted into oligosaccharides and glucose through various methods, including acid, acid-enzyme, and enzyme-based processes. According to Fagain [6], the enzymatic method involves a high-energy liquefaction and saccharification process, primarily achieved through high-temperature hydrolysis using alpha-amylase and amyloglucosidase. Although corn is the main raw material for producing glucose and fructose syrups, Ayoola, et al. [4] highlight that alternative plant sources, such as cassava, wheat, and potatoes, are also used. This range of raw materials is often necessary due to the limited availability of corn in many developing countries.
The breadfruit tree, Artocarpus altilis, is highly valued for its nutritious fruit, which is a staple food in many Pacific Islands [7]. Ripe breadfruits offer a range of culinary possibilities, including raw consumption, cooking, steaming, frying, baking as flour, roasting, freeze-drying, or traditional fermentation [8]. Breadfruit is notable for its gluten-free nature, low fat and cholesterol levels, and high content of complex carbohydrates [9]. While research has explored its potential use in chick feed, findings suggest that breadfruit results in lower weight gain compared to cassava or yam, despite its higher consumption. Breadfruit is characterized by a moderate glycemic index, which provides a gentler effect on blood sugar levels compared to white potatoes, white rice, and white bread. It also has a low fat content and contains moderate amounts of essential vitamins and minerals [10]. With starch making up over 60% of its carbohydrate content, mature breadfruit is a significant carbohydrate source [7]. This specific objective of the study is to develop a predictive model for the saccharification steps in the hydrolysis of breadfruit starch by Amiloglucosidase using a statistical approach.
Materials and Methods
Materials
Maltodextrin with an optimal reducing sugar content of 14.88% and a dextrose equivalent (DE) of 12.30 was produced under conditions of pH 6.5, 70 °C, and 60 minutes. This maltodextrin was derived from the liquefaction of cassava starch using alpha-amylase Pele, et al. [11]. A pure culture of thermostable amyloglucosidase, sourced from Aspergillus niger and active at pH 4.5 and 60 °C, was obtained from the Federal Institute of Industrial Research, Oshodi (FIIRO) in Nigeria. Rochelle salt and Dinitrosalicylic acid (DNS) were purchased from Pascal Store in Akure, Nigeria.
Description of Fermentor
A prototype fermentor was designed and constructed to work in conjunction with a thermostatic water bath (DK-600 SANFA Electrical thermostatic water bath boiler model) for the processes of liquefaction and saccharification, as depicted in Figure 1. The fermentor is equipped with a variable motor Gear: GIFA Transmission Bologna Italy, Type (TIPO): (Var 10/0), Code (Condice): AC3999 Motor.
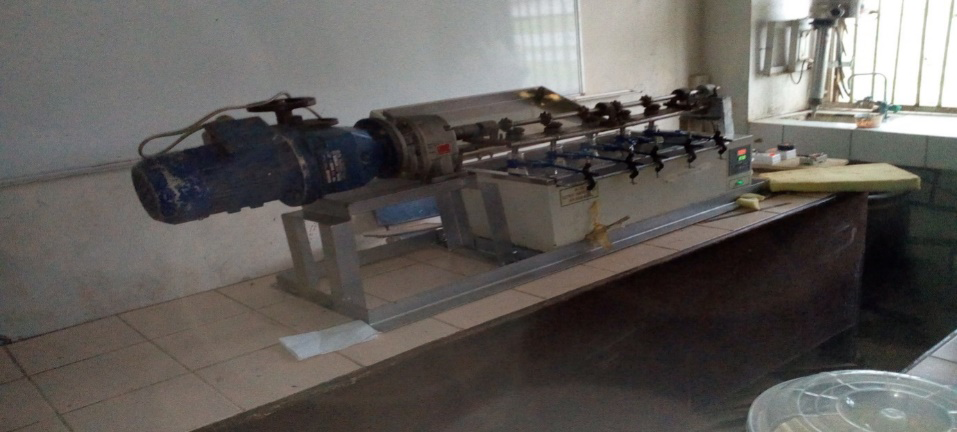
Figure 1: The fermentor used for liquefaction and Saccharification. Note: (Motor) Kw: 0.75; Poles: 4; Rpm min–rpm max: 350–1750; Type: mas 20P; Code: 29602117; Mount POS: 2.5.4. Bonfiglioli Riduttori, Italy. Production of Substrate The substrate was prepared by creating a 10% (w/v) breadfruit starch suspension with distilled water to form a 10% slurry [11]. Specifically, 10 grams of starch was dissolved in 100 mL of distilled water to make the slurry. A 40 ppm Ca²⁺ solution was added to stabilize the enzyme. The pH of the mixture was adjusted to 6.0, 6.5, and 7.0 using citrate-phosphate buffer, respectively. Gelatinization was achieved by heating the mixture to 97°C and maintaining this temperature for 10 minutes. The gelatinized starch was then cooled to 65°C, 70°C, and 75°C, respectively. Liquefaction was performed by adding 2% (w/v) alpha-amylase for durations of
40, 50, and 60 minutes at these temperatures. The fermentor was connected to the thermostatic water bath and set to 50 rpm, with samples taken at regular intervals to monitor the kinetics. Enzyme activity was halted by heating the mixture to 97°C for 15 to 20 minutes, followed by centrifugation (80-2 Centrifuge, Med-Lab Scientific Company, England) at 2500 rpm for 10 minutes to collect the supernatant. The entire procedure was conducted in triplicate. A standard curve of glucose production was prepared to determine the optimal conditions for the liquefaction of breadfruit starch, which was then used as the substrate for the saccharification process.
Characterization of Amyloglucosidase
The optimal conditions for the hydrolysis of breadfruit starch were determined using a pure culture of thermostable amyloglucosidase for the saccharification process. Enzyme activity was assessed under varying pH levels, temperatures, and time intervals. A 3 x 3 x 12 completely randomized experimental design was utilized, consisting of three pH values (4.0, 4.5, and 5.0), three temperatures (50°C, 55°C, and 60°C), and twelve time intervals (6, 12, 18, 24, 30, 36, 42, 48, 54, 60, 66, and 72 hours) for saccharification.
Determination of Enzyme Activity in Amyloglucosidase
The optimal samples obtained from the liquefaction process were cooled to 50°C, 55°C, and 60°C and adjusted to pH levels of 4.0, 4.5, and 5.0, respectively, using diluted hydrochloric acid. Saccharification was initiated by adding 2% (w/v) amyloglucosidase, with reaction times of 6, 12, 18, 24, 30, 36, 42, 48, 54, 60, 66, and 72 hours at the set temperatures and pH levels. To maintain uniform agitation, the fermentor was secured with a thermostatic water bath at 50 rpm, and samples were periodically collected. Enzyme activity was halted by heating the mixture to 97°C for 15 to 20 minutes, followed by centrifugation at 2500 rpm to separate the supernatant for analysis. All procedures were performed in triplicate, and a glucose standard curve was prepared to determine the optimal conditions for saccharification in the hydrolysis of breadfruit starch.
Determination of Physicochemical Properties of Glucose Syrup
Determination of Reducing Sugar
The reducing sugar content in the syrup samples was determined using the DNS method as outlined by Miller [12], with the inclusion of Rochelle salt. For the analysis, 3 ml of DNS reagent was added to 1 ml of the hydrolyzed starch (supernatant) in a test tube, followed by boiling the mixture for 10 minutes. After partial cooling, 1 ml of Rochelle salt was introduced, and the solution was allowed to cool completely. The absorbance of the resulting red-colored solution was then measured at 540 nm using a UV-Visible Spectrophotometer (AJ-1C03). A series of glucose standards (ranging from 0 to 500 mg/l) were prepared, and a standard curve was plotted to quantify the reducing sugar. The percentage of reducing sugar was calculated based on the ratio of reducing sugar present in the glucose syrup to the starch slurry used for hydrolysis.
$$\text{Reducing Sugar (mg/ml)} = \frac{\text{Conc. obt (mg/l) X vol. of extractX dil. factor (if any)}}{\text{Sample wt X vol of aliquot analysed}}$$
Determination of sample dry weight of glucose samples
Two grams of each sample were precisely measured using an analytical balance and placed into pre-dried, cooled, and pre-weighed dishes. These dishes, containing the samples, were then placed in a Genlab moisture extraction oven set to 105°C and dried for 3 hours. After drying, the samples were removed using laboratory tongs and transferred to a desiccator to cool for 30 minutes. Once cooled, the samples were reweighed, and the weights were recorded. This process was repeated for each sample until a constant weight was achieved. The difference in weight was used to calculate the dry weight of the sample [13].
Determination of dextrose equivalent (DE)
The dextrose equivalent (DE) was determined using the method outlined by Betiku, et al. [5]. It was calculated as the ratio of the reducing sugar, expressed as glucose, to the dry weight of the sample.
$$\text{DE} = \frac{\text{Reducing sugar expressed as glucose}}{\text{Sample dry weight}} \times 100$$
Statistical Analyses
The statistical analysis was conducted using the SPSS 20 software. A multiple regression analysis of the variables was performed using ANOVA, along with an assessment of the effect of the independent variable on the other dependent variables.
Results and Discussion
Optimization of the Saccharification Steps of Breadfruit Starch Hydrolysis
The regression models of the effect of pH, temperature and time on the saccharification steps of breadfruit hydrolysis are shown on Figures 2. The results indicate a strong negative effect of pH on the percentage of reducing sugar, with a unit increase in pH causing a 522% reduction in reducing sugar yield. This aligns with the well-established fact that amyloglucosidase operates optimally at an acidic pH, typically in the range of 4.5 to 5.0. Deviations from this range can significantly decrease enzyme activity due to alterations in enzyme conformation, thereby reducing hydrolytic efficiency [14]. Similar findings were reported by Chen, et al. [15], who observed that amyloglucosidase- mediated hydrolysis of starch, is highly sensitive to pH variations, with optimal activity occurring in slightly acidic conditions. In contrast, the study shows that temperature has a positive effect on reducing sugar production, with a unit increase in temperature resulting in a 75% increase in reducing sugar yield. This can be attributed to the general principle that enzymatic activity increases with temperature up to a certain point, where higher temperatures accelerate molecular collisions and enzymatic reactions [16]. However, it is essential to note that temperatures exceeding the enzyme’s stability range can lead to denaturation, a phenomenon commonly seen in enzyme-catalyzed processes [17]. Additionally, time positively influences reducing sugar yield, with a unit increase leading to a 63.4% increase in reducing sugar. Prolonged reaction times allow more starch to be hydrolyzed into simpler sugars, as supported by kinetic studies on enzymatic starch hydrolysis [18]. The positive relationship between time and reducing sugar yield is consistent with studies that show longer reaction times contribute to higher saccharification efficiency [19]. The regression analysis reveals that a unit increase in pH leads to a 1.57% reduction in sample dry weight, indicating that higher pH levels favor more extensive hydrolysis of starch. This reduction in dry weight likely reflects the transformation of starch into soluble sugars, leaving behind less.
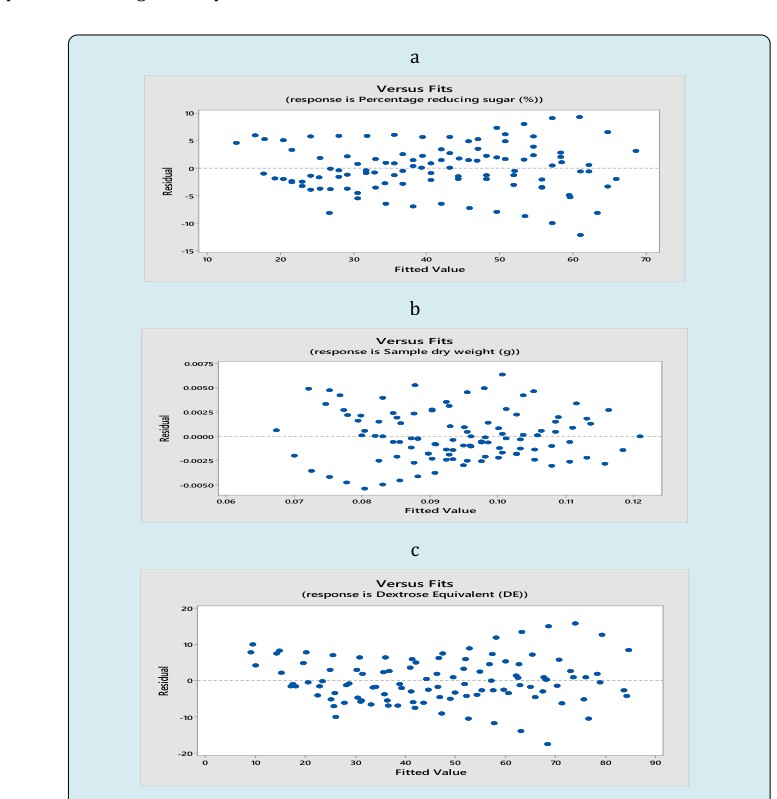
a: Reducing sugar; b: Sample dry weight; c: Dextrose equivalent Insoluble material. A similar trend is seen with temperature and time, where increases in both factors cause slight reductions in dry weight (0.09% and 0.04%, respectively). These results align with Slattery, et al. [20], who noted that higher temperatures and prolonged hydrolysis times facilitate the breakdown of starch into smaller, more soluble molecules, leading to a decrease in the residual dry matter. The results also show a positive effect of pH on Dextrose Equivalent, with a unit increase in pH leading to a 213% increase in Dextrose Equivalent. This suggests that under slightly alkaline conditions, the conversion of starch into glucose is enhanced. However, this finding may also indicate the complex behavior of amyloglucosidase under varying pH levels, suggesting that moderate increases in pH could promote glucose production to a point, beyond which enzyme activity would decline [15]. Both temperature and time positively influence Dextrose Equivalent, with unit increases resulting in 131% and 87.8% increases, respectively. The results also show a positive effect of pH on Dextrose Equivalent, with a unit increase in pH leading to a 213% increase in Dextrose Equivalent. This suggests that under slightly alkaline conditions, the conversion of starch into glucose is enhanced. However, this finding may also indicate the complex behavior of amyloglucosidase under varying pH levels, suggesting that moderate increases in pH could promote glucose production to a point, beyond which enzyme activity would decline [15]. Both temperature and time positively influence Dextrose Equivalent, with unit increases resulting in 131% and 87.8% increases, respectively. The positive correlation between these variables and DE is consistent with previous research, where elevated temperatures and extended reaction times have been shown to increase the efficiency of starch breakdown into dextrose. The observed results are in line with Montgomery [21], who emphasized the significance of temperature and reaction time in enzymatic processes, where optimal conditions lead to higher yields of simpler sugars.
The regression models in the study demonstrate a strong correlation between predicted and actual values for Reducing Sugar, Sample Dry Weight, and Dextrose Equivalent. The residual plots show an even distribution and random dispersion around the horizontal axis, indicating a good fit for the model. According to Montgomery [21], residual plots are an important diagnostic tool for assessing model adequacy. The random distribution of residuals suggests that the model assumptions (such as linearity and homoscedasticity) are met, confirming the robustness of the predictive model. The relationship between pH and enzymatic activity observed in the study is consistent with literature on amyloglucosidase. For instance, Whitehurst & Van Oort [14] highlights that amyloglucosidase is most effective in acidic environments, and deviations from its optimal pH can significantly reduce its activity. Moreover, the positive effects of temperature and time on saccharification outcomes have been widely documented in enzymatic hydrolysis studies [18, 17], reinforcing the importance of these parameters in optimizing enzymatic starch breakdown.
Evaluation and determination of the coefficient of the full regression model equation and the statistical significance of saccharification steps of breadfruit hydrolysis are shown in Table 1 while Table 2 shows the analysis of variance of the regression equation model. The predictive models for the saccharification steps of breadfruit starch hydrolysis were evaluated by examining the effect of pH, temperature, and time on three key response variables: sample dry weight, reducing sugar, and dextrose equivalent (DE). The significance of the model terms for these variables was assessed using p-values, with all model terms showing high statistical significance (p < 0.05), confirming that the chosen independent variables (pH, temperature, and time) significantly influence the saccharification process. This is in agreement with findings from Kunammeni and Singh [22], who reported similar significance levels in enzymatic starch hydrolysis models. For sample dry weight, the p-value was significant (p < 0.05), indicating that variations in pH, temperature, and time have a considerable impact on the dry weight remaining after hydrolysis. As reported by Vázquez, et al. [23], changes in the physical and chemical environment, such as pH and temperature, can lead to alterations in enzyme activity, which subsequently affects the degree of starch hydrolysis and the residual dry matter. This reduction in dry weight is expected as starch is broken down into simpler, more soluble sugars, thus decreasing the overall dry matter content. The reducing sugar content, a critical indicator of starch breakdown into monosaccharides (such as glucose), was also significantly influenced by the process variables. A unit increase in pH was found to reduce reducing sugar yield by 522%, whereas temperature and time positively influenced the outcome, increasing reducing sugar yield by 75% and 63.4%, respectively. This behavior is well-documented in enzymatic hydrolysis processes where temperature and time play pivotal roles in enhancing enzyme-substrate interactions, leading to higher sugar release [24]. Similarly, Dextrose Equivalent (DE), which measures the extent of starch conversion to glucose, was significantly influenced by the process parameters. The model showed that increases in pH, temperature, and time all led to increases in DE, indicating greater hydrolysis efficiency. The findings are consistent with Guan, et al. [24], who emphasized the critical.
| Coeff | SE Coef | T | P | |
|---|---|---|---|---|
| Sample Dry Weight (g) | ||||
| Constant | 0.23321 | 0.004291 | 54.35 | 0 |
| pH | -0.01567 | 0.000599 | -26.14 | 0 |
| Temperature °C | -0.00094 | 5.99E-05 | -15.66 | 0 |
| Time (min) | -0.00043 | 1.18E-05 | -36.63 | 0 |
| Percentage Reducing Sugar | ||||
| Constant | -1.53517 | 7.320573 | -0.21 | 0 |
| pH | -5.22022 | 1.022506 | -5.11 | 0 |
| Temperature °C | 0.755255 | 0.102251 | 7.39 | 0 |
| Time (min) | 0.634189 | 0.020154 | 31.47 | 0 |
| Dextrose Equivalent | ||||
| Constant | -70.02 | 12.15 | -9.97 | 0 |
| pH | 2.13 | 1.711 | 4.58 | 0 |
| Temperature °C | 1.3 | 0.1711 | 10.65 | 0 |
| Time (min) | 0.878011 | 0.03357 | 27.87 | 0 |
Table 1: Test of Significance of Every Regression Coefficient for the Saccharification Steps of Breadfruit Starch Hydrolysis.
| DF | SS | MS | F | P | |
|---|---|---|---|---|---|
| Sample Dry Weight (g) | |||||
| Regression | 3 | 0.036612 | 0.005038 | 605 | 0 |
| Residual Error | 105 | 0.003055 | 4.2E-06 | ||
| Total | 108 | 0.042146 | |||
| S = 0.03145082 | R-Sq = 92.5% | R-Sq(Adj) = 91.8% | |||
| Percentage Reducing Sugar | |||||
| Regression | 3 | 2042.1 | 6342.6 | 218.9 | 0 |
| Residual Error | 105 | 3652.3 | 36.1 | ||
| Total | 108 | 21579.4 | |||
| S = 0.05346 | R-Sq = 82.6% | R-Sq(adj) = 81.4% | |||
| Dextrose Equivalent | |||||
| Regression | 3 | 42730 | 16643 | 315.7 | 0 |
| Residual Error | 105 | 5146 | 58 | ||
| Total | 108 | 55316 | |||
| S = 0.036402 | R-Sq = 88.8% | R-Sq(adj) = 87.2% | |||
Table 2: Analysis of Variance (ANOVA) of the Regression Equation for the Saccharification Steps of Breadfruit Starch Hydrolysis R
Table 2: Analysis of Variance (ANOVA) of the Regression Equation for the Saccharification Steps of Breadfruit Starch Hydrolysis Role of these factors in starch saccharification, with higher temperatures and longer reaction times promoting greater conversion of starch to glucose. The ANOVA results revealed high F-values for all three response variables, with sample dry weight showing an F-value of 605.51, reducing sugar, 218.91, and DE, 315.72. These F-values, combined with extremely low p-values (p < 0.0001), demonstrate the high significance of the regression model, affirming its ability to explain the variability in the response variables. According to Montgomery [21], high F-values indicate that the model’s terms account for most of the variability in the data, while low p-values confirm the statistical significance of the model’s predictors. The F-test, which compares the model’s fit to the data with a model without predictors, showed significant results, indicating that the inclusion of pH, temperature, and time in the regression model significantly improves the prediction of saccharification outcomes. This finding is consistent with previous studies, such as Kunammeni, et al. [22], where F-tests were used to validate the statistical significance of process variables in starch hydrolysis models. The Coefficient of Determination (R²), a key indicator of the goodness of fit, was used to assess how well the regression model explains the variability in the response variables. The R² values for the saccharification steps where Sample dry weight, Reducing Sugar, Dextrose Equivalent are 96.8%, 90.3% and 93.5%, respectively. These values suggest that the model explains 96.8% of the variability in sample dry weight, 90.3% in reducing sugar, and 93.5% in DE, indicating a very strong fit. Guan, et al. [24] reported that R² values should be at least 0.80 for a model to be considered a good fit, and the R² values in this study exceed that threshold, confirming the model’s adequacy. Additionally, the adjusted R² values, which account for the number of predictors in the model, were only slightly lower where Sample dry weight, Reducing Sugar, Dextrose Equivalent are 96.3%, 90.0% and 93.1%, respectively. This small reduction between Coefficient of Determination (R²) and adjusted R² indicates that the model does not suffer from overfitting, as adding more predictors does not drastically inflate the model’s explanatory power [21]. High R² and adjusted R² values further confirm that the selected variables (pH, temperature, and time) are appropriate and significant predictors of the saccharification steps. The regression models for sample dry weight, reducing sugar, and DE were found to be suitable for adequately representing the actual relationships between the selected process variables (pH, temperature, and time) and the saccharification outcomes. The random dispersion of residuals around the horizontal axis in the residual plots further supports the appropriateness of the model, confirming that the assumptions of linear regression were met. This aligns with findings from Vázquez, et al. [23], who reported that well-distributed residual plots indicate that the model provides an adequate representation of the underlying process relationships. The behavior of amyloglucosidase during the saccharification process, as described by your findings, aligns with broader studies on enzymatic starch hydrolysis. Whitehurst, et al. [14] observed that amyloglucosidase is highly sensitive to changes in pH, with an optimal range between 4.5 and 5.0. Beyond this range, enzyme activity decreases, which explains the negative effect of increasing pH on reducing sugar yield in your study. Similarly, Wang, et al. [24] noted that temperature and time are critical factors in enzymatic hydrolysis, as higher temperatures enhance molecular interactions, thereby increasing the rate of saccharification. Moreover, the findings are consistent with those of Kunammeni, et al. [22], who emphasized the role of temperature and time in optimizing starch hydrolysis. They found that higher temperatures generally promote faster conversion of starch to glucose, as seen in the increasing dextrose equivalent with temperature in your study. The final regression equation in terms of coded factors for the response surface quadratic model for the saccharification steps is described in equation:
Sample Dry Weight = 0.2332096 - 0.0156667 pH - 0.0009389 Temperature (⁰C) - 0.0004327 Time (h)……………………………………… (Eq. 1) Percentage reducing sugar = - 1.535171 – 5.22022 pH + 0.7552552 Temperature (⁰C) + 0.634189 Time (h)………………………………… (Eq. 2) Dextrose Equivalent = - 70.02942 + 2.139468 pH + 1.309076 Temperature (⁰C) + 0.8780106 Time (h)…………………………………….. (Eq. 3)
Conclusion
The regression models developed for the saccharification steps of breadfruit starch hydrolysis by amyloglucosidase provide a robust and statistically significant representation of the effects of pH, temperature, and time on sample dry weight, reducing sugar, and dextrose equivalent. The F-test, R², and adjusted R² values confirm the goodness of fit and the model’s predictive power. The statistical significance of the model terms (p < 0.05) and the high F-values validate the models’ adequacy in predicting the saccharification process outcomes. These findings are supported by established literature on enzymatic starch hydrolysis, making the models valuable for optimizing the saccharification steps in industrial applications.
References
-
George AB (2004) Consumption of high-fructose corn syrup in beverages may play a role in the epidemic of obesity. American Journal of Clinical Nutrition 79: 537- 543.
-
Bello-Perez IA, Sanchez-Hernandez L, Moreno-Damian E, Toro-vazquez J (2002) Laboratory scale production of maltodextrins and glucose syrup from banana starch. Acta Cient Venez 53: 1-9.
-
Aboje A (2007) Production and Export of Glucose from cassava starch.
-
Ayoola AA, Adeeyo AO, Efeovbokhan CV, Olasimbo DA (2013) Optimum hydrolysis conditions of cassava starch for glucose production. Int J Adv Res IT Engin 2: 1-4.
-
Betiku E, Akindolani OO, Ismaila AR (2013) Enzymatic hydrolysis and optimizations of sweet potato (Ipomoea batatas) peel using a statistical approach. Brazilian Journal of Chemical Engineering 30(3): 467 -476.
-
Fagain CO (2003) Enzymes stabilization-Recent experimental progress. Journal of Enzyme Microbiology and Technology 33: 137-149.
-
Soetan KO, Olaiya CO, Oyewole OE (2010) The importance of mineral element for humans, domestic animals and plants: A review. African Journal of Food Science 4(5): 200-222.
-
Appiah FI, Ellis WO (2011) Proximate and mineral composition of Artocarpus altilis pulp flour as affected by fermentation. Pakistain Journal of Nutrition 10(7): 653-657.
-
Nwabueze TU, Uchendu CB (2011) African Breadfruit (Treculia africana) seed as adjunct in Ethanol production. European Journal of Food Research and Review 1(1): 15- 22.
-
Betiku E, Ajala O (2010) Enzymatic hydrolysis of breadfruit starch: case study with utilization for gluconic acid production. Ife Journal of Technology 19(2): 10-14.
-
Pele GI, Bolade MK, Enujiugha VN, Sanni DM, Ogunsua AO (2018) Influence of pH and temperature on the activities of alpha-amylase in maltodextrin production from breadfruit starch. International Journal of Engineering Science Invention 7: 10.
-
Miller GI (1972) Use of dinitrosalicylic acid reagent for determination of reducing sugar. Analytical Chemistry 31(3): 426-428.
-
AOAC (2005) Official Methods of Analysis. In: Helrich K (Ed.), Association of Official Analytical Chemist. 17th (Edn.). USA.
-
Whitehurst RJ, Van Oort M (2009) Enzymes in Food Technology. 2nd(Edn.), Wiley, USA, pp: 384.
-
Chen X, Zhang H, Li L (2021) Kinetics of Starch Hydrolysis by Amyloglucosidase: Influence of Temperature and pH. Journal of Food Engineering 105: 12-18.
-
Wang L, Liu L, Zhang X (2020) Enzymatic Hydrolysis of Starch Using Immobilized Amyloglucosidase. Food Chemistry 307: 125529.
-
Li W, Yan M, Liu P (2018) Statistical Modeling and Optimization of Starch Hydrolysis by Amyloglucosidase. Food Chemistry 240: 160-168.
-
Sauer J, Sigurskjold BW, Christensen U, et al (2000) Thermodynamics and Kinetics of Amyloglucosidase. Biochemistry 39(40): 12118-12124.
-
Singh V, Singh S (2010) Enzymatic Saccharification of Starch: Kinetics and Thermodynamic Study. Starch- Stärke 62(6): 315-322.
-
Slattery CJ, Kavakli IH, Okita TW (2000) Engineering Starch for Increased Functionality. Annual Review of Plant Biology 51(1): 527-551.
-
Montgomery DC (2012) Design and Analysis of Experiments. 8th (Edn.), Wiley.
-
Kunammeni A, Singh S (2005) Statistical Optimization and Regression Model for Enzyme Activity in Starch Hydrolysis. Biochemical Engineering Journal 23(3): 145- 152.
-
Vázquez JA, Blanco M, Sotelo CG (2009) Optimization of Enzymatic Hydrolysis of Starch. Carbohydrate Polymers 77(1): 97-103.
-
Guan Y, Yao S (2008) Predictive Models and Optimization of Enzyme Hydrolysis. Journal of Agricultural and Food Chemistry 56(8): 3093-3100.
- The Role of Podocyte Apoptosis and the Involvement of SIRT1 in Diabetic Nephropathy
- Dealcoholization of Beer by Osmotic Distillation for the Beverage Industry
- Biopolymer-Based Edible Packaging- Biomaterials, Methods, and Applications in Food Industry: An Updated Review
- Influence of Bioprocessing Methods on 'China Rice' (Gawal R1), and Soyabean Supplementation on the Quality of Complementary Food
- Cassava (Manihot esculenta) Varietal Growth, Yield and Cyanide Content Performance in Three Sites in the South- Eastern Semi Arid Regions of Kenya
- Food Waste Treatment, Recycling, Management and Production of Value-Products-An Update on Methodologies and Current Trends