Calcium, Magnesium, Phosphorus and Glucose Level Associated With Patients Suffering from Vitamin D Deficiency
The aim of this study is to assess the impact of vitamin D deficiency on Ca, P, Mg and fasting blood glucose in patients. Study designing total of 71 patients, which classified into 41 patients not suffering from vitamin D deficiency as control group and 30 patients suffering from vitamin D deficiency as case group, 71 patients are classified into three groups according to amount of vitamin D , gender and age of patient. In case group, first group classified according to amount of vitamin D in which there was low significant difference in Ca and Mg, ratio of Ca: P and ratio of Ca: Mg, but there was high significant difference in P and fasting blood glucose. Second group classified according to gender in which Calcium level, ratio of Ca: P and ratio of Ca: Mg in males and females suffering from vitamin D deficiency is low while Phosphorus level and fasting glucose level in males and females suffering from vitamin D deficiency is high, and the last group classified according to age, Calcium, phosphorus, Mg, ratio of Ca: P,ratio of Ca: Mg and fasting blood glucose in case study and control show no significant difference according to age.
Introduction
When the calcium in the blood becomes too low, the parathyroid gland that is near your neck starts producing PTH or parathyroid hormone. This converts the calcium from your bones and introduces the serum calcium into the blood, raising it to adequate levels. At the same time, the kidney is signaled to increase the amount of a chemical the body makes from Vitamin D called 1, 25 (OH)₂D. This element helps the guts absorb the calcium till the level is balanced. This interaction between calcium and Vitamin D is happening constantly in your body. It is important to have sufficient levels of Vitamin D in your body because only then will the body be able to metabolize and regulate calcium in the body. The best way to get Vitamin D is exposure to the sun. But these days, that doesn’t seem to be sufficient and it is advisable to check your levels and take supplements if necessary.
Magnesium and vitamin D are two essential nutrients that are necessary for the physiologic functions of various organs. Magnesium assists in the activation of vitamin D, which helps regulate calcium and phosphate homeostasis to influence the growth and maintenance of bones. All of the enzymes that metabolize vitamin D require magnesium, which acts as a cofactor in the enzymatic reactions in the liver and kidneys. Deficiency in either of Magnesium and Vitamin D is reported to be associated with various disorders, such as skeletal deformities, cardiovascular diseases, and metabolic syndrome. It is therefore essential to ensure that the recommended amount of magnesium is consumed to obtain the optimal benefits of vitamin D.
Phosphate plays many essential roles in our body. To accomplish these functions, serum phosphate needs to be maintained in a certain range. Serum phosphate level is regulated by intestinal phosphate absorption, renal phosphate handling and equilibrium of extracellular phosphate with that in bone or intracellular fluid. Several hormones such as parathyroid hormone, 1, 25-dihydroxy vitamin D (1, 25 (OH)2 and fibroblast growth factor 23 (FGF23) regulate serum phosphate by modulating intestinal phosphate absorption, renal phosphate reabsorption and/ or bone metabolism. In addition, dietary phosphate rapidly enhances renal phosphate excretion, although detailed mechanisms of this adaptation remain to be clarified. Physiologically, extracellular concentrations of phosphate and these hormones are maintained by several negative feedback loops. For example, 1,25 (OH)2D enhances FGF23 production and FGF23 reduces 1,25(OH)2D level. In addition, phosphate affects 1,25 (OH)2D and FGF23 levels. Dysfunction of these negative feedback loops results in several diseases with abnormal phosphate and 1,25(OH)2D levels. Especially, excess actions of FGF23 cause several hypophosphatemic rickets/osteomalacia with relatively low level of 1,25 (OH)2D that had been classified as vitamin D-resistant rickets/ osteomalacia. In contrast, deficient actions of FGF23 cause hyperphosphatemic familial tumoral calcinosis.
Deficiency in serum 25(OH) D levels decrease insulin secretion by reducing calcium absorption and therefore causing secondary hyperparathyroidism and increase peripheral insulin resistance.
In a study published in 2011, it was stated that low vitamin D levels increased prediabetes risk, and in healthy adolescent males, the insulin levels decreased as the vitamin D level increased [1]. The type 2 diabetes risk was lower for those whose 25(OH)D levels were higher [2]. On the other hand, in a study carried out in postmenopausal women, it has been reported that low vitamin D levels were not associated with diabetes risk [3].
In cross-sectional and epidemiological studies, the relation of Vitamin D deficiency with DM type I, metabolic syndrome, obesity, cardiovascular diseases, hypertension and mortality associated possibly due to this vitamin role in insulin resistance, secretion and inflammatory process were reported [1, 2, 4, 5, 6, 7, 8]. Vitamin D plays a pivotal role in calcium metabolism, and vitamin D deficiency may be associated with a range of serious diseases, including cancer, cardiovascular disease, and type 2 diabetes [9]. Vitamin D can’t be metabolized without sufficient magnesium levels, meaning Vitamin D remains stored and inactive form [10].
Materials and Method
Subjects Study
A total of seventy-one patients who applied to the outpatient clinics of Al -zaytouna specialized hospital between the years of 2019 and 2020 were included in our prospective, interventional study. Their ages between 18 to 85 years and they were coming from different parts of Sudan. Al -zaytouna specialized hospital located in Khartoum State, Khartoum is the largest city in the country, it had an estimated total population of approximately 6 million people according to national population census in 2009. The subjects were divided into two main groups, group one (41 patients) represented case study (Their mean ages was 41.24 ± 18.60 years). The second group (30 patients) was chosen as controls (Their mean ages was 43.80 ± 15.39 years). The case study group was classified into three sub-groups. Sub- Group one divided basis on level of vitamin D, Sub- group two divided basis on gender and Sub –Group three divided basis on age.
Designing Study
This is a case control study with sequential recruitment of study participants with deficient and insufficient in vitamin D ,diagnosed by physicians depending on laboratory investigation , and those without the disease who served as control .The laboratory tests for the biochemical parameters were conducted in order to assess the biochemical status and change in patients who suffered with vitamin D deficiency and insufficiency .These tests include mineral tests(serum calcium ,serum phosphorus and serum magnesium); lipid profile tests(serum total cholesterol ,serum triglyceride ,serum high density lipoprotein-cholesterol and serum low density lipoprotein –cholesterol)and complete blood count tests in whole blood (red blood cells, total white blood cells, hemoglobin, hematocrit, platelets, neutrophils and lymphocytes).
Blood Collection
Samples (4 ml) were collected from the participants by venepuncture into a dry tube (4 ml) using a 5 ml nontoxic, pyrogen-free, sterilized disposable syringes (Cathy Yougo®, France). Hematological parameters were assessed from fresh venous whole blood sampled with ethylenediaminetetraacetic acid (EDTA). Biochemical parameters were assessed in clotted samples .The blood samples were then centrifuged (BECKMAN Instruments Inc., USA) at 2500 rpm for 5 minutes, and serum was transferred into separate eppendorf tubes using sterile micropipettes and stored in the freezer at −35°C for subsequent batch analysis of serum 25(OH) D, calcium levels, phosphorus levels, magnesium levels, glucose levels and lipid profile.
Ethical Consideration
From the Faculty of Health Sciences Institutional ReviewBoard of the University of Buea. Administrative clearancewas obtained from the Regional Delegate of Public health inthe Southwest region and the Directors of the participating hospitals. Furthermore, authorization was obtained from the chiefs and quarter heads of the communities. Ethical clearance was obtained from Faculty of postgraduate, university of Al-Neelain. Administrative clearance was obtained from the Director of Al -zaytouna Specialized Hospital in the Khartoum, capital city of Sudan. Furthermore, authorization was obtained from the chief of the laboratory.
Methods
Measurement of Vitamin D was measured according to method described by Schleicher [11]. Measurement of Ca was measured according to method described by Heins [12], Endres and Rude [13]. Measurement of P was measured according to method described by Henry [14]. Measurement of Mg was measured according to method described by Mann and Joe [15] Measurement of glucose level was measured according to method described by Kunst and Tietz [16].
Statistical analysis
Data was analyzed using the statistical software package IBM SPSS statistics for windows, version 16 (SPSS Inc., USA). Normality of the continuous data was evaluated using Kolmogorov-Smirnov test. Data were expressed as percentages, mean ±standard deviation of the mean (SDM). Analysis of Variance (ANOVA) was used to assess the difference between group means of parametric variables, Statistical significance was designated as p≤0.05.
Results and Discussion
Patients Suffering from Insufficient and Deficient of Vitamin D
Seventy-one adults participated in the study are classified according to amount of vitamin D as follows, group one suffering from deficient in vitamin D represented 21.13% (n=15) and group two suffering from insufficient vitamin D represented 36.62% (n=26) and group three health (not suffering from insufficient and deficiency in vitamin D) represented 42.25% (n=30). Low significantly in serum calcium level mg/dl from (9.27± 0.26) in healthy patients to (8.55± 0.47) in patients. The result illustrates there is low absorption of calcium from intestine due to deficiency of Vitamin D, which response for calcium from intestine. These findings are agreed with those results obtained by Knavery Hospital (2017). In addition, high significantly in serum phosphate level mg/dl from (3.72± 0.51) in healthy patients to (5.24± 0.72) in patients. This results explain the parathyroid hormone, 1, 25-dihydroxyvitamin D and fibroblast growth factor 23 (FGF23) are regulate the serum phosphate by modulating intestinal phosphate absorption, renal phosphate reabsorption and/or bone metabolism and also dietary phosphate rapidly enhances renal phosphate excretion. These findings are agreed with results reported by Seiji. There is significant decrease in ratio of serum calcium: phosphate from (2.55± 0.47) in healthy patients to 1.66± 0.24 in patients. These results indicate the present of calcium and phosphate in serum in ratio 2:1 approximately.
Decrease of serum magnesium mg/ dl from (2.06± 0.13) in healthy patients to (1.99± 0.26) in patients suffering from Vitamin D deficiency. Therefore, deficiency in either of magnesium and Vitamin D is reported to be associated with all of the enzymes that metabolize vitamin D require magnesium, which acts as a cofactor in the enzymatic reactions in the liver and kidneys. These findings are similar to those results reported by Anne and Mohammed.
There is significant decrease in ratio of serum calcium: magnesium from (4.52± 0.30) in healthy patients to (4.33± 0.50) in patients. These results indicate the present of calcium: magnesium in serum in ratio1:1 approximately. Glucose level mg/dl in patients with Vitamin D deficiency (110.85± 15.43) in patients is significantly higher than the healthy patients (101.77± 14.28). These results indicate the relation of Vitamin D deficiency with DM type I, due to this vitamin role in insulin resistance, secretion and inflammatory process. These findings are similar to those results obtained by Ford [4].
Patients Suffering from Vitamin D Deficiency Classified According to Gender
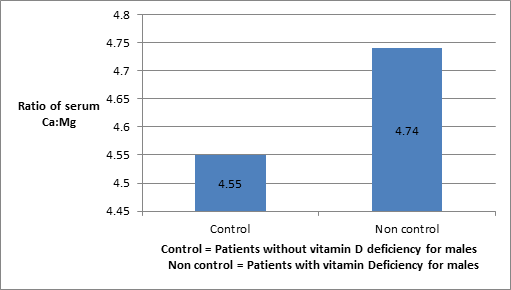
Seventy-one adults participated in the study are classified according to gender as follows; control group represented 42.25% (n=30), which divided into males group represented 50% (n=15) while female group represented 50% (n=15). However, case study represented 57.75% (n=41), which divided into males group represented 26.83% (n=11) and females group represented 73.17% (n=30). Figures 1,2 indicate that serum calcium in male and female for patients who suffering from vitamin D deficiency is lower than patients not suffering from vitamin D deficiency. This result explains the deficiency in serum 25(OH) D levels decrease insulin secretion by reducing calcium absorption [17]. Figures 3,4 indicate that serum phosphate in males and females for patients who suffering from vitamin D deficiency is higher than patients not suffering from vitamin D deficiency. The results finding indicates the serum phosphate level is regulated by intestinal phosphate absorption, renal phosphate handling and equilibrium of extracellular phosphate in bone or intracellular fluid. The level of serum phosphate is not regulating only by deficiency in serum 25(OH) D levels, but also it is regulating by other factors.
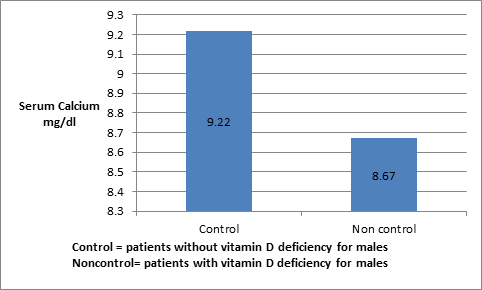
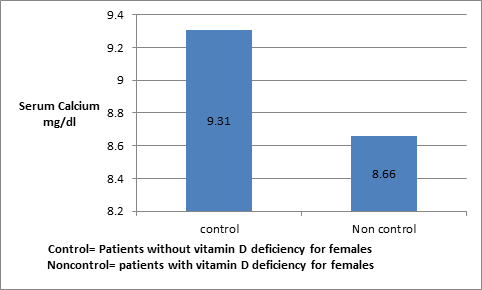
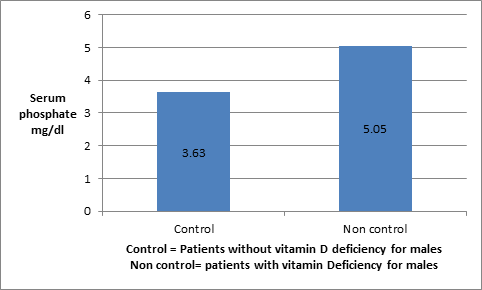
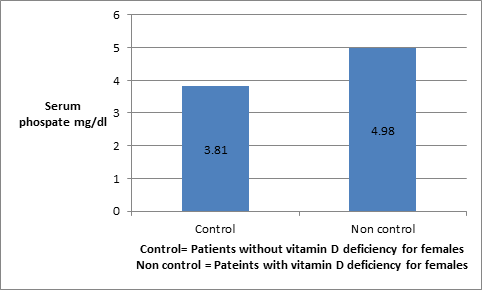
Figure 5,6 for both males and females indicate that the ratio of serum Calcium and Phosphate is lower in cases study (non control) than thus in control patients. This results supports that serum phosphate is regulated by other factors rather than deficiency of parathyroid hormone vitamin D 1,2(OH)2 such as intestinal phosphate absorption, renal phosphate handling and equilibrium of extracellular in bone and intracellular fluid but level of calcium is low due to deficiency of parathyroid hormone vitamin D 1,2 (OH)2. Figures 7,8 indicate that the serum magnesium in males and females for patients who suffering from vitamin D deficiency is lower than patients not suffering from vitamin D deficiency. These results explain that magnesium and vitamin D are essential nutrients that are necessary for the physiologic functions of various organs. In addition, magnesium assists in the activation of vitamin D, which helps regulate calcium and phosphate homeostasis to influence the growth and maintenance of bones. All of the enzymes that metabolize vitamin D require magnesium, which acts as a cofactor in the enzymatic reactions in the liver and kidneys. These findings are agreed with those results reported by Anne and Mohammed.
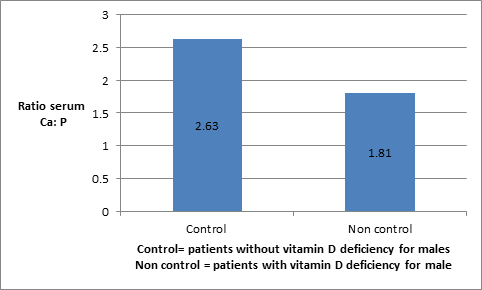
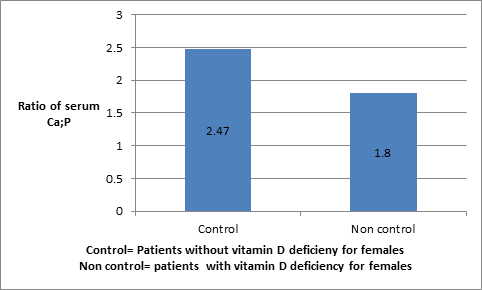
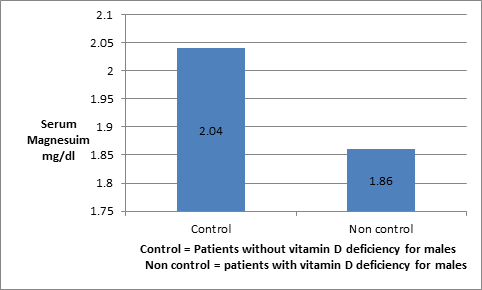
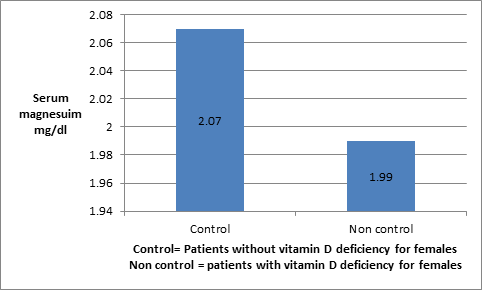
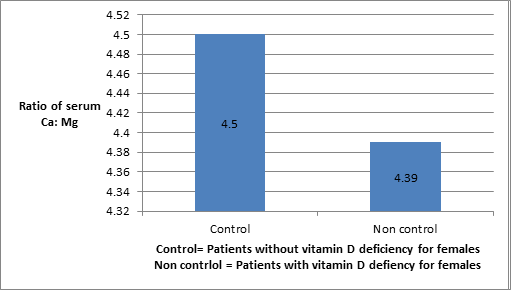
Figure 8: Shows magnesium level in females suffering from vitamin D deficiency Figures 9,10 for both males and females indicate that the ratio of serum Calcium and Magnesium is higher in the cases study (non control) than thus in control patients. This result indicates the consuming amount of magnesium by patients is less than thus amount of magnesium is consumed to obtain the optimal benefits of vitamin D. In addition, all of the enzymes that metabolize vitamin D require magnesium, which acts as a cofactor in the enzymatic reactions in the liver and kidneys. This finding is similar to results obtained by Anne and Mohammed.
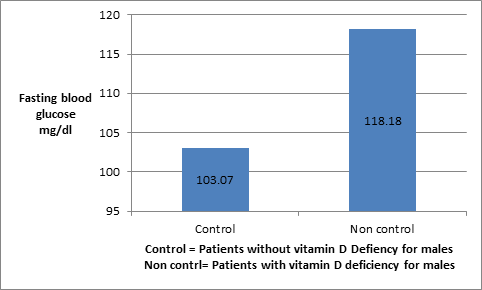
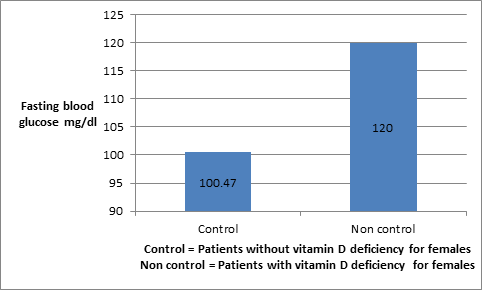
Figures 11,12 for both males and females indicate that the fasting blood glucose in case study (suffering from vitamin D deficiency is higher than thus in control patients (not suffering vitamin D deficiency). These results explains the deficiency in serum 25(OH) D levels decrease insulin secretion by reducing calcium absorption and therefore causing secondary hyperparathyroidism and increase peripheral insulin resistance. This leads to increase fasting blood glucose. The results are online on results obtained by Procopius and Borretta [17].
Patients Suffering from Vitamin D Deficiency Classified According to Age
Seventy-one adults participated in the study are classified into control group and case group according age The control group represented 42.25% (n=30) ,it was divided into 18- 30 years old which represented 20% (n=6), 31 -50 years old which represented 56.67% (n=17) and more than 50 years old which represented 23.33% (n=7).However, case study represented 57.75 % (n=41) which divided into 18 -30 years old which represented 36% (n=15), 31-50 years old represented 41.46% (n=17) and more than 50 years represented 21.95% (n=9).
Calcium level for control group ranged from (9.17±0.34) to (9.19±0.21) mg/dl while calcium level for case varied from (8.54±0.50) to (8.62±0.67) mg/dl. There were no significant differences between control and case group according to the age for calcium level. The results are showed that level of calcium level in control group is higher than in case study. This indicates that low of vitamin D can cause low calcium level in case study, because Vitamin D facilitates the intestinal absorption of calcium. With lower levels of vitamin D, dietary calcium is not absorbed efficiently [18].
Phosphate level for control group ranged from 3.53±0.86 to 3.83±0.32 mg/dl while phosphate level for case varied from 4.98±1.03 to 5.02±0.97 mg/dl. There were not significant differences between control and case group according to the age for phosphate level.
Ratio of calcium and Phosphate level for control group ranged from 2.42±0.26 to 2.78±0.95 while ratio of calcium and phosphate level for case varied from 1.75±0.32 to 1.87±0.60. There were no significant differences between control and case group according to the age for ratio of calcium and phosphate.
Magnesium level for control group ranged from 1.97±0.12 to 2.09±0.11 mg/dl while magnesium level for case study varied from 1.81±0.27 to 2.25±1.13 mg/dl. There were no significant differences between control and case group according to the age for magnesium level. The results indicate that the patients with deficiency of vitamin D are not suffering from low magnesium level. These findings are not agreed with results obtained by Science Daily [10].
| Control group >20mg/ml (n=30) | Insufficiency group 10-20 mg/ml (n=15) | Deficiency group <10mg/ml (n=26) | P-value | |
|---|---|---|---|---|
| Vit D (ng/ml) | 31.91±5.52 | 29.43±6.44 | 11.97±3.05 | 8.99±2.79 |
| Calcium mg/dl | 9.27±0.26 | 8.85±0.61 | 8.55±0.47 | 0 |
| Phosphate mg/dl | 3.72±0.51 | 4.59±1.13 | 5.24±0.72 | 0 |
| Calcium: Phosphate | 2.55±0.47 | 2.05±0.61 | 1.66±0.24 | 0 |
| Magnesium mg/dl | 2.06±0.13 | 1.89±0.25 | 1.99±0.26 | 0.028 |
| Calcium: Magnesium | 4.52±0.30 | 4.76±0.63 | 4.33±0.50 | 0.019 |
| Fasting blood glucose mg/dl | 101.77±14.28 | 134.53±54.38 | 110.85±15.43 | 0.002 |
Table 1: Shows Ca, P, and Ca: P, Mg, and Ca: Mg and fasting blood glucose according to level of vitamin D in people life in Sudan
Ratio of calcium and magnesium level for control group ranged from 4.48±0.20 to 4.68±0.42 while ratio of calcium and magnesium level for case varied from 4.19±0.88 to 4.86±0.83. There were no significant differences between control and case group according to the age for ratio of calcium and magnesium level [19].
Fasting blood glucose level for control group varied from 96.71± 7.16 to 103.53± 17.23 mg/dl while glucose level for case group ranged from 113.13± 15.51 to 124.35± 53.43 mg/dl. There were no significant differences between control and case group according to the age for fasting blood glucose. The results indicated that vitamin D deficiency has associated with risk of high of glucose level. The findings are agreed with results reported by Holick [9].
| Individual/ Parameters | Control (Non-suffering from vitamin D deficiency) n= 30 | Case (Suffering from vitamin D deficiency) n= 41 | P-value | ||||
|---|---|---|---|---|---|---|---|
| 18-30 n=6 | 31-50 n=17 | >50 years n=7 | 18-30 n=15 | 31-50 n=17 | >50 years n=9 | ||
| Vit D ng/ml | 28.18±4.86 | 32.3± 6.37 | 28.74± 4.95 | 9.23± 2.92 | 10.19± 3.74 | 9.99± 2.23 | 0.327 |
| Calcium mg/dl | 9.17±0.34 | 9.34± 0.24 | 9.19±0.21 | 8.54±0.50 | 8.79±0.50 | 8.62±0.67 | 0.949 |
| Phosphate mg/ dl | 3.53±0.86 | 3.74±0.43 | 3.83±0.32 | 5.01±0.87 | 4.98±1.03 | 5.02±0.97 | 0.854 |
| Ca: P | 2.78±0.95 | 2.53±0.25 | 2.42±0.26 | 1.75±0.32 | 1.87±0.60 | 1.77±0.35 | 0.357 |
| Magnesium mg/dl | 1.97±0.12 | 2.09±0.11 | 2.06±0.16 | 2.25±1.13 | 2.02±0.27 | 1.81±0.27 | 0.38 |
| Ca: Mg | 4.68±0.42 | 4.48±0.20 | 4.50±0.39 | 4.19±0.88 | 4.40±0.53 | 4.86±0.83 | 0.126 |
| FBG mg/dl | 102.7±11.1 | 103.5±17.2 | 96.7±7.2 | 113.1±15.5 | 124.3±53.4 | 121.0±18.1 | 0.775 |
Table 2: shows vitamin D, Calcium, Phosphate, Calcium/ Phosphate ratio, Magnesium, Calcium/ Magnesium ratio and fasten blood gluc
Table 2: shows vitamin D, Calcium, Phosphate, Calcium/ Phosphate ratio, Magnesium, Calcium/ Magnesium ratio and fasten blood glucose according to age in people life in Sudan. * The mean difference is significant at the 0.05 level. Data are expressed as Mean± SD, Vit. D (ng/ml) =vitamin D(nanogram per milliliter) ,mg/dl =milligram per deciliter ,FBG(mg/dl)=Fasting blood glucose(milligram per deciliter
Conclusion
The results concluded that there was significant difference in Ca, P, Mg, Ca: P, Ca : Mg and fasting blood glucose between case and control group according to gender and amount of vitamin D deficiency in patients. Whereas there was no difference in Ca, P, Mg, and Ca: P, Ca: Mg and fasting blood glucose between case and control group according to ages of patients. Finally, deficiency of vitamin D had impacted on in Ca, P, Mg, Ca: P, Ca: Mg and fasting blood glucose.
References
-
Gupta AK, Brashear MM, Johnson WD (2011) Prediabetes and Prehypertension in healthy adults are associated with low vitamin D levels. Diabetes Care 34(3):658–660.
-
Pittas AG, Sun Q, Manson JE, DawsonHughes B, Hu FB (2010) Plasma 25-hydroxyvitamin D concentration and risk of incident type 2 diabetes in women. Diabetes Care 33(9): 2021-2023.
-
Robinson JG, Manson JE, Larson J, Liu S, Song Y, et al. (2010) Lack of association between 25(OH)D levels and incident type 2 diabetes in older women. Diabetes Care 34(3): 628–634.
-
Ford E.S, Zhao G, Tsai J, Li C (2011) Associations between concentrations of vitamin D and concentrations of insulin, glucose, and HbA1c among adolescents in the United States. Diabetes Care 34 (3): 646-648.
-
Holick MF (2011) Vitamin D: evolutionary, physiological and health perspectives. Curr Drug Targets 12 (1): 4-18.
-
Zittermann A, Gummert JF, Borgermann J (2009) Vitamin D and mortality. Curr Opin Clin Nutr Metab Care 12(6): 634-639.
-
Foss YJ (2009) Vitamin D deficiency is the cause of common obesity. Med Hypotheses 72(3): 314-321.
-
Ford ES, Ajani UA, McGuire LC, Liu S (2005) Concentration of serum vitamin D and the metabolic syndrome among US adults. Diabetes Care 28 (5): 1228-1230.
-
Holick MF (2007) Vitamin D deficiency. N Engl J Med 357: 266-281.
-
Science Daily (2018) Low magnesium levels make vitamin D ineffective Up to 50 percent of US population is magnesium deficient. In: Tietz NW, (Ed.), American Osteopathic Association, Clinical Guide to Laboratory Tests. Philadelphia: WB Saunders C, pp: 444-451.
-
Schleicher RL, Pfeiffer CM (2013) Vitamin D Testing: How Will We Get it Right? American Association for Clinical Laboratory.
-
Heins M, Heil W, Withold W (1995) Storage of Serum or Whole Blood Samples? Effect of Time and Temperature on 22 Serum Analytes. Eur J Clin Chem Clin Biochem 33(4): 231-238.
-
Endres DB, Rude RK (2006) Mineral and Bone Metabolism In: Burtis CA, Ashwood ER, Bruns ED, (Eds.), Tietz Textbook of Clinical Chemistry and Molecular Diagnostics. 4th (Edn.), St. Louis (MO): Saunders Elsevier, pp: 1891-1965.
-
Henry R (1994) Clinical Chemistry: Principles and Technics, 2nd (Edn.), NY: Harper & Row, New York, pp:
-
Mann CK, Yoe JH (1956) Spectrophotometric determination of magnesium with sodium 1-azo-2- hydroxy-3-(2,4-dimethyl-carboxanilido)- napthalene- 1’-(2-hydroxy-benzene-5-sulfonate) Anal Chem 28(2): 202-205.
-
Kunst A, Draeger B, Ziegenhorn J (1984) Bergmeyer Methods of Enzymatic Analysis, 3rd (Edn.), Tietz NW (Ed.) Metabolites 1: Carbohydrates. 5 Clinical Guide to Laboratory Tests 6: 163-172.
-
Procopio M, Borretta G (2003) Derangement of glucose metabolism in hyperparathyroidism. J Endocrinol Invest 26(11): 1136-1142.
-
Brown JP, Fortier M, Frame H, Lalonde A, Papaioannou A, et al. (2006) Canadian Consensus Conference on Osteoporosis, Update. J Gynecol Canad 28(2): 95-112.
-
Sharma BK (2001) Instrumental Method of chemical Analysis. 20th (Edn.), Prakashan Media Ltd, India. pp: 45.
- Superposition of Cryo-EM and AlphaFold Predictions of Dengue Antigen-Antibody Complexes
- Jugular-Applied Coherent Low-Level Laser Therapy Enhances Systemic Mitochondrial Metabolic Function and Antioxidant Response
- Role of OMC32 Polypeptide in Acrosin-Mediated Exocytosis during the Bovine Sperm Acrosome Reaction
- Association of Galectin-3 but not Laminin in Tamoxifen-Induced Growth Suppression in Breast Cancer MCF-7 Cells
- Effect of Different Wavelengths of Light on the Rate of Photosynthesis
- Nutritional, Therapeutic, and Environmental Effect of Oyster Mushrooms: An Editorial