Removal of Cationic and Anionic Dyes from Aqueous Solution with Novel Sodium Alginate/Gelatin/Graphene Oxide (SGGO) Nanocomposite Aerogel
New sodium alginate/gelatin/graphene oxide (SGGO) nanocomposite materials were prepared using a “hydrophilic assembly– sustained release gelation†two-step method. The obtained materials were utilized as nano-adsorbents for the elimination of cationic dyes methylene blue (MB) and crystal violet (CV) and anionic dye Eriochrome black T (EBT). The influence of pH, amount of adsorbent, initial dye concentration and contact time was studied. Results indicated that the optimum pH for removal of the dyes was between 7.0-8.0, and showed excellent regeneration capacity. The SGGO nanocomposite aerogel has densities as low as 16.5 mg/cm3, superior porosity (92.5%), and abundant functional groups when only 5 wt% GO was incorporated. The results showed that when the dosage of the adsorbent was 1.0 g, pH of the solution was 7, temperature was 3°C, initial concentration of dyes was 250 mg L−1, and adsorption time was 180 min, yielding the maximum monolayer adsorption capacity of 255.12 mg/g, 175.34 mg/g, and 115.42 mg/g for Crystal violet (CV) Methylene blue (MB), and Eriochrome black T (EBT), respectively. The adsorption isotherms obeyed the Langmuir isotherm models for the adsorption, thermodynamic parameters showed that the adsorption process was spontaneous and endothermic in nature. Moreover, the adsorption kinetics of MB and CR onto SGGO followed a pseudo-second-order kinetic model, indicating that the chemical adsorption was the rate-limiting step. Thermodynamic parameters, such as Gibbs energy (ΔG°), enthalpy (ΔH°), and entropy (ΔS°).
Introduction
Water is one of the most important resources for human survival and development. Efficient wastewater treatment techniques such as coagulation, filtration, ozonation, and reverse osmosis have been studied to remove toxic materials from water. The development of eco-friendly adsorbent material for water decontamination has been an ever- growing area for research and industry, in particular organic textile dyes, which possess many hazards such as toxic [1], nonbiodegradable [2], aesthetically objectionable, and light restrictive nature in aqueous environment [1, 3]. Among the famous treatment techniques for dyes are ozone oxidation [4], biological treatment [4], catalytic degradation [5], photocatalytic oxidation [6], flocculation and coagulation [3], nanofiltration membrane [7], and unsaturated polyester resins [8]. Adsorption is the most attractive used techniques due to competency for variety of organic dyes, insensitivity to toxic pollutants [9], efficiency for low concentration range [10], easiness of operating, and being economical process [11, 12, 13, 14, 15, 16, 17, 18, 19, 20, 21]. Carbon based materials in the form of activated carbon are indeed dominant for dye decontamination in view of chemical stability, high surface area, and functional active sites [22, 23, 24, 25, 26]. Recently, graphene oxide (GO) produced by soft chemistry techniques arouse as highly efficient [27, 28, 29] and low cost carbon nanoadsorbent [30] followed by various type of carbon materials including single or multiwall carbon nanotubes, since it owns many superior properties such as large theoretical surface area (2630 m2/g) [31], mechanical flexibility, high charge carrier mobility, and chemical stability [32].
The unique structural features of GO, which is composed of planner sp2 type random aromatic domains and sp3 hybridized sites containing plenty of oxygen functional groups (epoxy, hydroxyl, and carboxyl groups), make this nanomaterial amphiphilic. For example, oxygen functionality imparts high hydrophilicity, while aromatic domain renders GO sheets hydrophobic character [30]. Moreover, oxygen functional groups make this nanomaterial behave like polymer and form variety of covalent or noncovalent bonding reactions [32]. Recently, by taking advantage of fundamental chemistry of graphene oxide a diverse range of functional adsorbents have been formulated, for instance, chemically reduced graphene [27], sponge [31], hydrogels/aerogels [33], and magnetically separable adsorbents [34, 35, 36, 37] to improve its competency and recollection issues. However, it suffers from low structural and adsorption capacities, while use of external magnate is practically not feasible as well. It has been reported that the affinity of dye pollutants toward graphene based adsorbent is attributed to active functional sites and pure aromatic domains or combination of them [38, 39, 40]. The former one can bind hydrophilic organic species via noncovalent forces such as vender wall and electrostatic and hydrogen bond interaction, whereas later one forms strong π-π staking/or hydrophobic interaction with benzene ring of organic compounds. It is also widely accepted that porous material can considerably improve the dye capturing ability due to improving surface area. It means that strong interaction of certain pollutant molecules could significantly be improved through modification of structural, surface, and electronic flexibility of graphene. In this regard, self-assembly of graphene (GO) offers simple and scalable approach to integrate the superior properties of 2D nanobuilding blocks into interconnected 3D monolithic materials [41]. The interconnected pores arising from nanosize 2D sheets provide unique physicochemical properties such as microstructure, charge mobility, large surface area, and surface functionality depending on the preparation conditions and reacting precursors [32, 42]. Indeed, different polymers/or molecules, for example, chitosan [43], resol [44], polymer [45, 46], carbohydrate [43], PVA [47], divalent metal ions [41], carbon nanotube [33], DNA [48], thiourea [31], aqueous ammonia solution [49], luffa sponge [12], and phenolic acid [50], arose as assembly of macroscopic graphene via various physical or chemical interactions. So far,, very little work was reported for water decontamination applications. Indeed, most of the published work is either selective for oil removal due to highly hydrophobic nature [49] or suffering from mechanically fragile three-dimensional structures and low adsorption capacity [51] due to insufficient functional active sites and large pore size which considerably limit its easy regeneration-recycling properties, thus being not feasible for industrial applications.
However, an increasing fear is spreading towards graphine oxide and graphite hazards on health during production, utilization, and disposal, once uptaken by living beings [52, 53]. However, common awareness is needed to be established, and it is necessary to have some protective measures to avoid the possible environmental hazards. Immobilization and encapsulation of GO considered an option. Alginate, a heteropolysaccharide composed of β-D- mannuronic acid and α-L-guluronic acid, widely distributes in diverse seaweeds and bacteria. It forms stable gels that could be cross-linked by various di/trivalent cations, such as Ba2+, Ca2+, and Fe3+. Of importance, these gels feature biosafety and easy processing. Entrapment using alginate beads has been extensively investigated for the accumulation towards various metal ions retained in water [54, 55, 56, 57, 58] as well as some dyes [59, 60], and further indicated high selectivity for water treatment. Recently, nanocellulose biopolymer likewise found to be an attractive carbon material due to low cost and being biodegradable and green in nature [61, 62]. Among the various methods, the production of nanocellulose fibers through 2,2,6,6-tetramethyl-1-piperidinyloxy (TEMPO) mediated selective oxidation [63, 64] offers the nanolevel dispersibility of individual fibrils in pure aqueous medium, since it possesses high density of sodium carboxylated moieties on the fibril surfaces [65]. Moreover, excellent mechanical strength (140 Mpa) and highly reactive moieties (COONa+) of this nanomaterial allow one to produce variety of mechanically robust functional composites including hydro/ aerogels [66]. Inspired by the intrinsic properties of graphene oxide and nanocellulose fibrils, incorporation of these nanobuilding blocks during self-assembly technique could be a promising approach in order to optimize physicochemical properties and functionality of interconnected porous monolith for industrial application, since graphene can form variety of bonding interactions with this nanofiller such as electrostatic repulsion/attraction and hydrogen bonding. To our knowledge, self-assembly phenomena between graphene oxide and TEMPO-oxidized nanocellulose fibers hitherto are not practiced for the fabrication of monolith material.
Thus, exploring the eco-friendly techniques coupled with high efficiency is of great concern to researchers and widely open area for development . Biopolymers represent an essential class of biomaterials in continuous development. Blends fabricated out of a wide range of natural or synthetic constituents serve as versatile convertible materials fit to typify assorted conformations such as bulks, films or membranes, as well as porous scaffolds and fibers [67]. When developing new biomaterials, natural polymers are often preferred to other classes of materials, as a result of their higher biocompatibility and similarities to human body constituents. For instance, some of the most popular natural biopolymers are chitosan [68], collagen [69] and gelatin [70], hyaluronic acid [71], sodium alginate [72, 73], nanocellulose [74] and silk fibroin [75].
By revising the former results and indications, we pondered upon the development of a composite films system based on a GO-reinforced chitosan–gelatin matrix cross- linked with genipin. The proposed procedure complies with the principles of the green chemistry, since it uses low volumes of easily synthesized SGGO based nanoextracting phases avoiding the use of toxic solvents. In this study, herein we report on fabrication, characterization, and adsorptive evaluation of alginate/gelatin/graphene oxide (SGGO) nanocomposite aerogel for accumulation of methylene blue (MB) and crystal violet (CV) and anionic dye Eriochrome black T (EBT). Composite materials were synthesized by a simple casting method and characterized thereafter by scanning electron microscopy (SEM), Fourier transform infrared spectroscopy (FTIR), X-ray diffraction (XRD), Raman spectroscopy, elemental analysis, thermogravimetric curve analysis (TGA), specific surface area (SSA), surface charge density measurement, and compressional mechanical analysis. Adsorption behaviors of dye were examined by equilibrium adsorption isotherms model (Langmuir, Freundlich, and Temkin isotherm) and kinetic model (pseudo-first kinetics and second-order kinetics) were also investigated.
Materials and Methods
Reagents and Chemicals
Analytical standards for the methylene blue (MB) and crystal violet (CV) and eriochrome black T (EBT) dyes were obtained from Sigma-Aldrich Chemicals. An individual stock solution for each dye at 100.0 µg/mL was prepared in deionized water. A mixture of the dyes, each at 10 µg/ mL, was prepared in deionized water for spiking and the preparation of calibration standards. A stock solution and a spiking solution were also prepared in deionized. Graphite (Commercial Number EC1000, average particle size 15 μm as manufactured) was purchased from Ito Kokuen Co., Ltd, Mieken, Japan. Other chemicals such as sodium alginate, calcium carbonate, and calcium chloride were obtained from Wako Pure Chemical Industries, Ltd., or Sigma-Aldrich Inc., Japan, unless specifically noted.
Sample Preparation
GO was prepared using the well known modified Hummers method, and SGGO was prepared from mixing the graphine oxide with sodium alginate/gelatin through amidation reaction between the carboxyl groups of GO and the amino groups of the gelatin, and hydroxyl surface groups exist in GO and alginate can interact through hydrogen formation with carbonyl and amine groups in gelatin, improving the gelling strengthen of the hydrogel. Moreover, the existence of GO also significantly improved the shear-thin behaviors of the hydrogels via the breakage of fiber networks under shear force. For the preparation of SGGO beads, Sodium alginate (500 ~ 600 mPa·s with a concentration of 10 g L-1 at 293 K as marked) was dissolved into deionized water at a mass fraction of 2 % before use. A modified Hummers-Offeman method was applied to prepare GO, of which the weight percent was about 0.10 %. Calcium alginate beads are commonly prepared by a CaCl2-hardening method. To prepare conventional GO/alginate/gelatin nanocomposite (SGGO), in brief, 50 g of GO solution was homogeneously mixed with 250 g of sodium alginate solution and 160 mg of gelatin were added to ensure the homogeneity of the solution. Then, solution was magnetically stirred for 2 h to activate the carboxyl groups of GO, and the mixture was then ultrasonicated for 60 min, the mixture was stirred at 30 °C for 1 h. The final product was washed several times with deionized water and methanol. A self-made apparatus comprised a 500 ml container for storing the raw solution, an airflow controller and an air pump. With a given internal pressure, the above solution was dripped continuously through the nozzle into a magnetically stirred CaCl2 solution (weight percent about 6 %). Then beads were thoroughly rinsed several times using a 100 μm mesh sieve. Also, calcium alginate beads and gelatin solution without GO, were also prepared for comparison. To prepare porous SGGO beads, a modified method was applied with HCl (weight percent 5 %) instead of CaCl2. Briefly, calcium carbonate was ground using a mill system for 48 hours to decrease the particle size. Then, a GO solution of about 50 g and calcium carbon of about 2.5 g were fully mixed. This was followed by the addition of 250 g of sodium alginate and 160 mg of gelatin and a subsequent mixing. A homogeneous calcium carbonate/GO/sodium alginate solution was readily prepared as the raw solution. Similarly to the above, the alginic beads were by the drop- wise method in HCl. During such, CO2 bubbles were also produced during the reaction between CaCO3 and HCl, and were also caged in the beads to form macro pores. These beads were denoted as SA-GO-M. For comparison, bubble- containing alginate beads without GO were also prepared, denoted as Pure SA-M. All beads were preserved in a fridge. The dry weight of each kind of beads was obtained from averaging over 60 beads by drying beads in a 353 K oven until the weight became constant. Each water sample was filtered, under reduced pressure, in the laboratory using a glass fiber filter (Whatman grade GF/C, 1.2 µm) and a layer of Celite, in an all-glass system consisting of a 9-cm sintered base and a 4-L flask. To each 1-L aliquot of the filtrate, 250 µL of the 10 µg/mL dye solution and 1 mL of concentrated HCl were added and mixed. Meanwhile, a 6-mL, 200-mg SGGO nanocomposites cartridge, was conditioned by elution with 5 mL of methanol, followed by 10 mL of water at pH 2. A flow rate of 0 to 15 mL/min was maintained by adjusting the system vacuum. When the extraction was complete, the cartridges were dried for 1 min at a vacuum. Each cartridge was washed with 2 mL of 25% methanol in water (v/v) to remove the polar coextractives. After it was further dried under full vacuum for 10 min, the cartridge was eluted with two 2.5-mL aliquots of methanol to remove the dyes. The methanol extract was evaporated to ca. 300 µL and was back extracted by 5 mL of deionized water in 1-mL fractions.
Instrumentation Measurements
The morphology characterization of GO and the SGGO nanocomposites were obtained on a JEM-2010 transmission electron microscope (TEM, JEOL Ltd., Japan), a HITACHIS-4800 scanning electron microscope (SEM, Hitachi Co. Ltd., Tokyo, Japan). FT-IR spectra analysis were performed on a Thermo Nicolet iS50 Fourier-transform (FT) infrared spectrometer (Madison, WI, USA). Raman spectra analysis were performed on a Nicolet 6700/NXR FT-Raman spectrometer (Thermo Electron, USA) with a laser excitation of 532 nm. The X-ray diffaction (XRD) patterns were recorded with a Bruker D8-Advance diffractometer using Cu-Kα (λ= 0.15418 nm) in the 10–1000(2θ) range with a step size of 0.020. Field-emission scanning electron microscopy (FESEM) images were recorded on a Hitachi SU-8010 apparatus. The Brunauer–Emmett–Teller (BET) specific surface area was ascertained by a nitrogen adsorption data measured at 77K on a Quantach-rome NOVA4000 surface area analyzer. X-ray photoelectron spectroscopy (XPS) patterns were recorded on a Thermo Scientific Escalab 250Xi spectrometer with Al-Kα (1486.6V). for dyes quantification we used UV-Vis Spectrophotometers - GENESYS™ 50.
SPE Procedure and Real Sample Preparation
20.0 mg of the SGGO nanocomposite was packed into a standard filter, to acted as a homemade SPE column. The column was preconditioned with 2 mL of methanol and 2mL of water. 10 mL of the sample solution was passed through the column at a flow rate of 0.5 mL/min. Then, the dyes were eluted with 1.0 mL of methanol and concentrated to dryness under a steam of nitrogen before detection. Fused silica and glass materials were used for the entire procedure to avoid any possible interferences. The quantification was based on Uv-Vis spectrophotometer with λ = 664 nm for methylene blue MB, λ = 588 nm for crystal violet (CV), and λ = 503 nm for Eriochrome black T (EBT).
Stability Study
A six samples of 25 mL from a local sewage was collected in a 50 mL bottles. Bottle 1 was used as is for immediate blank determination. Bottles 2 to 6 were fortified with a mixture of the dyes to give a nominal concentration of 1.00 µg/L for each dye. Bottle 2 was also extracted immediately after spiking for the determination of drug levels at zero time, while bottles 3 to 6 were kept at 4°C in the dark. The dyes levels in bottles 3, 4, 5, and 6 were determined 24 h, 48 h, 96 h, and 7 days after spiking, respectively. At each specified time, the entire sample in each bottle was filtered as described above. The filtrate was measured for dyes conentration.
Dye adsorption studies
Aqueous solutions of methylene blue (MB) and Congo red (CR) dyes with different concentration (10–100, 150, 200, 250, and 300 mg L−1) were prepared by successive dilution of stock solution (1000 mg L−1) in deionized water. The residual MB and CR concentration was measured by UV-spectrophotometer (Shimadzu UV-spectrophotometer, UV-1800) using an absorbance at λ = 664 nm for MB and λ = 498 nm for MB. Dye adsorption spectra were recorded over the range 200–800 nm using UV-VIS-NIR spectrophotometers (UV-3600, SHIMADZU). Dye adsorption quantity (mg g−1) and percentage removal (%) were calculated in (mg L−1) by calculating the initial and final time concentrations of dye in the solution. λ = 664 nm for methylene blue MB, λ = 588 nm for crystal violet (CV), and λ = 503 nm for Eriochrome black T (EBT).
Results and Discussion
FT-IR Analysis
To clarify the crosslinking process of SGGO nanocomposite, FTIR was used for analysis. Figure 1a shows FTIR spectrum of GO is defined by the absorption bands situated around at 1051, 1212, 1620, 1740, and from 3000 to 3600 cm−1 (and generated by the vibrational modes of C–O, C–OH, C=C and C=O groups, while –OH functionalities in their both free and connected states are identified, with the band spreading sideways around 3500 cm−1. The SGGO nanocomposite FT- IR spectrum comprises the main absorption bands of both alginate/gelatine compounds (Figure 1b). At 1025 and 1150 cm−1, respectively, C–O and C–O–C specific marks of alginate are present. Amide from gelatine can be identified at 1654, 1546 and 1249 cm−1, while in the SGGO nanocomposite N–H stretching vibrations in amide are interacted and overlapped with the O–H-specific band. A SGGO fingerprint is established within the 900–1155 cm−1 region and denotes the stretching vibrations of the glycolide backbone, i.e., C–O–C asymmetric stretching at ~1166 and C–O bonds at 1030 cm−1. The bands from 1400 to 1470 indicate the vibrational modes of C–N and N–H that are probably overlapped with the signal of the GO ring stretching mode structure vibration generated at 1410 cm−1, while C=O stretching of amide and acetamide bands are positioned at 1647 and 1656 cm−1. The presence of amides in SGGO, can be assigned to the absorbance peaks located near 2940 1655, 1546 and 1234 cm−1. Similarly, the –O–H broad band around 3450 cm−1 is identified on both alginate-gelatine and SGGO spectra, overlapping the N–H signals in the latter one, whereas C–H symmetric and asymmetric vibration modes are expressed at around 2910 and 2940 cm−1. Amide band can be identified at 1654, 1546 and 1249 cm−1, while N–H stretching vibrations in amide in SGGO nanocomposite are overlapped with the O–H-specific band.
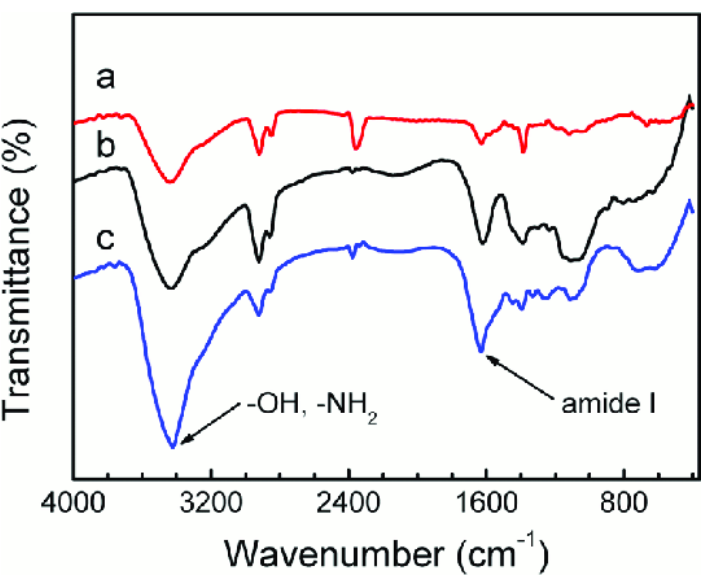
The peak at approximately 3400 cm−1 in Figure 1-a is caused by stretching vibration of the –OH group on the surface of GO, the peak at 1726 cm−1 which are caused by the C-O stretching vibration of the carboxyl group, the peak at 1626 cm−1 is attributed to the C-C bonds in the GO. In Figure 1-c, broadened peaks at 3398 cm-1 were observed indicating of GO interaction with alginate. As shown, the nanocomposite spectra were different from calcium alginate. The peaks at 1415 cm-1 and 1595 cm-1 indicated the symmetric and asymmetric stretching vibrations of carboxylate, respectively, in some GO-alginate interactions. By contrast, a shifted peak at 1728 cm-1 represented the typical vibration of carbonyl stretching in alginate acid.
Raman Spectrum of GO and SGGO Nanocomposite Aerogel
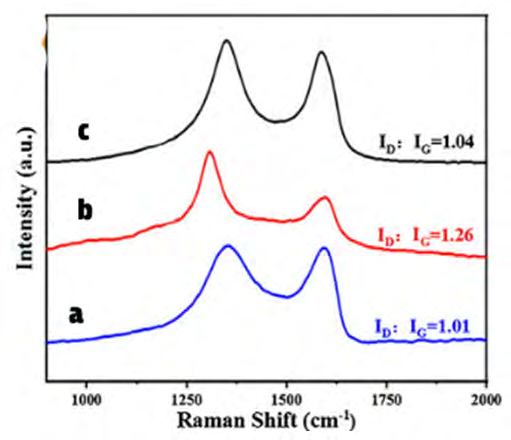
Raman spectra of GO, alginate/gelatine and SGGO nanocomposite are shown in Figure 2, with a laser excitation of 532 nm was used. In the two samples clearly visible and strong peaks were noticed at approximately 1595 cm−1 and 1353 cm−1 which assigned to the G and D bands, respectively. We noticed red-shift in the D-band of the Raman spectra of SGGO nanocomposite, as shown in Figure 2(c). The red- shift phenomena is caused by the bonding between the C and N atoms, therefore changes the electronic structure of GO. Indeed, the intensity ratios of the two peaks (ID/IG) demonstrate the extent of defects on the GO surface caused by reaction with SGGO nanocomposite, and can be used to reflect the extent of covalent binding. The ID/IG ratio of GO and the SGGO nanocomposite are 5.0 and 7.0, respectively, corresponding to a slightly increased ratios of ID/IG. And thus an increase in disorder, and indicate the successful formation of amidation reaction between the GO and alginate/gelatine to form the final product SGGO nanocomposite. The Raman spectrum corresponding to alginate/gelatine shows amide band from gelatin at ~1667 cm−1, CH2 scissoring at ~1450 cm−1) and another amide band at ~1245 cm−1. The Raman spectra corresponding to SGGO nanocomposite aerogel shows the appearance of a shoulder located at 1640 cm−1 and an increase in the relative intensity of the band located at 1409 cm−1 with respect to that located at 1460 cm−1 when compared to the spectra corresponding to the gelatin. The band at 1460 cm−1 could be attributed to the appearance of the carboxyl ion stretch (typical for alginic acid salts) as a consequence of the partial protonation of Na-Alginate at the experimental conditions employed for the preparation of the SGGO nanocomposite. This is in agreement with an increase in the relative intensity of the band located at 1409 cm−1 in the spectra corresponding to SGGO nanocomposite aerogel which could be attributed to symmetric carboxyl stretching of alginate. Therefore, from the results obtained, this suggested that there was a high degree of interpenetration of the polysaccharide coating within the SGGO nanocomposite because of the presence of polysaccharide chains entangled within the nanocomposite aerogel which was much more evident within the first three microns of the sample for the samples.
AFM Image of GO, and SGGO Nanocomposite Aerogel
Atomic force microscopy images (AFM) image was performed inorder to examine the morphology of of GO, and SGGO nanocomposite aerogel. AFM images before and after reaction and deposition of alginate/gelatine on the surface of GO is shown in Figure 3. It can be seen from Figure 3 a single layer of GO and a single sheet of SGGO nanocomposite of varying size. Alginate/gelatine are reacted on the surface of GO substrate with clear overlaps. Before reaction of alginate/gelatine with GO the thickness of GO vary in size from 1.0 to 1.3 nm. However, after functionalization and reaction with alginate/gelatine, the thickness of GO single layer sheets are obviously increased to nearly 2.1 – 2.5nm, indicating the presence of Alginate/gelatine on the surface of GO sheet, indicating an extensive folding, wrinkling, and/ or aggregation of the graphene oxide with alginate/gelatine with at the length scales visible. Overview AFM images do indicate a significantly better dispersion of graphene oxide within alginate/gelatine, which is attributed to the differences in the specific chemical interactions between the alginate/gelatine polymers and graphene oxide.
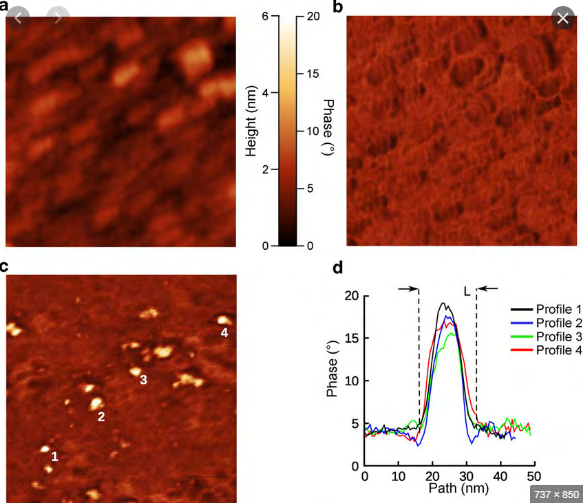
Figure 3: Atomic force microscopy (AFM) images of SGGO nanocomposite thin film sample. (a) and (b), 600×600 nm2 topography images. (c) 300×300 nm2 phase image with the AFM tip oscillation optimized in order to probe the hardness beneath the upper film surface. The bright spots are nanoparticles beneath the upper film surface. (d) Width of the nanoparticle profile (about 14 nm), consistent with their dimension.
X-ray Diffraction (XRD) Analysis
Figure 4 shows X-ray diffraction (XRD) analysis of (a) GO, (b) alginate/gelatin and (c-g) SGGO nanocomposite. For Figure
4-a GO shows a typical peak around 10.63◦ corresponding to inter-planar spacing of 8.30 Å which caused by the oxygen- rich groups on both sides of the sheets and the water molecules trapped between the GO sheets. The calculated interlayer spacing of the freeze-dried graphine was observed to be between 3.69 Å and 3.65 Å. This value was much lower than that of GO (8.30 Å), which suggested the presence of π-π stacking between graphene sheets in the composites and also the presence of a certain number of functional groups on reduced GO sheets, reduced GO sheets can encapsulate water in the process of self-assembly due to the presence of residual hydrophilic oxygenated groups. As presented in Figure 4-b for alginate/gelatine the peak identified at 8.25°, 11.40° and 18.27°, as well as the broad band at 23°, are attributed to the semi-crystaline structure of alginate/gelatin. X-ray diffraction (XRD) analysis was applied to characterize the crystallographic structure of the fresh and used SGGO nanocomposite aerogel. The XRD pattern demonstrating the successful preparation of the SGGO nanocomposite hydrogel.
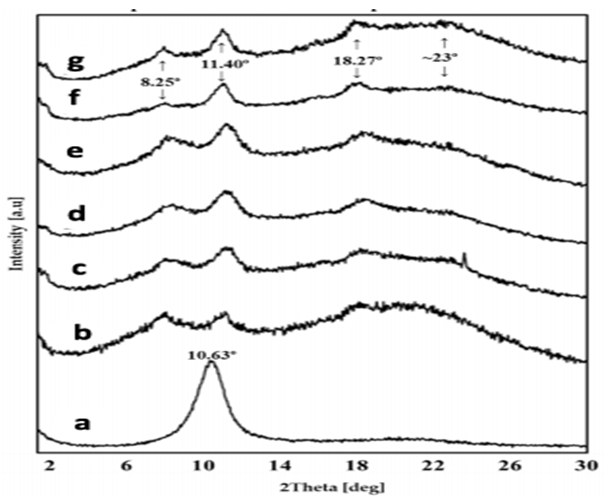
The used SGGO nanocomposite aerogel displays the same diffraction pattern as the fresh sample with little decrease in intensity, which indicates that the crystal structure of the SGGO nanocomposite is maintained after microeextraction. Moreover, the discernible diffraction peaks at about 10.63 belonging to GO can be detected in the pattern of SGGO nanocomposite, with shift and overlap with the alginate/ gelatin peak at 11.4. This X-ray diffraction (XRD) analysis result indicates the incorporation of alginate/gelatine polymers into the GO structure. The main target of XRD studies was to establish the influence of GO on SGGO nanocomposite’ general mode of structuration. The XRD pattern of the SGGO nanocomposite aerogel shows the peaks noticed in alginate/gelatin pattern, consists of three diffraction peaks located at 8.25°, 11.40° and 18.27° and a broad band at around 23°. However, we noticed increase in the intensity maximums at 8.25° and 11.40° are after SGGO nanocomposite after dye adsorption attributed to the organized and unorganized domains of SGGO nanocomposite aerogel. Their correspondent d-spacing values of 0.11 and 0.23 nm are in direct relation to the diameter of the triple helical structures and the distance between the three components sodium alginate, gelatin and graphine oxide (SGGO) nanocomposite.
XPS Scanning Spectrum
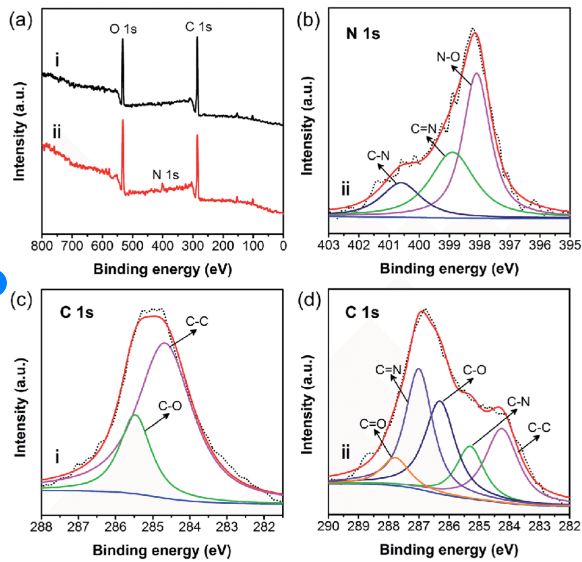
GO, alginate/gelatine and the SGGO nanocomposites were investigated by X-ray photoelectron spectroscopy (XPS). Figure 5 (a) shows that only the C1s and O1s peaks exist in GO (Figure 5a). The C1s peaks are obtained by coupling the five peaks at 284.8, 285.5 286.8, 287.8, and 288.7 eV, assigned for C-C, C-OH, C-O, C=O, and O=C-OH, respectively. The N1s peak for SGGO nanocomposites can be shown in (Figure 5b above). Relative to GO (Figure 5c), the peak fitting of C1s in SGGO nanocomposites yields a new functional group (i.e., C-N, Figure 5d), which is indicted a successful amidation reaction between alginate/gelatine and GO. As shown in Figure 5, the N content increases from 0.68% to 5.10%, while the O content decreases, demonstating a covalent amidation bonding between GO and the alginate/gelatine. Similar results were obtained with the used SGGO nanocomposites sample after microextraction of the dyes.
SEM Images and TEM Images
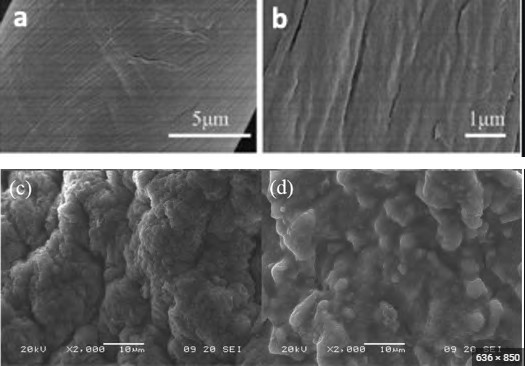
Scanning electron microscopy morphologies of SGGO nanocomposites films were investigated by SEM. In Figure 6, the surfaces of composite films are illustrated. Throughout the image set, the classical features of nanocomposite films are present: flat surfaces with high porosity. However, a developmental surface morphology associated with the increase in GO load can be stressed. The superficial appearance of alginate/gelatine blends is gradually changed from smooth to rough upon the increasing GO amount. Figure 6 a and b shows TEM images of (a) GO, (b) SGGO nanocomposites, respectively; and Figure 6c and 6d depict SEM images of (c) GO and (d) SGGO nanocomposites. As revealed in TEM and SEM images, GO possesses a wrinkled single-layer structure with semitransparent flake-like shape.
After being grafted by the alginate/gelatine, the SGGO nanocomposites still maintain the lamellar structure shown in Figures 6b and 6c, which ensures that they retain a high specific surface area and high adsorptive performance. An obvious change in the TEM and SEM images can be observed after reaction of GO with alginate/gelatine, the large GO sheets are reduced to small pieces, thus giving the appearance of holes with different sizes. This appearance phenomenon can explain the novel nancomposites structure of SGGO, that have the advantage of the high adsorptive capacity of dyes chemicals.
Effect of Solution pH on dye Sorption
In Figure 7, the effect of pH on adsorption was studied from acid to weakly alkaline. The results revealed that there is variation on the removal of dyes by SGGO nanocomposites by changing the pH. To cover the three pH states (acid, base, neutral), so, the work was carried out at pH = 3 (acid medium), pH = 7.55 (7–8, neutral medium) and pH = 9 (basic medium). The other parameters including contact time, dosage of adsorbent and agitation speed were kept constant at 60 min, 40 mg and 240 rpm, respectively. From the data represented in Figure 7, it was observed that removal of both cationic and anionic dyes were affect with pH variation where maximum removal was obtained at neutral medium (pH = 7–8) for the three dyes under study. The change in pH lead to alternation of surface of adsorbent that affect sorption efficacy. Since at pH = 3, for cationic dye electrostatic attraction was formed between protonated dye and the surface of SGGO nanocomposites. While, at pH = 9, the electrostatic repulsion takes place between surface of SGGO nanocomposites and anionic dye. At low pH, functional groups such as carboxylate groups of alginate and GO became progressively protonated. At lower pH, there existed competing adsorption between H+ and cationic dye ions, and the H+ took the priority; at higher pH, more oxygen-containing functional groups were dissociated and therefore through electrostatic attraction, the adsorbent turned more negatively charged, favorable for adsorption cationic dyes. Therefor in both cases of pH = 3 and 9 (acidic and alkaline medium), the removal percent is low. In neutral pH medium (7–8), attraction and repulsion forces were avoided and maximum removal was occurred due to wander vales force. The basic dyes like crystal violet are also enter between the intestinal of dyes and electrostatic attraction was formed on the surface of dyes. This may be due to difference of H+ and OH– concentrations although the zero potential charge of SGGO nanocomposites. Moreover, SGGO nanocomposite functions relying on not only its functional groups, but also the pi-pi electrostatic attraction as well as its amphiphilic affinity. In addition, we found at lower pH (pH ~ 2), the alginate/gelatine component adsorption was heavily inhibited of, but GO became highly contributed to the
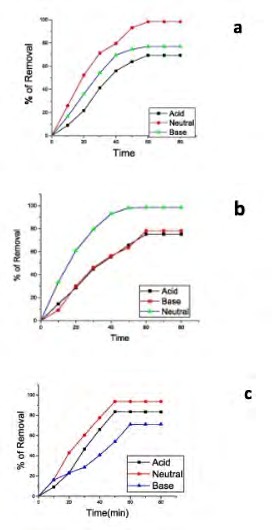
adsorption process. This could attribute to that GO covered multiple interactions with the dyes, including that of oxygen functional groups having pH dependent dissociation.
Effect of Sorbent Dose
The influence of the sorbent dose towards the dye adsorption was studied at different quantities of SGGO nanocomposites ranging from 0.25 g L−1 to 3 g L−1, at natural pH of dyes solutions, and at 25°C, and results are presented in Table 1.
| SGGO dose | R (%) | ||
|---|---|---|---|
| (g/L-1) | MB | CV | EBT |
| 0.25 | 33.55 | 32.1 | 29.8 |
| 0.5 | 50 | 45.9 | 40.65 |
| 1 | 92.42 | 90,53 | 89.4 |
| 2 | 95.99 | 92.42 | 90.96 |
| 3 | 98.78 | 95.34 | 94.45 |
Table 1: Effect of sorbent dose on dyes removal.
Removal efficiency of investigated dyes increases rapidly with an increasing amount from 0.25 to 1.0 g L−1 of SGGO nanocomposites. At the same time, further increasing the adsorbent dose from 1 to 3.0 g L−1 leads to only a small increase of the removal efficiency. This can be attributed to the availability of more adsorption sites as the adsorbent dose increased. To get good removal efficiency, but still using as less sorbent, subsequent studies were conducted using 2 g L−1 SGGO nanocomposites dose.
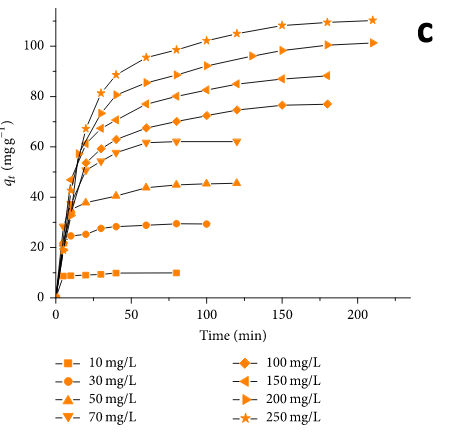
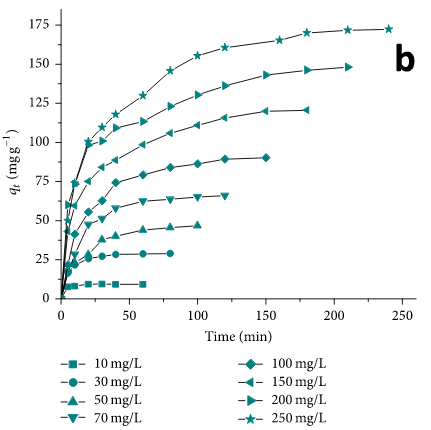
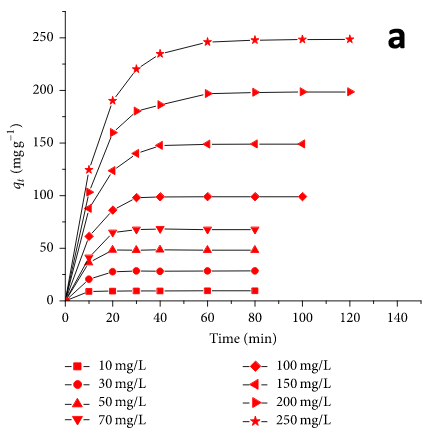
Effect of Initial Dye Concentration and Contact Time
We investigated the effect of the initial concentration of the dye on adsorption process, in a wide range of concentrations between 10 and 250 mg L−1 at 25°C and natural pH values (7.4 for MB, 7.1 for CV, and 7.0 for EBT). The concentration of the dye at a desired stage was obtained using a standard calibration curve. As can be seen in Figure 8, the adsorption is very rapid in the initial stages of the adsorption, and it remained constant after reaching the equilibrium time. This can be explained by a large number of active centers at the beginning of adsorption and saturation of these centers on the surface of the adsorbent with achieving equilibrium. The necessary time for reaching the equilibrium increases with increasing the concentration due to the fact that adsorption involves film diffusion and internal diffusion. The surface diffusion is rapid but the pore diffusion is slower, and the rate of diffusion in the internal adsorption sites decreased with increasing the initial dye concentration.
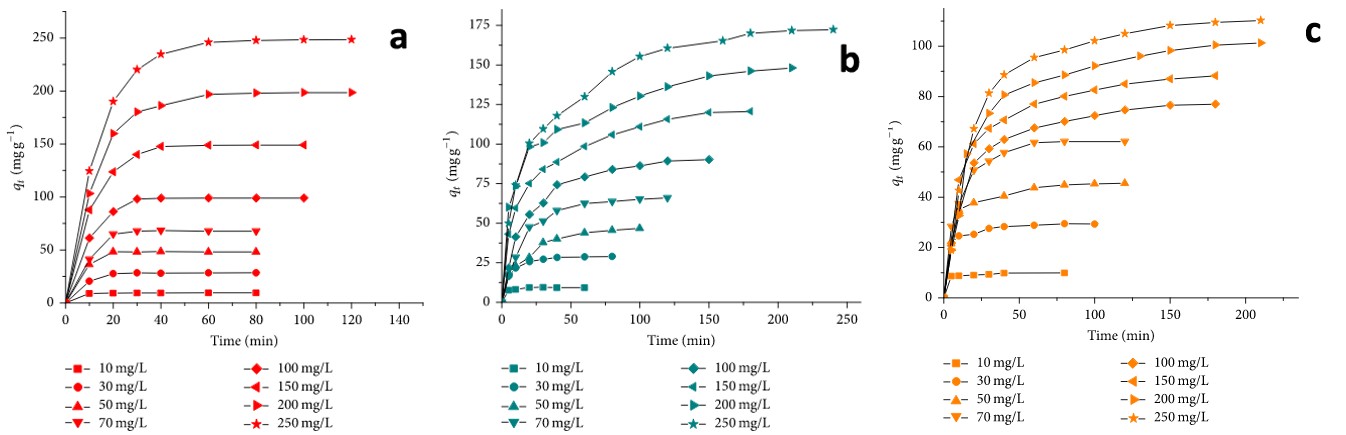
Very good results (higher than 95%) for the dye removal percentage were obtained at low concentrations (Table 3), but even at high concentrations the removal percentage is high in case of CV (>93%) and higher than 50% for MB and EBT dyes. The amount of dye adsorbed increased while the percentage removal decreased, with the increase in the initial dye concentration.
| Dye conc. | MB | CV | EBT | ||||||
|---|---|---|---|---|---|---|---|---|---|
| mg/L | q (mg/g) e | R(%) | t(min) | q (mg/g) e | R(%) | t(min) | q (mg/g) e | R(%) | t(min) |
| 10 | 9.55 | 95.6 | 30 | 9.8 | 98.77 | 40 | 9.83 | 98.22 | 20 |
| 30 | 28.67 | 93.38 | 40 | 27.6 | 98.77 | 60 | 29.83 | 97.19 | 30 |
| 50 | 250.77 | 92.66 | 90 | 46.5 | 98.77 | 70 | 49.83 | 97.45 | 40 |
| 70 | 165.43 | 89.45 | 110 | 163.357 | 98.77 | 80 | 99.83 | 96.55 | 50 |
| 100 | 189.22 | 78.67 | 120 | 164.5 | 98.77 | 130 | 110.83 | 96.96 | 65 |
| 150 | 249.13 | 85.45 | 150 | 177.84 | 98.77 | 140 | 110.83 | 96.99 | 100 |
| 200 | 256.76 | 73.23 | 180 | 175.76 | 98.77 | 150 | 110.23 | 95.55 | 150 |
| 250 | 255.12 | 68.3 | 210 | 175.34 | 54.73 | 170 | 115.42 | 93.43 | 190 |
| Temperature (0C) | |||||||||
| 10 | 189.66 | 89.33 | 120 | 170.89 | 78.99 | 130 | 110.5 | 96.78 | 65 |
| 25 | 250.43 | 95.32 | 100 | 175.56 | 94.77 | 100 | 115.54 | 98.44 | 40 |
| 40 | 49.15 | 98.95 | 60 | 175.43 | 97.44 | 60 | 115.45 | 97.88 | 20 |
Table 2: Influence of the process variables on the adsorption process.
Effect of Temperature
The effect of temperature on the sorption process was studied at three different temperatures (i.e., 25, 40, and 60°C) at natural pH values (pH 7.1 for CV, 7.4 for MB and 7.0 for EBT). The amount of dyes adsorbed onto SGGO nanocomposites as a function of contact time for different temperatures is presented in Table 1. A comparison of experimental data shows for all investigated dyes that the rise of temperature induced a positive effect on the removal percentage (Table 2). The adsorption capacity increases as the temperature increases, suggesting that dyes adsorption onto SGGO nanocomposites is an endothermic process. This can be explained by the fact that by increasing the temperature the dye aggregation is reduced and the diffusion of dye molecules into the pores of the absorber is facilitated. On the other hand, there was a decrease of the necessary time for reaching the equilibrium as the temperature increases from 25°C to 60°C. Within the first 40 min, approximately 80% of the dyes are rapidly adsorbed. Later, the adsorption process slows as the system approaches equilibrium. The shorter the contact time in adsorption process, the lower the operational costs that recommend the adsorbent for large-scale industrial application. These adsorption studies indicate that colored pollutants, such as, CV, MB, and EBT, can be easily removed from wastewaters by adsorption onto SGGO nanocomposites. Due to their saturation magnetization, these adsorbents can be simply separable from the parent solution using a magnetic field, resulting in clean water.
Kinetics Studies
In the kinetic experiment, the changes of absorbance were determined at certain time intervals during the adsorption process. The experimental results obtained for the influence of initial concentration were analyzed using the pseudo-first-order Lagergren (3), pseudo-second-order (4), and intraparticle diffusion (5) models.
$$ \begin{array}{l} \ln \left(q _ {e} - q _ {t}\right) = \ln q _ {e} - k _ {1} t (3) \\ \frac {t}{q _ {t}} = \frac {1}{k _ {2} q _ {e} ^ {2}} + \frac {t}{q _ {e}} (4) \\ q _ {t} = k _ {i} t ^ {0. 5} + l, (5) \\ \end{array} $$ where qe and qt are the amount of solute adsorbed at equilibrium and at time t, respectively, per unit weight of adsorbent (mg g−1), k1 is Lagergren rate constant (min−1), k2 is the intraparticle diffusion rate constant (g mg-1 min−1), ki and is the intraparticle diffusion rate constant (mg g-1 min−0.5) and is the effect of boundary layer thickness.
| Dye | Temp. | First order Kinetic model | Second-order Kinetic model | Intraparticle diffusion | |||||||
| q e,exp (mg/g) | q e,cal (mg/g) | k .103 1 min-1 | R2 | q e,cal (mg/g) | k .104 2 (g/ mgmin-1) | R2 | k i (g/mg min-0.5) | L | R | ||
| CV | 25 | 89.25 | 85.3 | 30.78 | 0.985 | 96.72 | 5.5 | 0.99 | 9.72 | 5.4 | 0.956 |
| 40 | 98.63 | 83.38 | 47.62 | 0.945 | 100.02 | 60 | 0.983 | 10.19 | 10.6 | 0.962 | |
| 60 | 99.15 | 72.68 | 50.99 | 0.99 | 101.73 | 21 | 0.995 | 10.83 | 33.45 | 0.948 | |
| MP | 25 | 79.45 | 65.34 | 30.72 | 0.975 | 96.72 | 8.5 | 0.992 | 5.72 | 35.67 | 0.962 |
| 40 | 94.62 | 43.35 | 37.64 | 0.985 | 101.02 | 16.82 | 0.991 | 6.15 | 40.34 | 0.956 | |
| 60 | 96.17 | 29.62 | 57.92 | 0.989 | 98.77 | 66.5 | 0.985 | 7.87 | 63.4 | 0.948 | |
| EBT | 25 | 96.43 | 35.45 | 50.52 | 0.852 | 99.76 | 38.5 | 0.99 | 17.72 | 5.67 | 0.954 |
| 40 | 98.72 | 23.15 | 47.24 | 0.751 | 100.76 | 86.8 | 0.981 | 30.13 | 4.34 | 0.973 | |
| 60 | 99.15 | 19.69 | 57.52 | 0.789 | 99.75 | 83.5 | 0.992 | 37.82 | 6.43 | 0.939 |
Table 3: Comparison of experimental and calculated qe values and rate constants for adsorption of CV, MB, and EBT dyes on SGGO na
Table 3: Comparison of experimental and calculated qe values and rate constants for adsorption of CV, MB, and EBT dyes on SGGO nanocomposites The pseudo-second-order model was the best applicable kinetic model for the investigated dyes removal kinetics, emphasized by the accordance between the experimental and calculated qe values. With increasing the temperature, an increase of the pseudo-second-order rate constant k2 was observed, pointing out that the necessary time for reaching the equilibrium decreased with increasing temperature. Similar results were obtained for the application of modified magnetic nanocomposites for dye removal. In adsorption systems, there is the possibility of intraparticle diffusion being the rate-limiting step. When applying intraparticle diffusion model, the plots had two portions which means that the intraparticle diffusion is not the rate determining step of the adsorption.
The plots had the same shapes (Figure 9), a linear initial portion in which the intraparticle diffusion is the rate- controlling step, followed by a plateau where intraparticle diffusion slows down.
Adsorption Isotherms
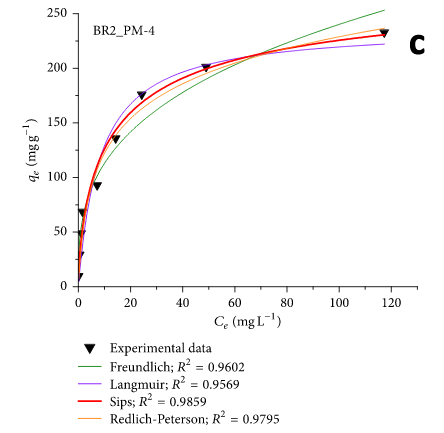
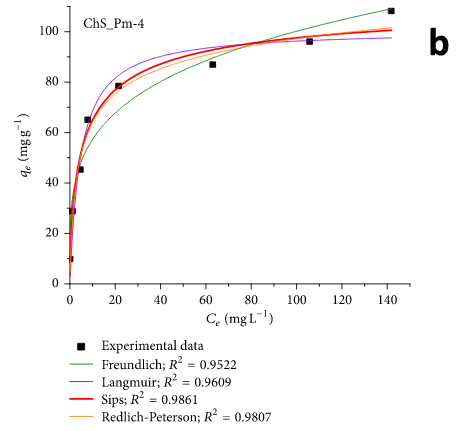
Equilibrium adsorption studies were carried out for a better understanding of the adsorption process. The experimental data obtained at equilibrium was analyzed with Freundlich, Langmuir, Sips, and Redlich-Peterson adsorption models. The best isotherm model that fits with the experimental data was the Sips isotherm model (Figure 10). That means that an adsorption process is going on after
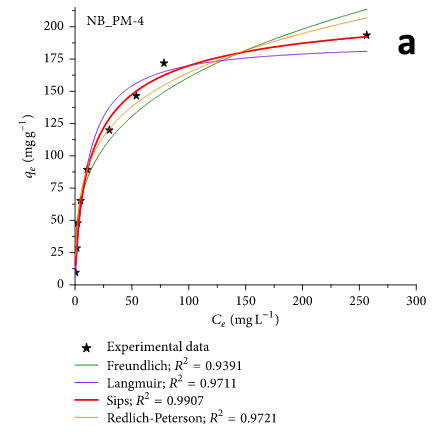
a combined model of Freundlich and Langmuir: diffused adsorption on low dye concentration and a monomolecular adsorption with a saturation value, at high adsorbate concentrations. The maximum adsorption capacity of the PM-4 was determined from the sorption isotherms curves. The SGGO nanocomposites showed a higher affinity for CV adsorption than that of MB and EBT in single dye solution.
Thermodynamic Studies
The results obtained using the Sips model were used to calculate the thermodynamic parameters for the adsorption process [75]. Gibb’s free energy (ΔG0) was calculated using the following equation:
and both enthalpy (ΔH0) and entropy (ΔS0) were determined from van’ Hoff equation:
$$ \Delta G ^ {0} = \Delta H ^ {0} - T \Delta S ^ {0}, $$
where R is the universal gas constant (8.314 J K−1 mol−1), T is the absolute temperature, and Ks represents the Sips equilibrium constant, obtained from the isotherm plots. and values can be calculated from the slope and intercept of the linear plot of ln Ks versus 1/T.
The ΔG0 values are negative indicating that the adsorption is a spontaneous process (Table 5). The positive values of ΔH0 suggest the endothermic nature of the process and indicate that the amount adsorbed at equilibrium is increased with increasing temperature. The positive values of ΔS0 reflect an increase in randomness at the solid– solution interface during the dyes adsorption onto SGGO nanocomposites.
| Temp. (°C) | ΔG0(J/mol) | ΔH0(J/mol) | ΔS0(J/mol.K) | |
|---|---|---|---|---|
| CV | 25 | 7373.06 | 6055.2 | 433.89 |
| CV | 40 | 7745.34 | 6055.2 | 433.89 |
| CV | 60 | 8238.07 | 6055.2 | 433.89 |
| MP | 25 | 4667.53 | 3832.14 | 274.2 |
| MP | 40 | 4900.45 | 3832.14 | 274.2 |
| MP | 60 | 5225.67 | 3832.14 | 274.2 |
| EBT | 25 | 6225.13 | 5438.45 | 399 |
| EBT | 40 | 6950.26 | 5438.45 | 399 |
| EBT | 60 | 7400.18 | 5438.45 | 399 |
Table 4: Thermodynamic parameters for the adsorption of investigated dyes on SGGO nanocomposites.
Adsorbent Stability and Reusability
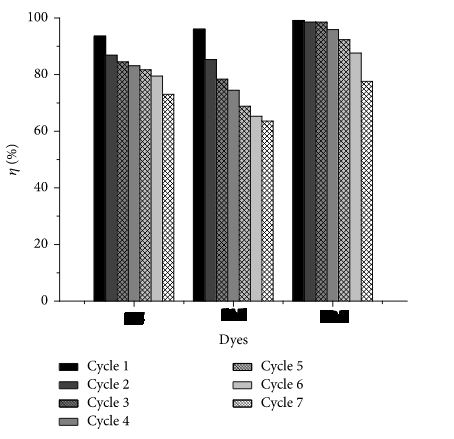
A promising adsorbent for large-scale wastewater treatment must present a very good adsorption capacity, easy separation, and high stability. To validate the reusability of the magnetic adsorbent, seven cycles of consecutive adsorption-desorption were carried out at 25°C (Figure 11). The removal efficiency decreased continuously, but it still remained at 68% in the seventh cycle, indicating the good recycling performance of the used adsorbent SGGO nanocomposites. The adsorption-desorption studies revealed a greater preference for EBT compared with other two dyes. The removal efficiency decreased continuously, but it still remained at 68% in the seventh cycle, indicating the good recycling performance of the used adsorbent (SGGO nanocomposites). The adsorption-desorption studies revealed a greater preference for EBT compared with other two dyes.
Conclusions
This research highlights the preparation of novel types of SGGO nanocomposites, used for adsorption of three dyes. The prepared nanocomposites were used as the nanoadsorbent in a fixed-bed column, which possessed the advantages of low column pressure and high nanoadsorption capacity. Moreover, it was observed that removal of both cationic and anionic dyes were affect with pH variation where maximum removal was obtained at neutral medium (pH = 7–8) for the three dyes under study. The removal efficiency of pollutants increased with increasing the SGGO nanocomposites content, with initial concentration of the dyes pollutants, and temperature. Kinetic studies revealed that adsorption of investigated dyes followed a pseudo-second-order kinetic in single dye solution. The application of intraparticle diffusion model demonstrates that the surface diffusion and the intraparticle diffusion occur in parallel during the adsorption process. The experimental data were well correlated by the Sips adsorption model, and in single systems, the maximum adsorption capacities were 223.82 mg g−1 for CV, 114.68 mg g−1 for MB, and 286.91 mg g−1 for EBT, respectively. Thermodynamic analysis showed that adsorption of investigated dyes on SGGO nanocomposites was favorable, spontaneous, and endothermic. Even after seven adsorption- desorption cycles, the SGGO nanocomposites still present a good efficiency (greater than 65%) for dyes removal from aqueous solution, indicating the possible industrial application of SGGO. The obtained results were compared with the previously reported data on different adsorbents for the same dyes and the selected nanocomposite from this work demonstrates its superiority and the potential as a new efficient adsorbent for the removal of dyes in binary systems from aqueous solutions. Considering the facile and low-cost characteristics of the synthesis method, separation efficiency and simplicity, and the stability and reusability in several adsorptions-desorption cycles, the SGGO nanocomposites used in this study are versatile and promising candidates for the removal of dyes from aqueous solutions.
Conflicts of Interest
The authors declare no conflict of interest regarding the publication of this paper.
References
-
Alves de Lima RO, Bazo AP, Salvadori DMF, Rech CM, Palma Oliveira D, et al. (2007) Mutagenic and carcinogenic potential of a textile azo dye processing plant effluent that impacts a drinking water source. Mutation Research— Genetic Toxicology and Environmental Mutagenesis 626(1-2): 53-60.
-
Raval NP, Shah PU, Shah NK (2016) Adsorptive amputation of hazardous azo dye Congo red from wastewater: a critical review. Environmental Science and Pollution Research 23(15): 14810-14853.
-
Guibal E, Roussy J (2007) Coagulation and flocculation of dye-containing solutions using a biopolymer (Chitosan). Reactive Functional Polymers 67(1): 33-42.
-
Castro FD, Bassin JP, Dezotti M (2017) Treatment of a simulated textile wastewater containing the Reactive Orange 16 azo dye by a combination of ozonation and moving-bed biofilm reactor: evaluating the performance, toxicity, and oxidation by-products. Environmental Science and Pollution Research 24(7): 6307-6312.
-
Li J, Hussain A, Li D, Yang M, Xu S (2017) Catalytic performance of graphene-bimetallic composite for heterogeneous oxidation of acid orange from aqueous solution. Environmental Science and Pollution Research 24(8): 7264-7273.
-
Bao N, Li Y, Yu H, Niu JJ, Wu GL, et al. (2013) Removal of anionic azo dye from aqueous solution via an adsorption- photosensitized regeneration process on a TiO2 surface. Environmental Science and Pollution Research 20: 897- 906.
-
Hassani AH, Mirzayee R, Nasseri S, Borghei M, Gholami M, et al. (2008) Nanofiltration process on dye removal from simulated textile wastewater. International Journal of Environmental Science & Technology 5(3): 401-408.
-
Jain R, Sharma P, Sikarwar S (2013) Kinetics and isotherm analysis of Tropaeoline adsorption onto unsaturated polyester resin (UPR): a non-carbon adsorbent. Environmental Science and Pollution Research 20(3): 1493-1502.
-
Namvari M, Namazi H (2014) Synthesis of magnetic citric- acid-functionalized graphene oxide and its application in the removal of methylene blue from contaminated water. Polymer International 63(10): 1881-1888.
-
Yan H, Tao X, Yang Z (2014) Effects of the oxidation degree of graphene oxide on the adsorption of methylene blue. Journal of Hazardous Materials 268: 91-198.
-
Kyzas GZ, Deliyanni EA, Matis KA (2014) Graphene oxide and its application as an adsorbent for wastewater treatment. Journal of Chemical Technology and Biotechnology 89(2): 196-205.
-
Li S, Tao M, Xie Y (2016) Reduced graphene oxide modified luffa sponge as a biocomposite adsorbent for effective removal of cationic dyes from aqueous solution. Desalination and Water Treatment 57(42): 20049- 20057.
-
Li Y, Du Q, Liu T (2013) Comparative study of methylene blue dye adsorption onto activated carbon, graphene oxide, and carbon nanotubes. Chemical Engineering Research and Design 91(2): 361-368.
-
Li Y, Du Q, Liu T (2013) Methylene blue adsorption on graphene oxide/calcium alginate composites. Carbohydrate Polymers 95(1): 501-507.
-
Liu F, Chung S, Oh G, Seo TS (2102) Three-dimensional graphene oxide nanostructure for fast and efficient water-soluble dye removal. ACS Applied Materials & Interfaces 4(2): 922-927.
-
Liu Y, Wang J, Zheng Y, Wang A (2012) Adsorption of methylene blue by kapok fiber treated by sodium chlorite optimized with response surface methodology. Chemical Engineering Journal 184: 248-255.
-
Praskalo J, Kostic M, Potthast A, Popov G, Pejic B, et al. (2009) Sorption properties of TEMPO-oxidized natural and man-made cellulose fibers. Carbohydrate Polymers 77(4): 791-798.
-
Wan W, Zhang R, Li W (2016) Graphene-carbon nanotube aerogel as an ultra-light, compressible and recyclable highly efficient absorbent for oil and dyes. Environmental Science 39(1): 107-113.
-
Wang P, Cao M, Wang C, Ao Y, Hou J, et al. (2014) Kinetics and thermodynamics of adsorption of methylene blue by a magnetic graphene-carbon nanotube composite. Applied Surface Science 290: 116-124.
-
Yener J, Kopac T, Dogu G, Dogu T (2008) Dynamic analysis of sorption of Methylene Blue dye on granular and powdered activated carbon. Chemical Engineering Journal 144(3): 400-406.
-
Zhang W, Zhou C, Zhou W (2011) Fast and considerable adsorption of methylene blue dye onto graphene oxide. Bulletin of Environmental Contamination and Toxicology 87(1): 86-90.
-
Deng H, Lu J, Li G, Zhang G, Wang X (2011) Adsorption of methylene blue on adsorbent materials produced from cotton stalk. Chemical Engineering Journal 172(1): 326- 334.
-
Fu J, Chen Z, Wang M (2015) Adsorption of methylene blue by a high-efficiency adsorbent (polydopamine microspheres): kinetics, isotherm, thermodynamics and mechanism analysis. Chemical Engineering Journal 259: 53-61.
-
Iqbal MJ, Ashiq MN (2007) Adsorption of dyes from aqueous solutions on activated charcoal. Journal of Hazardous Materials 139(1): 57-66.
-
Vadivelan V, Vasanth K (2005) Equilibrium, kinetics, mechanism, and process design for the sorption of methylene blue onto rice husk. Journal of Colloid and Interface Science 286(1): 90-100.
-
Yan B, Chen Z, Cai L, Chen Z, Fu J, et al. (2012) Fabrication of polyaniline hydrogel: Synthesis, characterization and adsorption of methylene blue. Applied Surface Science 356: 39-47.
-
Liu T, Li Y, Du Q (2012) Adsorption of methylene blue from aqueous solution by grapheme. Colloids and Surfaces B: Biointerfaces 90(1): 197-203.
-
Ramesha GK, Kumara AV, Muralidhara HB, Sampath S (2011) Graphene and graphene oxide as effective adsorbents toward anionic and cationic dyes. Journal of Colloid and Interface Science 361(1): 270-277.
-
Yang S T, Chen S, Chang Y, Cao A, Liu Y, et al. (2011) Removal of methylene blue from aqueous solution by graphene oxide. Journal of Colloid and Interface Science 359(1): 24-29.
-
Gao W (2011) Engineered graphite oxide materials for application in water purification. ACS Applied Materials Interfaces 3(6): 1821-1826.
-
Zhao J, Ren W, Cheng HM (2012) Graphene sponge for efficient and repeatable adsorption and desorption of water contaminations. Journal of Materials Chemistry 22(38): 20197-20202.
-
Shao JJ, Lv W, Yang QH (2014) Self-assembly of graphene oxide at interfaces. Advanced Materials 26(32): 5586- 5612.
-
Ai L, Jiang J (2012) Removal of methylene blue from aqueous solution with self-assembled cylindrical graphene-carbon nanotube hybrid. Chemical Engineering Journal 192: 156-163.
-
Ai L, Zhang C, Chen Z (2011) Removal of methylene blue from aqueous solution by a solvothermal-synthesized graphene/magnetite composite. Journal of Hazardous Materials 192(3): 1515-1524.
-
Bai S, Shen X, Zhong X (2012) One-pot solvothermal preparation of magnetic reduced graphene oxide-ferrite hybrids for organic dye removal. Carbon 50(6): 2337- 2346.
-
Fan L, Luo C, Li X, Lu F, Qiu H, et al. (2012) Fabrication of novel magnetic chitosan grafted with graphene oxide to enhance adsorption properties for methyl blue. Journal of Hazardous Materials 215-216: 272-279.
-
Yao Y, Miao S, Liu S, Ma L P, Sun H, et al. (2012) Synthesis, characterization, and adsorption properties of magnetic Fe3O4@graphene nanocomposite. Chemical Engineering Journal 184: 326-332.
-
Shi H, Li W, Zhong L, Xu C (2014) Methylene blue adsorption from aqueous solution by magnetic cellulose/ graphene oxide composite: equilibrium, kinetics, and thermodynamics. Industrial & Engineering Chemistry Research 53(3): 1108-1118.
-
Wang CB, Zhou JW, Chu LL (2015) Chlorine-functionalized reduced graphene oxide for methylene blue removal. RSC Advances 5(65): 52466-52472.
-
Zhang M, Gao B, Yao Y, Xue Y, Inyang M (2012) Synthesis, characterization, and environmental implications of graphene-coated biochar. Science of the Total Environment 435-436: 567-572.
-
Cong HP, Ren XC, Wang P, Yu SH (2012) Macroscopic multifunctional graphene-based hydrogels and aerogels by a metal ion induced self-assembly process. ACS Nano 6(3): 2693-2703.
-
Li C, Shi G (2012) Three-dimensional graphene architectures. Nanoscale (18): 5549-5563.
-
Ji CC, Xu MW, Bao SJ (2013) Self-assembly of three- dimensional interconnected graphene-based aerogels and its application in supercapacitors. Journal of Colloid and Interface Science 407: 416-424.
-
Qian Y, Ismail IM, Stein A (2014) Ultralight, high-surface- area, multifunctional graphene-based aerogels from self-assembly of graphene oxide and resol. Carbon 68: 221-231.
-
Cai D, Song M (2010) Recent advance in functionalized graphene/polymer nanocomposites. Journal of Materials Chemistry 20(37): 7906-7915.
-
Vickery JL, Patil AJ, Mann S (2009) Fabrication of graphene–polymer nanocomposites with higher-order three-dimensional architectures. Advanced Materials 21(21): 2180-2184.
-
Bai H, Li C, Shi G (2011) Functional composite materials based on chemically converted grapheme. Advanced Materials 23(9): 1088-1088.
-
Xu YX, Wu Q, Su YQ, Bai H, Gaoquan S (2010) Three- dimensional self-assembly of graphene oxide and DNA into multifunctional hydrogels. ACS Nano 4(12): 7358- 7362.
-
Bi H, Xie X, Yin K, Yilong Z, Shu W, et al. (2012) Graphene: spongy graphene as a highly efficient and recyclable sorbent for oils and organic solvents. Advanced Functional Materials 22(21): 4401-4401.
-
Wang J, Shi Z, Fan J, Ge Y, Yin J, et al. (2012) Self-assembly of graphene into three-dimensional structures promoted by natural phenolic acids. Journal of Materials Chemistry 22(42): 22459-22466.
-
Wang K, Ruan J, Song H, Zhang JL, Wo Y, et al. (2011) Biocompatibility of graphene Oxide. Nanoscale Res Lett 6(1): 8-13.
-
Schinwald A, Murphy FA, Jones A, MacNee W, Donaldson K (2011) Graphene-based nanoplatelets: a new risk to the respiratory system as a consequence of their unusual aerodynamic properties. ACS Nano 6(1): 736-746.
-
Papageorgiou SK, Katsaros FK, Kouvelos EP, Nolan JW, Le Deit H, et al. (2006) Heavy metal sorption by calcium alginate beads from Laminaria digitata. J Hazard Mater 137(3): 1765-1772.
-
Park HG, Chae MY (2004) Novel type of alginate gel- based adsorbents for heavy metal removal. J Chem Technol Biotechnol 79(10): 1080-1083.
-
Tam NFY, Wong YS, Simpson CG (1998) Repeated removal of copper by alginate beads and the enhancement by microalgae. Biotechnol Tech 12(3): 187-190.
-
Sartori C, Finch DS, Ralph B, Gilding K. (1997) Determination of the cation content of alginate thin films by FTi.r. spectroscopy. Polymer 38(1): 43-51.
-
Kuhn SP, Pfister RM (1989) Adsorption of mixed metals and cadmium by calcium-alginate immobilized Zoogloea ramigera. Appl Microbiol Biotechnol 31(5): 613-618.
-
Ai L, Zhang C, Chen Z (2011) Removal of methylene blue from aqueous solution by a solvothermal-synthesized graphene/magnetite composite. J Hazard Mater 192(3): 1515-1524.
-
Rocher V, Siaugue JM, Cabuil V, Bee A (2008) Removal of organic dyes by magnetic alginate beads. Water Res 42(4-5): 1290-1298.
-
Tabrizi NS, Yavari M (2015) Methylene blue removal by carbon nanotube-based aerogels. Chemical Engineering Research and Design 94: 516-523.
-
Kabiri R, Namazi H (2014) Nanocrystalline cellulose acetate (NCCA)/graphene oxide (GO) nanocomposites with enhanced mechanical properties and barrier against water vapor. Cellulose 21(4): 3527-3539.
-
Kafy A, Sadasivuni K K, Kim HC, Akther A, Kim J (2015) Designing flexible energy and memory storage materials using cellulose modified graphene oxide nanocomposites. Physical Chemistry Chemical Physics 17(8): 5923-5931.
-
Habibi Y, Chanzy H, Vignon MR (2006) TEMPO-mediated surface oxidation of cellulose whiskers. Cellulose 13(6): 679-687.
-
Saito T, Isogai A (2004) TEMPO-mediated oxidation of native cellulose. The effect of oxidation conditions on chemical and crystal structures of the water-insoluble fractions. Biomacromolecules 5(5): 1983-1989.
-
Shimizu M, Fukuzumi H, Saito T, Isogai A (2013) Preparation and characterization of TEMPO- oxidized cellulose nanofibrils with ammonium carboxylate groups. International Journal of Biological Macromolecules 59: 99-104.
-
Javadi A, Zheng Q, Payen F (2013) Polyvinyl alcohol- cellulose nanofibrils-graphene oxide hybrid organic aerogels. ACS Applied Materials Interfaces 5(13): 5969- 5975.
-
Dinescu S, Ionita M, Ignat SR, Costache M, Hermenean A (2019) Graphene oxide enhances chitosan-based 3D scaffold properties for bone tissue engineering. Int J Mol Sci 20(20): 5077-5082.
-
Bherwani A, Chang CC, Pelled G, Gazit Z, Gazit D, et al. (2019) The influence of polymer blends on regulating chondrogenesis. Coatings 9(7): 451-959.
-
Dinescu S, Ionita M, Pandele AM, Galateanu B, Iovu H, et al. (2014) In vitro cytocompatibility evaluation of chitosan/graphene oxide 3D scaffold composites designed for bone tissue engineering. Biomed Mater Eng 24(6): 2249-2256.
-
Dinescu S, Gălă teanu B, Albu M, Lungu A, Radu E, et al. (2013) Biocompatibility assessment of novel collagen- sericin scaffolds improved with hyaluronic acid and chondroitin sulfate for cartilage regeneration. Biomed Res Int: 598056-598061.
-
Ionita M, Pandele MA, Iovu H (2013) Sodium alginate/ graphene oxide composite films with enhanced thermal and mechanical properties. Carbohydr Polym 94(1): 339-344.
-
Cernencu AI, Lungu A, Dragusin D, Serafim A, Vasile E, et al. (2017) Design of cellulose–alginate films using PEG/NaOH aqueous solution as co-solvent. Cellulose 24: 4419-4431.
-
Cernencu AI, Lungu A, Stancu IC, Serafim A, Heggset E, et al. (2019) Bioinspired 3D printable pectin-nanocellulose ink formulations. Carbohydr Polym 220: 12-21.
-
Nisal A, Sayyad R, Dhavale P, Khude B, Deshpande R, et al. (2018) Venugopalan, P. Silk fibroin micro-particle scaffolds with superior compression modulus and slow bioresorption for effective bone regeneration. Sci Rep 8: 1-10.
-
Muntean SG, Paska O, Coseri S, Simu GM, Grad ME, et al. (2013) Evaluation of a functionalized copolymer as adsorbent on direct dyes removal process: Kinetics and equilibrium studies. Journal of Applied Polymer Science 127(6): 4409-4421.
- Superposition of Cryo-EM and AlphaFold Predictions of Dengue Antigen-Antibody Complexes
- Jugular-Applied Coherent Low-Level Laser Therapy Enhances Systemic Mitochondrial Metabolic Function and Antioxidant Response
- Role of OMC32 Polypeptide in Acrosin-Mediated Exocytosis during the Bovine Sperm Acrosome Reaction
- Association of Galectin-3 but not Laminin in Tamoxifen-Induced Growth Suppression in Breast Cancer MCF-7 Cells
- Effect of Different Wavelengths of Light on the Rate of Photosynthesis
- Nutritional, Therapeutic, and Environmental Effect of Oyster Mushrooms: An Editorial