Effect of Krill, Mussel and Fish Meals on Fatty Acid Profile, Carotenoid Content, Colour and Oxidation Properties of White Muscle in Arctic Charr (Salvelinus Alpinus L.)
Production of good quality fish muscle with reduced use of fish meal (FM) and oil (FO) is of great interest in aquaculture. This study tested 13 diets including (FM), krill meal (KM) or mussel meal (MM) and with rapeseed oil (RO) or RO+FO+KO (krill oil) (mixed oil, MO) or FO+KO (FKO) as the lipid source. These were fed to Arctic charr (Salvelinus alpinus) (initial weight 104.5±20.8 g, final weight 276.7±106.2, n=12) and their effects on FA profile, astaxanthin (AST) content and colour (a* value) of white muscle investigated. The FA profile of RO groups was characterised by monounsaturated fatty acids, α-linolenic acid and n-6 polyunsaturated fatty acids (PUFA), while FKO groups were mainly rich in saturated fatty acids (16:0, 14:0, 18:0), 16:1n-7 and n-3 PUFA, with a high n-3/n-6 ratio in the FA profile. Feeding KM, MM, KO gave positive effects on deposition of n-3 PUFA and AST. One group fed an AST-deficient diet showed comparable levels of arachidonic acid, eicosapentaenoic acid and docosahexaenoic acid to other groups, although the diet contained much lower levels of these FA. Another group fed a diet including the highest levels of KO (8.1%) and KM (29.4%) exhibited the highest n-3 PUFA level, n-3/n-6 ratio, AST content, a* value and thiobarbituric reactive substances (TBARS) value. In conclusion, KM, KO and MM could be used to improve the FA profile and colour properties of Arctic charr white muscle. AST not only affects colour properties, but also FA metabolism. Practical applications: It was found that the FA profile of muscle from Arctic charr fed high levels of MM, KO and KM were rich in n-3 PUFA and had a high n-3/n-6 ratio, high AST content and high a* value. These results indicate that KM, KO and MM can be used to improve lipid quality and colour property in fish fillet and can act as a potential substitute for FO and FM in salmonid aquaculture. The similar levels of n-3 PUFA in groups with and without sufficient AST in the diet fed group suggest that antioxidant deficiency may induce Arctic charr to use α-linolenic acid to form n-3 PUFA. This provides a possible avenue for low-cost accumulation of n-3 PUFA in fish fillet. All these results are beneficial information for improving the use of non-fish-based materials in salmonid farming.
Introduction
Many studies show beneficial effects of n-3 long chain polyunsaturated fatty acids (n-3 LCPUFA), mainly eicosapentaenoic acid (EPA, 20: 5n-3) and docosahexaenoic acid (DHA, 22: 6n-3), on prevention or treatment of cardiovascular disease, diabetes, some cancers (e.g. breast, colorectal) and other disorders [1, 2, 3]. Fish is currently the main source of n-3 LCPUFA in the human diet. In fish produced by aquaculture, these fatty acids (FA) are present in fish tissues, including fillets, as a result of diets containing fish oil (FO) and fish meal (FM). Most fish farmed in European aquaculture are predatory species, traditionally fed large proportions of FM and FO. However, recent rapid developments in aquaculture have driven the industry to exploit other resources for fish feed. Vegetable oils such as rapeseed (RO), linseed (LO) and palm oil are replacing FO in meeting the demand for oils in fish diets. In general, these substitutes have no significant effects on fish growth, but decreased n-3 LCPUFA level in fish fillet is common [4]. Colour is an important factor influencing the acceptability of food to consumers. For salmonids, the pink colour in muscle is considered an important criterion for fish quality. This colour is imparted by Carotenoid, mainly astaxanthin (AST) (3,3´-dihydroxy-β,β-carotene-4,4´-dione), deposited in the fillet [5]. AST is also a beneficial compound for human health due to its excellent anti-oxidative, scavenging activity. Studies on the effect of AST on human health report positive effects in the prevention and treatment of cardiovascular disease [6] and some cancers [7]. Fish cannot synthesise AST denovo and at present synthetic AST (most common product is Carophyll Pink, F. Hoffmann-La Roche Ltd., Switzerland) is commonly used in aqua feeds for farmed salmonids.
colour and thiobarbituric reactive substances (TBARS) in white muscle of Arctic charr (Salvelinus alpinus) were investigated.
Materials and Methods
Experimental design and materials
- The 13 diets where the protein source comprised FM, KM, MM and the lipid source RO, KO and LO with different formulas were designed using
- Modde v.9.1 (Umetrics, Umeå, Sweden), statistics software, which allows investigation of several variables [12]. In order to obtain an optimal response, a 13-type star model was used, where the centre point was the standard reference in the experiment (a mixture of all the different meals and oils). The other 12 diets were divided into three large groups based on the lipid source (Table 1). Six diets using RO as the single lipid source were designated RO groups (R1-R6); four diets including FO, KO and LO as lipid source were designated FKO groups (K1-K4); and two diets including a mixture of RO, FO, KO and LO as lipid source were designated MO groups
- (M1 and M2). Lipid and protein content were equivalent in all diets. Lipid content, FA profile and total Carotenoid content of the diets are shown in
- Table 2. FM was obtained from Triple nine, Esbjerg, Denmark. RO was purchased from local retailers. MM, KM and KO were provided by Olympic
- Seafood AS, Fosnavaag, Norway. MM was provided by Royal Seafood AB,
- Denmark. KM and KO were produced by enzymatic hydrolysis (see patent
- WO20100301939) [13].
Table 1: Diet codes and ingredients (%) of the experimental diets.
| Ingredient(%) | RO | MO | FKO | Control Diet | |||||||||
| Ingredient(%) | R1 | R2 | R3 | Control Diet | R4 | R5 | R6 | M1 | M2 | K1 | K2 | K3 | K4 |
| Rapeseed oil | 18 | 15 | 17.5 | 17 | 17 | 17 | 8.6 | 8.5 | 0 | 0 | 0 | 0 | 0 |
| Linseed oil | 0 | 0 | 0 | 0 | 0 | 0 | 1.6 | 1.5 | 2.8 | 2.7 | 2.9 | 2.8 | 2.8 |
| Fish oil | 0 | 0 | 0 | 0 | 0 | 0 | 2.8 | 2.8 | 5.7 | 5.3 | 5.8 | 5.6 | 5.4 |
| Krill oil | 0 | 0 | 0 | 0 | 0 | 0 | 4.4 | 4.2 | 8.6 | 8 | 8.8 | 8.5 | 8.3 |
| Fish meal | 51 | 29 | 0 | 14.5 | 27.5 | 40.5 | 52.1 | 14.5 | 51.6 | 29 | 0 | 14.5 | 27.8 |
| Mussel meal | 0 | 0 | 58 | 29 | 27.5 | 0 | 0 | 29 | 0 | 0 | 58 | 29 | 18.5 |
| Krill meal | 0 | 29 | 0 | 14.5 | 0 | 13.5 | 0 | 14.5 | 0 | 29 | 0 | 14.5 | 9.3 |
| Wheat meal | 22.5 | 18.5 | 16 | 16.5 | 19.5 | 20.5 | 22 | 16.5 | 22.8 | 17.5 | 16 | 16.5 | 19.5 |
| Mineral/vitamin mix | 1 | 1 | 1 | 1 | 1 | 1 | 1 | 1 | 1 | 1 | 1 | 1 | 1 |
| Gelatine | 6 | 6 | 6 | 6 | 6 | 6 | 6 | 6 | 6.1 | 6 | 6 | 6 | 6 |
| Titaniumdioxide | 0.5 | 0.5 | 0.5 | 0.5 | 0.5 | 0.5 | 0.5 | 0.5 | 0.5 | 0.5 | 0.5 | 0.5 | 0.5 |
| Cellulose | 1 | 1 | 1 | 1 | 1 | 1 | 1 | 1 | 1 | 1 | 1 | 1 | 1 |
| TOTAL | 100 | 100 | 100 | 100 | 100 | 100 | 100 | 100 | 100 | 100 | 100 | 100 | 100 |
Table 2: Lipid content (% of wet weight), fatty acid profile (% of total fatty acids) and total carotenoid content (mg/kg diet) o
| Group | RO | MO | FKO | |||||||||||||||||||||||||||||||||||||
| Control | ||||||||||||||||||||||||||||||||||||||||
| Diet | ||||||||||||||||||||||||||||||||||||||||
| R1 | R2 | R3 | R4 | R5 | R6 | M1 | M2 | K1 | K2 | K3 | K4 | |||||||||||||||||||||||||||||
| Fatty Acids | ||||||||||||||||||||||||||||||||||||||||
| Lipid content | 24.1 | 27.8 | 21.2 | 27.2 | 22.3 | 26.2 | 23.3 | 25.9 | 22.9 | 30.4 | 22.6 | 25.7 | 25.7 | |||||||||||||||||||||||||||
| 14:0 | 1.79 | 5.06 | 0.9 | 2.99 | 1.53 | 3.35 | 6.18 | 7.31 | 10.7 | 11.7 | 11.4 | 11.9 | 10.9 | |||||||||||||||||||||||||||
| 16:0 | 7.59 | 12.5 | 6.09 | 9.15 | 6.83 | 9.62 | 12.3 | 13.6 | 17.9 | 19.6 | 18.1 | 19.6 | 18.8 | |||||||||||||||||||||||||||
| 18:0 | 1.66 | 1.72 | 1.74 | 1.65 | 1.56 | 1.64 | 1.94 | 1.67 | 1.99 | 1.76 | 2.32 | 2.14 | 2.04 | |||||||||||||||||||||||||||
| SFA | 12.2 | 20.2 | 9.79 | 14.8 | 11 | 15.7 | 21.5 | 23.5 | 31.4 | 33.8 | 32.5 | 34.4 | 32.7 | |||||||||||||||||||||||||||
| 16:1n-7 | 1.21 | 3.11 | 1.64 | 2.29 | 1.52 | 2.03 | 3.78 | 4.56 | 6.32 | 6.56 | 7.62 | 7.41 | 6.68 | |||||||||||||||||||||||||||
| 18:1n-9 | 49.9 | 41 | 51.6 | 46.1 | 50.5 | 45.5 | 33.5 | 32 | 16.8 | 16.5 | 15.7 | 16.4 | 16.7 | |||||||||||||||||||||||||||
| 18:1n-7 | 2.93 | 4.39 | 3.03 | 3.76 | 2.95 | 3.67 | 3.62 | 4.58 | 4.5 | 5.87 | 5.01 | 5.52 | 5.17 | |||||||||||||||||||||||||||
| 20:1n-9 | 3.31 | 2.36 | 1.44 | 2.01 | 2.5 | 2.7 | 4.76 | 2.7 | 5.88 | 3.74 | 4.11 | 4.34 | 4.86 | |||||||||||||||||||||||||||
| 22:1n-11 | 4.18 | 2.3 | 0 | 1.15 | 2.51 | 3.12 | 6.34 | 2.76 | 8.96 | 5.18 | 4.69 | 5.13 | 6.3 | |||||||||||||||||||||||||||
| MUFA | 62.4 | 54.2 | 58.1 | 56.1 | 60.6 | 58 | 53.2 | 47.7 | 44.5 | 39.9 | 38.9 | 40.6 | 41.5 | |||||||||||||||||||||||||||
| 18:2n-6 | 15.5 | 12.4 | 18.4 | 15.3 | 16.8 | 14.3 | 10.3 | 10.1 | 4.48 | 3.84 | 4.77 | 4.27 | 4.58 | |||||||||||||||||||||||||||
| 18:3n-6 | 0.32 | 0.24 | 0.38 | 0.31 | 0.33 | 0.28 | 0.47 | 0.41 | 0.54 | 0.39 | 0.63 | 0.52 | 0.52 | |||||||||||||||||||||||||||
| 20:4n-6 | 0.09 | 0.13 | 0.42 | 0.26 | 0.21 | 0.1 | 0.2 | 0.32 | 0.25 | 0.21 | 0.59 | 0.41 | 0.31 | |||||||||||||||||||||||||||
| n-6 PUFA | 16.1 | 12.8 | 19.3 | 16 | 17.5 | 14.7 | 11.1 | 11 | 5.41 | 4.54 | 6.28 | 5.39 | 5.58 | |||||||||||||||||||||||||||
| 18:3n-3 | 6.21 | 5.1 | 8.11 | 6.32 | 7.01 | 5.89 | 7.04 | 7.27 | 7.29 | 6.08 | 8.58 | 6.75 | 7.42 | |||||||||||||||||||||||||||
| 18:4n-3 | 0.37 | 0.22 | 0 | 0.15 | 0.19 | 0.27 | 0.62 | 0.24 | 0.78 | 0.44 | 0.41 | 0.55 | 0.62 | |||||||||||||||||||||||||||
| 20:5n-3 | 1.1 | 4.49 | 2.88 | 3.95 | 1.9 | 2.85 | 2.94 | 5.88 | 4.93 | 8.53 | 7.26 | 6.83 | 6.3 | |||||||||||||||||||||||||||
| 22:5n-3 | 0.12 | 0.15 | 0.11 | 0.16 | 0.14 | 0.13 | 0.27 | 0.27 | 0.41 | 0.39 | 0.48 | 0.37 | 0.39 | |||||||||||||||||||||||||||
| 22:6n-3 | 1.55 | 2.86 | 1.72 | 2.61 | 1.76 | 2.5 | 3.25 | 4.16 | 5.15 | 6.24 | 5.55 | 4.96 | 5.45 | |||||||||||||||||||||||||||
| n-3 PUFA | 9.35 | 12.8 | 12.8 | 13.2 | 11 | 11.7 | 14.2 | 17.9 | 18.7 | 21.8 | 22.4 | 19.6 | 20.3 | |||||||||||||||||||||||||||
| PUFA | 25.4 | 25.6 | 32.2 | 29.2 | 28.5 | 26.4 | 25.3 | 28.8 | 24.1 | 26.3 | 28.7 | 25 | 25.9 | |||||||||||||||||||||||||||
| n-3LCPUFA | 2.77 | 7.5 | 4.71 | 6.71 | 3.8 | 5.49 | 6.46 | 10.3 | 10.5 | 15.2 | 13.3 | 12.2 | 12.2 | |||||||||||||||||||||||||||
| n-3/n-6 | 0.58 | 1 | 0.66 | 0.83 | 0.63 | 0.79 | 1.27 | 1.63 | 3.45 | 4.8 | 3.57 | 3.63 | 3.63 | |||||||||||||||||||||||||||
| Total Carotenoid | 10.1 | 131.4 | 66.9 | 81.7 | 45.9 | 52.1 | 55.1 | 73.6 | 52.6 | 182.9 | 89.9 | 174.4 | 91 |
Fish feeding and sampling
Arctic charr with initial weight 104.5±20.8 g were fed the experimental diets for 15weeks at Kälarne Aquaculture Centre, Sweden. The 12 experimental diets were fed to fish in 12 different tanks (1 m3), each containing 12 fish. Another three tanks were assigned to the control (standard reference) diet. The temperature of the water was 5-17°C during the rearing period, following the natural cycle. Feeding was stopped three days before sampling. Initial length and weight and final length and weight were recorded. Condition factor (CF) and daily growth coefficient (DGC) were calculated according to: CF=Weight (g)*100*Length-3 (cm) and
| 100*(3 | EndWeight3 | StartWeight |
|---|
Before sampling, the fish were anesthetised by tricane methane sulphonate 222 (30 ml/l) and killed by rupture of the vertebral column. White muscle in dorsal muscle mass was dissected; the left part was used for lipid and carotenoid analysis and right part for colour analysis. The fillet was immediately packed in aluminium foil and frozen on dry ice. All samples were stored at -80°C until further analysis.
Fatty acid analysis
Lipids from white muscle and the diets were extracted following the method of Trattneret et al. [14] and methylated with boron trifluoride according to Appelqvist [15]. Thereafter, the methylated FA were analysed in a Varian CP-3800 gas chromatograph system (Agilent Technologies, Santa Clara, CA, USA) equipped with a flame ionisation detector, fused silica capillary column BPX 70, 50 m length × 0.22 mm I.D. × 0.25 µm film thickness (SGE, Austin, USA) and auto-sampler in split mode (Combi PAL AutoSampler, Varian AB, Stockholm, Sweden). Helium was used as the carrier gas (0.8 mL/min) and nitrogen as the make-up gas. The column temperature programme followed the method used by Trattner, et al. [14]. FA were identified by comparison retention time with the standard FA mixture GLC-461 (Nu-check-Prep, Inc., Elysian, Minnesota, USA) and retention time. Star Chromatography Workstation software version 5.5 (Varian AB, Sweden) was used for peak area integration. As internal standard, methyl 15-methylheptadecanoate (Larodan Fine Chemicals AB, Malmö, Sweden) was added to the methylated samples.
Total carotenoid analysis
The lipid extracts were used for carotenoid analysis. Total carotenoid content (TC) of muscle and diet was analysed by the spectrophotometric method described by Tolasa, et al. [16]. Absorbance at 480 nm was measured by spectrophotometer (UV-2401 (PC) CE, Shimadzu). The concentration of Carotenoid was calculated according to the formula: Concentration (mg/l) = Absorbance*10000/2100, Where 2100 is E (1%, 1 cm) = standard absorbance of AST solution with 1% (w/v) in spectrobath with1 cm in hexane at 480 nm and 10000 is the scale factor. Carotenoid content was expressed as mg/kg muscle (or diet). Average retention rate of total Carotenoid (RTC) was calculated as [17]: RTC (%) = 100 * 0.61 * (CF*WF-CI*WI) / (105*20*CD/12), where CF, CI is the Carotenoid content in white muscle (mg/kg muscle) in final fish, initial fish; WF, WI is the weight (g) of final fish, initial fish; CD is the carotenoid content in the diet (mg/kg); 0.61 is the average muscle fraction in whole fish (61%); 105 is feeding days; 20 is weight of diet fed to each tank per day; and 12 is number of fish per tank.
Specific Carotenoid analysis
The content of Carotenoid in white muscle was analysed using a high performance liquid chromatography (HPLC) (Bischoff Analysentechnikund Geräte GmbH, Leonberg, Germany) equipped with an Agilent 1100 series diode array detector (Agilent Technologies, Waldronn, Germany). Separation was performed under the following operating conditions: normal phase column, Alltech SI 5µ silica column, 4.6 x 250 mm (Alltech Associates Inc., Deerfield, IL); column temperature, 40°C; mobile phase, hexane: isopropanol (94:6, v:v); isocratic elution, flow rate 1.4 ml/min; injection volume, 10µl; detection wavelength, 480nm. Peaks were manually integrated using the software HP ChemStation Version 05.01. Standards including AST (Dr. Ehrenstorfer, Germany) and canthaxanthin (Fluka-Sigma, St. Louis, MO, USA) were used to identify peaks in the samples. Carotenoid content was quantified by standard curves run with different concentrations and expressed as mg/kg muscle.
Colour property analysis
White muscle was thawed on an orange board (similar colour to white muscle) at room temperature for 1h until its central temperature reached 15°C and it was soft enough for measurement by Minolta Chroma Meter CR-300 (Minolta, Osaka, Japan). The juice around the white muscle after thawing (not much juice loss was observed) was removed. The Chroma Meter was equipped with an 8 mm diameter aperture and calibrated on a white reference plate before use. Measurements were made at four points on the fillet. All measurements were performed in the colorimetric space L*, a*, b* according to the Commission Internationale de Éclairagesystem [18]. They were then transformed in the L*, C*, H(°)a*b*colorimetric space [19], in which the three-dimensional characteristics of colour appearance are the lightness attribute L*, chromatic attributes hue H(°), a*b* (arctan b*/a*) and chroma C*[(a*2+b*2)1/2].
Thiobarbituric reactive substances analysis
TBARS value was determined by a forced oxidation method, modified from Sigurgisladottir, et al. [20]. Water was added (0.5 ml) to fish white muscle (1 g) and it was heated at 90 ºC for 5 min to cause oxidation. The heated samples were cooled to room temperature and then 10% trichloroacetic acid was added and the samples were homogenised to extract malondialdehyde. The lysate was filtered and incubated with thiobarbituric acid in a water bath at 90 ºC for 45 minutes. Thereafter the samples were cooled to room temperature, centrifuged at 500 rpm for 10min and the absorbance was measured at 532 nm. TBARS values were expressed as nmol/kg muscle.
Data analysis
To study the effects of various components in the diets, three comparisons with different groups were made for each parameter. Comparison 1 involved groups R1, R4, M1, M2, K1 and K4 (to study the effect of lipid source); comparison 2 involved groupsR1, R2, R3, R4 and R5 (to study the effect of the protein source); and comparison 3 involved groups K1, K2, K3 and K4 (to study the effect of protein source). Data on FA, colour properties and oxidation were first analysed by partial least squares-discriminant analysis (PLS-DA) in SIMCA-P+13.0 (Umetrics, Umeå, Sweden). Comparisons of parameters between specific groups were performed by general linear model (GLM) analysis in SAS 9.3 (SAS Institute Inc., Cary, NC) with data subjected to arcsine square root transformation or logarithmic transformation when necessary. Comparison 1 was performed with a Bonferroni test, comparison 2 with a Scheffe test and comparison 3 with a Duncan test. Significance level was set to P<0.05 unless otherwise stated. Data presented are mean±SD. We also compared the data for each group with those for the control group. No significant difference was found.
Results
Fish growth
No mortality occurred during rearing of the fish. Fish length increased by about 7.0 cm and weight by about 170 g, giving a CF value of approximately 1.4 after 15 weeks of feeding in the experiment (Table 3). The highest DGC (1.94) was found in group M1 and the lowest in group R1 (1.31). No pattern was found in any of the three comparisons made with fish growth parameters in PLS-DA analysis (data not shown). Statistical analysis suggested that there were no significant differences in fish growth parameters between any of the groups.
| End | ||||||||||||||||||||||||||
| Group | Start Weight | Start length | Start CF | End Weight | End CF | DGC | Liver Weight | |||||||||||||||||||
| length | ||||||||||||||||||||||||||
| RO | R1 | 104.6±18.8 | 19.2±1.3 | 1.47±0.15 | 225.0±77.1 | 25.4±2.1 | 1.33±0.17 | 1.31 | 2.67±1.26 | |||||||||||||||||
| R2 | 103.4±14.4 | 19.0±0.5 | 1.50±0.12 | 284.6±86.5 | 26.8±2.4 | 1.43±0.16 | 1.79 | 4.16±1.79 | ||||||||||||||||||
| R3 | 103.1±16.2 | 19.4±1.2 | 1.40±0.12 | 261.2±63.5 | 26.2±1.6 | 1.42±0.15 | 1.62 | 4.22±1.42 | ||||||||||||||||||
| R4 | 105.1±24.2 | 19.8±1.2 | 1.33±0.13 | 284.7±144.5 | 26.8±3.3 | 1.36±0.18 | 1.77 | 4.62±3.45 | ||||||||||||||||||
| R5 | 105.0±23.7 | 19.6±1.5 | 1.37±0.09 | 297.1±103.1 | 27.5±2.4 | 1.38±0.12 | 1.86 | 4.85±2.07 | ||||||||||||||||||
| MO | M1 | 109.4±21.0 | 19.2±1.2 | 1.54±0.12 | 289.5±142.5 | 26.5±3.1 | 1.45±0.24 | 1.75 | 4.01±2.69 | |||||||||||||||||
| M2 | 100.7±10.1 | 19.2±0.7 | 1.42±0.11 | 297.7±89.9 | 27.0±2.3 | 1.47±0.16 | 1.94 | 4.14±1.63 | ||||||||||||||||||
| FKO | K1 | 114.8±28.4 | 20.1±1.3 | 1.39±0.13 | 284.6±105.8 | 27.2±2.4 | 1.36±0.15 | 1.64 | 3.79±1.00 | |||||||||||||||||
| K2 | 104.4±23.5 | 19.6±1.4 | 1.36±0.14 | 285.2±135.3 | 26.8±3.2 | 1.38±0.21 | 1.79 | 5.01±3.50 | ||||||||||||||||||
| K3 | 105.3±22.2 | 19.6±1.4 | 1.38±0.11 | 258.1±96.8 | 25.4±3.5 | 1.62±0.88 | 1.57 | 3.85±1.44 | ||||||||||||||||||
| K4 | 104.6±28.5 | 19.5±1.7 | 1.38±0.09 | 276.3±114.7 | 26.6±3.1 | 1.40±0.12 | 1.72 | 4.26±1.34 | ||||||||||||||||||
| Standard | 105.8±21.7 | 19.7±1.1 | 1.36±0.12 | 276.5±102.9 | 26.8±2.7 | 1.38±0.18 | 1.7 | 4.40±2.07 |
Table 5: Start and end weight (g), start and end length (mm), start and end condition factor (CF), daily growth coefficient (DGC)
Abbreviations: RO, groups fed diets used rapeseed oil as single lipid source; FKO, groups fed diets used fish, krill and linseed oil as lipid source; MO, groups fed diets used rapeseed, linseed, fish and krill oil as lipid source. Lipid content and fatty acids In comparison 1 (see ‘Data analysis’ section), there was a clear discrimination between groups R1, M1, K1 and groups R4, M2, K4 (Figure 1a). The RO groups (R1, R4) were close to the MUFA (monounsaturated fatty acids) 18:3n-3 (α-linolenic acid, ALA), 18:2n-6 (Linoleic acid, LA), 18:3n-6, 20:3n-6, n-6 polyunsaturated fatty acid (n-6 PUFA); the MO groups (M1 and M2) were close to lipid content (LC), n-3 PUFA and DHA; and the FKO groups (K1 and K4) were close to 16:0, 14:0, 18:0, 16:1n-7, SFA (saturated fatty acids), EPA, 22:5n-3 (docosapentaenoic acid, DPA) and n-3/n-6 (Figure 1a).
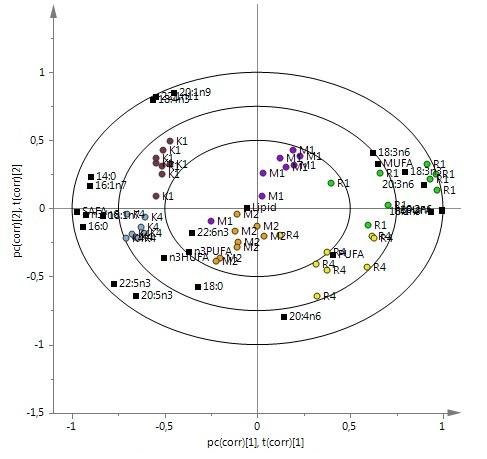
No differences in LC were found, but many FA differed. Levels of 14:0, 16:0 and SFA were higher in FKO groups (K1and K4) than in RO groups (R1 and R4) and MO groups (M1 and M2) (Table 4). No differences in total MUFA were found, but the levels of 16:1n-7, 18:1n-7 and 22:1n-11 was higher in FKO groups than in MO and RO groups. The levels of 20:3n-6 and total n-6 PUFA were higher in group R1 than in groups M1 and K1. For n-3 FA, differences were found between RO groups and FKO groups. The proportions of 18:4n-3 and DPA were higher but the ALA level was lower in FKO group than in RO groups. EPA in group K1 showed a higher level than in group R1 and there were no differences in DHA and n-3 PUFA in the six groups. However, n-3/n-6 of FKO groups was higher than in the RO and MO groups. There were also some differences in 18:0, SFA, 18:1n-7, 22:1n-11, 20:3n-6, EPA and DPA between group M1 and group M2.
In comparison 2, discrimination was observed in the FA profile of four groups (Figure 1b). 20:3n-6, LA, n-6 PUFA, 18:1n-9 and MUFA were close to group R5, while 14:0, 16:0, SFA, 18:1n-7, EPA, DPA, n-3 LCPUFA and n- 3/n-6 were close to group R2. Group R1 was near ALA, 18:3n-6 and 20:1n- 9. Group R1 had similar levels of 14:0, 16:0 and SFA to groups R3 and R4 but lower levels than group R2. The levels of 20:1n-9 and 22:1n-11 in group R1were higher than in groups R2, R3 and R5. No difference in n-6 FA was observed between groups R1 and R3, R5. Nevertheless, most n-6 FA showed a higher level in group R1 than in group R2. 18:4n-3 proportion in group R1 was higher than in the other groups and the levels of EPA and DPA were lower than in group R2. In comparisons between groups R5, R2 and R3, no differences in n-3 FA were found, but levels of most n-6 FA in group 5 were higher than in group R2. No differences were found in LC.
except for 20:4n-6 (arachidonic acid, AA), which was most abundant in group K3. For n-3 FA, the levels of ALA and 18:4n-3 were higher in group K1 than in groups K2 and K3, while the levels of EPA and DHA were lower. Group K1 showed lower total n-3 PUFA level and n-3/n-6 ratio compared with groups K2 and K3. Group K4 had some differences to the other three groups in terms of FA. Its level of most FA showed intermediate values between group K2 and group K3.
Table 6: Lipid content (% of wet muscle), fatty acid profile (% of total fatty acids) in white muscle of Arctic charr (n=8, for standard n=24).
| C | ompariso | n | Comparison 1 | Comparison 2 | Comparison 3 | |||||||||||||||||||||||||||||||||||||||||||||
| Group | Control | |||||||||||||||||||||||||||||||||||||||||||||||||
| Diet | ||||||||||||||||||||||||||||||||||||||||||||||||||
| R1 | R4 | M1 | M2 | K1 | K4 | R1 | R2 | R3 | R4 | R5 | K1 | K2 | K3 | K4 | ||||||||||||||||||||||||||||||||||||
| Fatty | ||||||||||||||||||||||||||||||||||||||||||||||||||
| Acids | ||||||||||||||||||||||||||||||||||||||||||||||||||
| Lipid % 14:0 16:0 18:0 SFA 16:1 n-7 18:1 n-9 18:1 n-7 20:1 n-9 22:1 n-11 MUFA 18:2 n-6 18:3 n-6 20:3 n-6 20:4 n-6 n-6 PUFA 18:3 n-3 18:4 n-3 20:5 n-3 22:5 n-3 22:6 n-3 n-3 PUFA PUFA n-3/n-6 | 1.79±0.53 2.13±0.77 1.79±0.44 2.26±0.90 1.99±0.43 2.35±0.89 1.56d±0.25 2.0c±0.47 2.9b±0.74 3.3b±0.54 4.6a±0.89 4.0a±0.67 12.0e±2.49 13.de±2.95 13.9cd±2.53 14.5bc±3.02 15.5ab±3.08 14.9a±3.52 2.12b±0.52 2.28ab±0.38 1.90b±0.28 2.21a±0.43 1.93b±0.38 2.00a±0.43 16.3e±3.26 18.6d±3.68 19.3c±3.32 20.6b±0.77 22.6a±4.37 21.5a±4.51 2.01d±0.36 2.67c±0.78 3.09b±0.53 3.64b±0.53 4.69a±0.90 4.14a±1.04 27.1a±6.12 26.0a±4.58 20.3b±4.87 19.0b±2.84 14.4c±2.65 12.7c±2.19 2.19d±0.42 2.88c±0.45 2.70c±0.66 3.18b±0.47 3.33ab±0.66 3.36a±0.54 2.49±0.47 2.02±0.46 2.70±0.50 2.16±0.40 2.91±0.61 2.24±0.42 2.58cd±0.43 1.64e±0.61 3.11b±0.56 2.12d±0.44 3.60a±0.80 2.50bc±0.45 37.1a±7.57 35.9ab±6.23 32.8ab±7.22 30.8ab±4.61 29.8ab ±5.68 25.7b±4.56 9.07a±2.26 7.85a±1.25 5.90b±1.45 5.10b±0.74 3.41c±0.72 2.69c±0.52 0.43a±0.21 0.24b±0.06 0.25b±0.07 0.24b±0.05 0.23b±0.06 0.16b±0.02 0.48a±0.14 0.30b±0.04 0.27b±0.08 0.18c±0.04 0.18c±0.03 0.12d±0.03 0.52a±0.10 0.63a±0.17 0.38bc±0.09 0.48ab±0.15 0.36c±0.08 0.45a±0.14 10.9a±2.77 9.37b±1.34 7.10c±1.68 6.26c±0.96 4.37d±0.90 3.58d±0.71 5.78a±2.28 4.22b±0.95 3.84bc±1.08 3.60bc±0.57 3.23bc±0.80 2.58c±0.40 0.36±0.07 0.23±0.09 0.44±0.08 0.31±0.08 0.52±0.10 0.36±0.07 3.66d±0.62 5.51ab±1.49 4.05dc±0.93 5.15ab±1.50 4.55bc±0.97 5.37ab±1.26 0.71e±0.12 0.97dc±0.22 0.79de±0.16 1.02ab±0.24 0.89bc±0.17 0.98a±0.20 12.5±2.69 13.9±5.22 13.9±3.78 12.4±4.62 13.4±3.24 11.9±4.15 23.3±5.01 25.0±7.26 23.3±4.95 22.6±6.63 22.7±4.97 21.3±5.83 34.2a±7.33 34.4ab±7.69 30.4b±5.92 28.9ab±7.30 27.1b±5.80 24.9ab±6.48 2.19c±0.42 2.50bc±1.72 3.40b±0.96 3.58b±0.74 5.21a±0.50 5.92a±0.77 | 1.79±0.53 2.33±1.01 1.90±0.40 2.13±0.77 2.08±1.05 1.5c±0.25 2.7a±0.42 1.1d±0.25 2.0b±0.47 1.3dc±0.26 12.0b±2.49 14.1a±3.14 12.3b±2.73 13.7ab±2.95 12.8b±2.80 2.12b±0.52 2.04b±0.45 2.5a±0.46 2.28b±0.38 2.39ab±0.36 16.3b±3.26 19.4a±3.94 16.7b±3.38 18.6b±3.68 17.2a±3.35 2.01±0.36 2.58±0.44 2.28±0.48 2.67±0.78 2.18±0.43 27.1±6.12 24.1±3.97 29.5±4.01 26.0±4.58 30.3±4.68 2.19c±0.42 3.27a±0.48 2.41c±0.34 2.88b±0.45 2.40c±0.34 2.49a±0.47 1.83b±0.32 1.93b±0.29 2.02b±0.46 2.31ab±0.26 2.58a±0.43 1.73b±0.31 1.16c±0.29 1.64bc±0.61 1.90b±0.32 37.1±7.57 34.3±5.31 37.8±5.03 35.9±6.23 39.7±5.73 9.07ab±2.26 7.04c±1.08 9.38a±1.31 7.85bc±1.25 9.59ab±1.28 0.43a±0.21 0.29ab±0.10 0.30ab±0.06 0.24b±0.06 0.32ab±0.05 0.48a±0.14 0.21c±0.06 0.44a±0.10 0.30b±0.04 0.51a±0.13 0.52b±0.10 0.35c±0.12 0.87a±0.25 0.63ab±0.17 0.79ab±0.26 10.9a±2.77 8.16b±1.28 11.5a±1.67 9.37b±1.34 11.7a±1.52 5.78a±2.28 4.39ab±0.96 4.82ab±0.76 4.22b±0.95 5.13ab±0.75 0.36a±0.07 0.23bc±0.05 0.15c±0.05 0.23bc±0.09 0.27b±0.05 3.66c±0.62 5.83a±1.72 4.38bc±1.34 5.51ab±1.49 3.98c±1.30 0.71b±0.12 0.96a±0.29 0.88ab±0.21 0.97a±0.22 0.84ab±0.20 12.5 ±2.69 12.6±5.25 12.2±4.61 13.9±5.22 12.7±5.42 23.3±5.01 24.2±8.07 22.6±6.66 25.0±7.26 23.1±6.95 34.2±7.33 32.4±8.85 34.10±7.80 34.4±7.69 34.8±7.54 2.19±0.42 2.97±0.86 1.96±0.45 2.50±1.72 1.98±0.56 | 1.99±0.43 2.04±0.75 1.77±0.48 2.35±0.89 4.65±0.89 4.28±1.08 3.82±0.82 4.08±0.67 15.5b±3.08 17.2a±4.92 15.4b±3.37 14.9ab±3.52 1.93c±0.38 1.95c±0.51 2.29a±0.52 2.00b±0.43 22.6b±4.37 23.9a±6.14 22.0ab±4.51 21.5ab±4.51 4.69±0.90 4.06±0.91 4.33±0.80 4.14±1.04 14.4±2.65 12.4±2.31 12.1±1.96 12.7±2.19 3.33b±0.66 3.77a±0.71 3.08b±0.48 3.36a±0.54 2.91a±0.61 2.14c±0.34 2.24bc±0.32 2.24b±0.42 3.60a±0.80 2.62bc±0.46 2.32c±0.30 2.50b±0.45 29.8a±5.68 25.9b±4.77 24.7b±3.81 25.7ab±4.56 3.41a±0.72 2.47c±0.32 2.58c±0.35 2.69b±0.52 0.23a±0.06 0.15b±0.04 0.17b±0.04 0.16b±0.02 0.18a±0.03 0.11c±0.02 0.14b±0.02 0.12b±0.03 0.36c±0.08 0.35c±0.12 0.70a±0.15 0.45b±0.14 4.37a±0.90 3.21c±0.47 3.82b±0.54 3.58b±0.71 3.23a±0.80 2.44b±0.55 2.59ab±0.48 2.58ab±0.40 0.52a±0.10 0.32c±0.05 0.35bc±0.06 0.36b±0.07 4.55c±0.97 6.66a±1.77 5.86b±1.24 5.37b±1.26 0.89c±0.17 1.13b±0.29 1.17a±0.22 0.98b±0.20 13.4±3.24 14.5±5.81 14.7±3.83 11.9±4.15 22.7b±4.97 25.1ab±7.76 24.8ab±5.42 21.3ab±5.83 27.1±5.80 28.3±8.14 28.6±5.86 24.9±6.48 5.21c±0.50 7.73a±1.58 6.46b±0.84 5.92b±0.77 | 2.06±0.59 5.37±0.67 20.3±1.8 2.75±0.26 20.0±1.8 5.49±0.85 16.9±2.39 4.33±0.36 3.14±0.39 3.69±0.45 34.6±3.6 3.82±0.64 0.27±0.05 0.18±0.02 0.59±0.09 5.09±0.62 4.00±0.58 0.56±0.08 7.30±0.74 1.38±0.11 17.9±3.36 31.3±3.59 36.4±3.30 6.26±1.17 |
Table 7: Colour parameters, content of canthaxanthin (CAN), astaxanthin (AST), total carotenoid (TC) (mg/kg muscle), retention ra
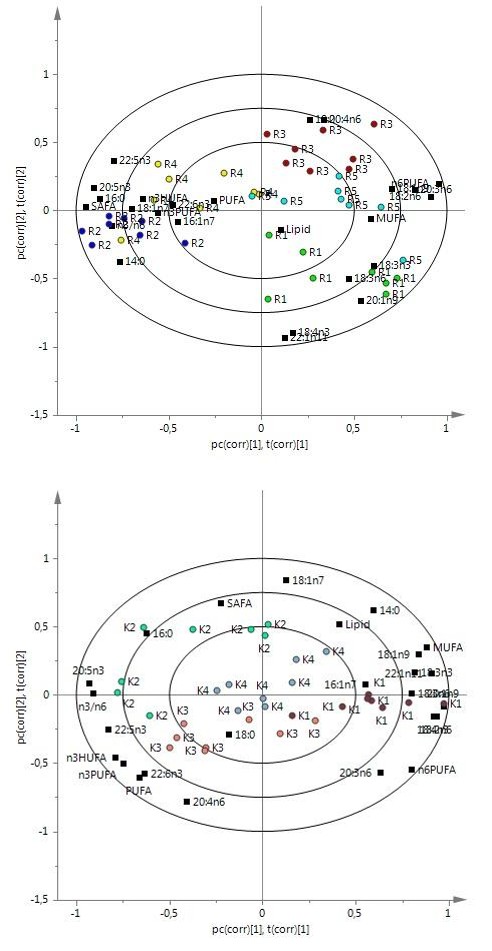
Colour properties and carotenoid
In comparison 1, clear clusters were found between groups R1, M1 and K1 and between groups K4, R4 and M2, with the H value separated from a*, b*, C*, AST content (AC) and TC (Figure 2a). The Bonferroni test showed that group R1 had lower values of a*, b*, C*, TC and a higher value of H than groups M1 and K1 (Table 5). Similar results were found between groups R4, M2 and K4 (some non-significant differences). A higher RTC in group R1 than in group M1 was also observed. There were no differences between groups M1 and K1 or between groups M2 and K4. Group R4 exhibited a lower a* value and higher H value than group K4. No differences were found between groups M1 and M2. In comparison 2, group R1 was separated from the other RO groups. Group R4 was close to a* and AC, while TC differed from groups R3 and R5; no distinct separation was seen in groups R2, R3 and R5 (Figure 2b). Group R1 showed many differences from other groups, with a lower a* value than groups R2 and R3, lower b*, C* and TC value than groups R2 and R5 and higher H value than group R2. Lower a* and TC value and higher H value were observed in group R5 compared with group R2. Group R4 exhibited similar levels of these parameters to group R2. In comparison 3, group K2 was close to C*, TC and AC and different from groups K1, K3 and K4 (Figure 2c). Group K2 showed higher levels of a*, b* and C* than groups K1 and K3 and its TC level was also higher than that of group K1. Group K3 exhibited similar levels of all parameters to group K1. AST is the main carotenoid found in the fish white muscle. A low level of canthaxanthin was detected only in group K3. No significant difference in AST level was found. Most groups showed a low AC (<3.5 mg/kg) and low RTC (1.32- 5.08%).
a
b
Figure (2a, 2b, 2c): PLS-DA analysis of colour properties (a*, b*, L*, C*, H value) and carotenoid in white muscle of Arctic charr (n=6): a, b, c are biplots of data from groups R1, R4, M1, M2, K1, K4, groups R1, R2, R3, R4, R5 and groups K1, K2, K3, K4, explaining 81.1%, 78.5% and 69.0% of variation in the samples, respectively. AC, astaxanthin content; TC, total carotenoid content; RTC, retention rate of total carotenoid.
Comparison Group L* a* b* C* H CAN AST TC RTC TBARS
Comparison 1
Comparison 2
Comparison 3
Standard 45.3±3.2 7.5±2.1 14.3±2.0 16.2±2.7 62.8±4. n.d 2.42±0.85 2.99±0.84 3.28 15.45±5.22 $$
R 1 \quad 5 3. 6 ^ {\mathrm {a}} \pm 4. 0 \quad 0. 3 ^ {\mathrm {c}} \pm
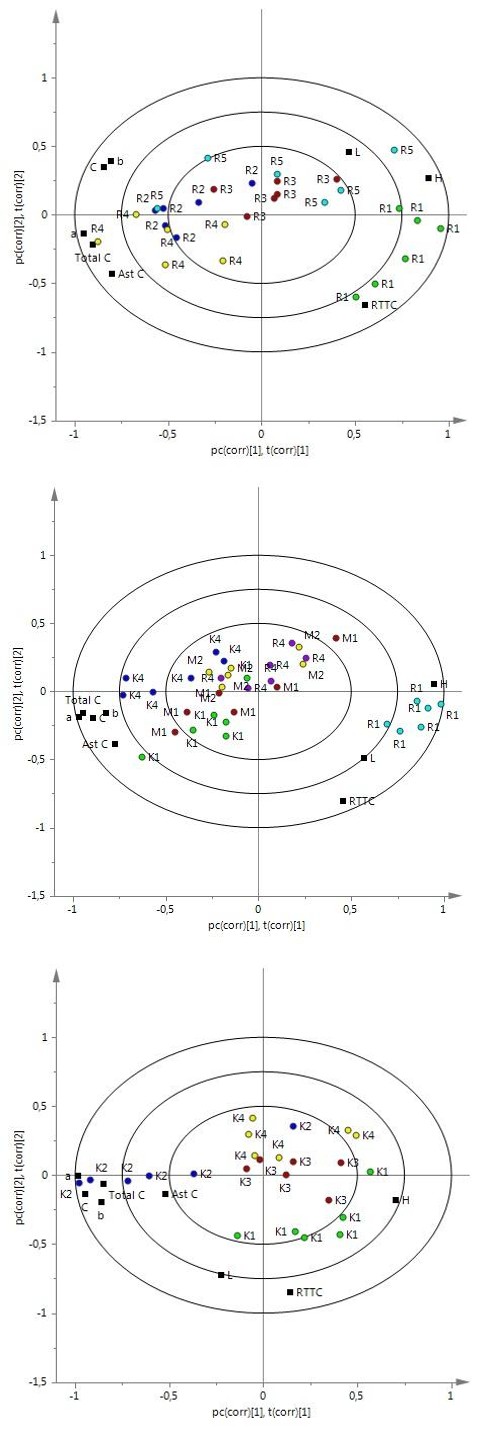
Standard 45.3±3.2 7.5±2.1 14.3±2.0 16.2±2.7 62.8±4. n.d 2.42±0.85 2.99±0.84 3.28 15.45±5.22 $$ R 1 \quad 5 3. 6 ^ {\mathrm {a}} \pm 4. 0 \quad 0. 3 ^ {\mathrm {c}} \pm 1. 1 \quad 8. 4 ^ {\mathrm {b}} \pm 0. 6 \quad 8. 4 ^ {\mathrm {b}} \pm 0. 5 \quad 8 8. 0 ^ {\mathrm {a}} \pm 8. 2 \quad \mathrm {n . d .} \quad 0. 3 1 \pm 0. 1 2 \quad 0. 7 7 ^ {\mathrm {b}} \pm 0. 2 1 \quad 5. 9 8 \quad 1 2. 8 6 ^ {\mathrm {b c}} \pm 3. 3 9 $$ $$ R 4 \quad 4 7. 7 ^ {a b} \pm 3. 3 \quad 4. 0 ^ {b} \pm 1. 6 \quad 1 3. 1 ^ {a} \pm 2. 5 \quad 1 3. 7 ^ {a} \pm 2. 8 \quad 7 3. 6 ^ {b} \pm 3. 8 \quad n. d. \quad 1. 0 6 \pm 0. 2 5 \quad 2. 1 3 ^ {a} \pm 0. 4 6 \quad 2. 5 9 \quad 1 1. 6 1 ^ {c} \pm 1. 7 4 $$ $$ M 1 \quad 4 8. 2 ^ {a b} \pm 4. 0 \quad 6. 4 ^ {a b} \pm 2. 9 \quad 1 4. 5 ^ {a} \pm 3. 7 \quad 1 5. 9 ^ {a} \pm 4. 4 \quad 6 7. 4 ^ {b c} \pm 7. 8 \quad \mathrm {n . d .} \quad 1. 3 3 \pm 0. 7 2 \quad 2. 4 1 ^ {a} \pm 0. 8 1 \quad 4. 4 1 \quad 1 2. 8 0 ^ {b c} \pm 3. 6 7 $$ $$ M 2 4 6. 5 ^ {\mathrm {b}} \pm 3. 7 5. 4 ^ {\mathrm {a b}} \pm 1. 9 1 3. 9 ^ {\mathrm {a}} \pm 2. 4 1 5. 0 ^ {\mathrm {a}} \pm 2. 8 6 9. 3 ^ {\mathrm {b c}} \pm 5. 2 \mathrm {n . d .} 0. 8 0 \pm 0. 2 9 2. 1 3 ^ {\mathrm {a}} \pm 0. 7 1 3. 0 1 2 3. 4 8 ^ {\mathrm {a}} \pm 5. 1 5 $$ $$ \mathrm {K 1} \quad 4 9. 1 ^ {\mathrm {a b}} \pm 1. 8 \quad 7. 7 ^ {\mathrm {a}} \pm 1. 8 \quad 1 4. 7 ^ {\mathrm {a}} \pm 2. 4 \quad 1 6. 7 ^ {\mathrm {a}} \pm 2. 6 \quad 6 2. 5 ^ {\mathrm {c}} \pm 4. 2 \quad \mathrm {n . d .} \quad 2. 7 7 \pm 1. 2 2 \quad 2. 6 9 ^ {\mathrm {a}} \pm 0. 5 3 \quad 5. 0 8 \quad 1 1. 1 4 ^ {\mathrm {c}} \pm 2. 3 5 $$ $$ \begin{array}{l l l l l l l l l l} \mathrm {K 4} & 4 4. 3 ^ {\mathrm {b}} \pm 3. 3 & 8. 2 ^ {\mathrm {a}} \pm 1. 8 & 1 4. 0 ^ {\mathrm {a}} \pm 1. 2 & 1 6. 2 ^ {\mathrm {a}} \pm 1. 8 & 6 0. 1 ^ {\mathrm {c}} \pm 4. 3 & \mathrm {n . d .} & 2. 5 9 \pm 1. 0 5 & 3. 0 3 ^ {\mathrm {a}} \pm 0. 7 5 & 1. 6 7 & 1 8. 4 8 ^ {\mathrm {a b}} \pm 3. 6 7 \end{array} $$ $$ R 1 \quad 5 3. 6 ^ {a b} \pm 4. 0 \quad 0. 3 ^ {c} \pm 1. 1 \quad 8. 4 ^ {b} \pm 0. 6 \quad 8. 4 ^ {b} \pm 0. 5 \quad 8 8. 0 ^ {a} \pm 8. 2 \quad n. d. \quad 0. 3 1 \pm 0. 1 2 \quad 0. 7 7 ^ {c} \pm 0. 2 1 \quad 5. 9 8 \quad 1 2. 8 6 ^ {a b} \pm 3. 3 9 $$ $$ R 2 \quad 5 2. 2 ^ {a b} \pm 2. 8 \quad 4. 4 ^ {a} \pm 0. 7 \quad 1 2. 8 ^ {a} \pm 1. 2 \quad 1 3. 5 ^ {a} \pm 1. 3 \quad 7 1. 2 ^ {b} \pm 2. 4 \quad n. d. \quad 0. 8 3 \pm 0. 3 0 \quad 1. 7 5 ^ {a} \pm 0. 3 6 \quad 1. 3 2 \quad 1 7. 0 7 ^ {a} \pm 6. 5 9 $$ $$ \mathrm {R 3} \quad 5 3. 8 ^ {\mathrm {a}} \pm 2. 9 \quad 2. 1 ^ {\mathrm {a b}} \pm 1. 1 \quad 1 1. 9 ^ {\mathrm {a b}} \pm 1. 4 \quad 1 2. 2 ^ {\mathrm {a b}} \pm 1. 6 \quad 8 0. 6 ^ {\mathrm {a b}} \pm 4. 3 \quad \mathrm {n . d .} \quad 0. 3 9 \pm 0. 1 2 \quad 1. 4 6 ^ {\mathrm {a b}} \pm 0. 3 5 \quad 1. 9 9 \quad 1 1. 6 5 ^ {\mathrm {b}} \pm 1. 4 5 $$ $$ R 4 \quad 4 7. 7 ^ {\mathrm {b}} \pm 3. 3 \quad 4. 0 ^ {\mathrm {a b}} \pm 1. 6 \quad 1 3. 1 ^ {\mathrm {a}} \pm 2. 5 \quad 1 3. 7 ^ {\mathrm {a}} \pm 2. 8 \quad 7 3. 6 ^ {\mathrm {b}} \pm 3. 8 \quad \mathrm {n . d .} \quad 1. 0 6 \pm 0. 2 5 \quad 2. 1 3 ^ {\mathrm {a}} \pm 0. 4 6 \quad 2. 5 9 \quad 1 1. 6 1 ^ {\mathrm {b}} \pm 1. 7 4 $$ $$ R 5 \quad 5 0. 8 ^ {a b} \pm 3. 5 \quad 1. 5 ^ {b c} \pm 2. 2 \quad 1 2. 9 ^ {a} \pm 3. 7 \quad 1 3. 1 ^ {a} \pm 3. 9 \quad 8 4. 5 ^ {a} \pm 8. 2 \quad n. d. \quad 0. 3 0 \pm 0. 2 9 \quad 1. 0 6 ^ {b c} \pm 0. 4 0 \quad 2. 4 \quad 9. 7 1 ^ {b} \pm 1. 3 7 $$ $$ \mathrm {K 1} \quad 4 9. 1 ^ {\mathrm {a}} \pm 1. 8 \quad 7. 7 ^ {\mathrm {b}} \pm 1. 8 \quad 1 4. 7 ^ {\mathrm {b}} \pm 2. 4 \quad 1 6. 7 ^ {\mathrm {b}} \pm 2. 6 \quad 6 2. 5 \pm 4. 2 \quad \mathrm {n . d .} \quad 2. 7 7 \pm 1. 2 2 \quad 2. 6 9 ^ {\mathrm {b}} \pm 0. 5 3 \quad 5. 0 8 \quad 1 1. 1 4 ^ {\mathrm {c}} \pm 2. 3 5 $$ $$ \mathrm {K 2} \quad 4 8. 0 ^ {\mathrm {a}} \pm 2. 8 \quad 1 2. 5 ^ {\mathrm {a}} \pm 2. 8 \quad 1 9. 0 ^ {\mathrm {a}} \pm 2. 4 \quad 2 2. 8 ^ {\mathrm {a}} \pm 3. 4 \quad 5 7. 0 \pm 3. 4 \quad \mathrm {n . d .} \quad 3. 5 0 \pm 1. 0 4 \quad 4. 2 8 ^ {\mathrm {a}} \pm 1. 1 2 \quad 2. 3 3 \quad 2 1. 4 4 ^ {\mathrm {a}} \pm 3. 1 0 $$ $$ \mathrm {K 3} \quad 4 3. 6 ^ {\mathrm {b}} \pm 3. 1 \quad 8. 3 ^ {\mathrm {b}} \pm 1. 8 \quad 1 4. 6 ^ {\mathrm {b}} \pm 2. 0 \quad 1 6. 9 ^ {\mathrm {b}} \pm 2. 2 \quad 6 0. 5 \pm 5. 7 \quad < 0. 2 4 0 \quad 2. 6 6 \pm 1. 5 4 \quad 3. 4 9 ^ {\mathrm {a b}} \pm 0. 9 2 \quad 3. 4 9 \quad 1 5. 0 5 ^ {\mathrm {b c}} \pm 5. 1 8 $$ $$ \begin{array}{l l l l l l l l l l} \mathrm {K 4} & 4 4. 3 ^ {\mathrm {b}} \pm 3. 3 & 8. 2 ^ {\mathrm {b}} \pm 1. 8 & 1 4. 0 ^ {\mathrm {b}} \pm 1. 2 & 1 6. 2 ^ {\mathrm {b}} \pm 1. 8 & 6 0. 1 \pm 4. 3 & \mathrm {n . d .} & 2. 5 9 \pm 1. 0 5 & 3. 0 3 ^ {\mathrm {a b}} \pm 0. 7 5 & 1. 6 7 & 1 8. 4 8 ^ {\mathrm {a b}} \pm 3. 6 7 \end{array} $$ a-d Values with different letters within comparisons are significantly different (P<0.05); n.d., not detected TBARS TBARS values were analysed together with n-3 PUFA, n-6 PUFA, LC and TC in the PLS-DA model to investigate possible interactions between oxidation and these parameters. Separation was found between groups R1, M1 and K1 and between groups R4, M2 and K4 (Figure 3a). Statistical analysis showed that groups M2 and K4 had a higher TBARS value than group R4 (Table 5). Group R2 was separated from the other groups close to TBARS (Figure 3b).
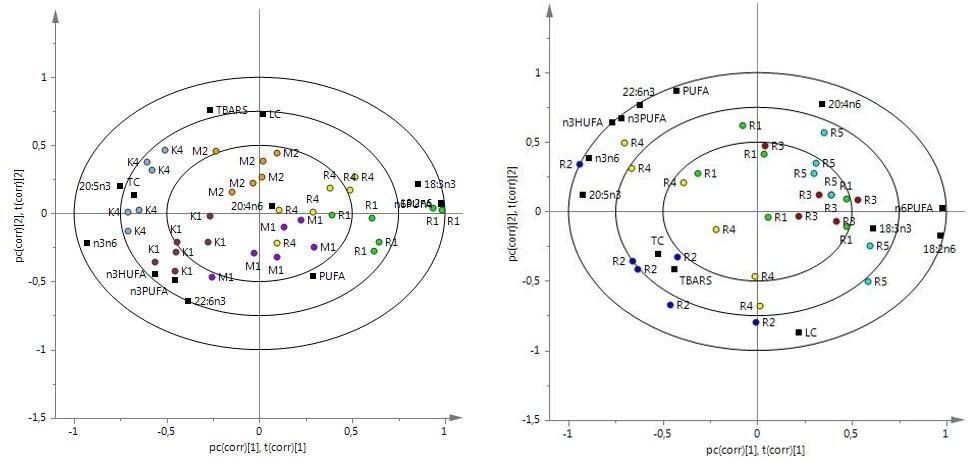
The TBARS value of group R2 was higher than that of groups R3, R5 and R4. Group K2 differed from other FKO groups close to TBARS (Figure 3c). The TBARS value of group K2 was higher than that of groups K1 and K3. In plots a and b, n-3 PUFA distributed on the same side as TBARS (not close) while n-6 PUFA was on the other side. In plots b and c, TBARS was close to TC, but far from n-3 PUFA (Figure 3).
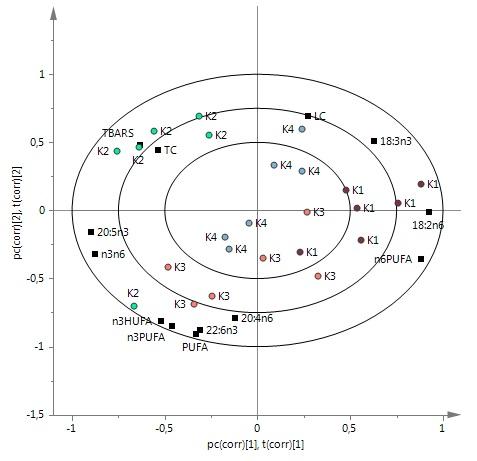
Figure (3a, 3b, 3c): PLS-DA analysis of thiobarbituric reactive substances (TBARS) value with fatty acids and carotenoid in white muscle (n=6): a, b, c are biplot of data from groups R1, R4, M1, M2, K1, K4, groups R1, R2, R3, R4, R5 and groups K1, K2, K3, K4 explaining 66.5%, 76.3% and 80.5% of variation in samples, respectively. For abbreviations, see Figures 1 and 2.
Discussion
This study examined the effects of RO, KO, KM and MM on fish performance. KO is rich in n-3 LCPUFA and KM contains high-quality protein. Most studies have concluded that including<50% KM in the diet has no effect on fish growth [10, 21] but that including >80% KM reduces growth rate and weight of fish [22]. The negative effect on growth is most likely due to fluoride accumulation in the exoskeleton of krill. De-shelling has been successfully tested as a method to reduce the fluoride levels [23]. The KM used in the present study was produced by an enzymatic hydrolysis method which removes most fluorides [13], avoiding their negative effects. MM contains a high proportion of protein with a similar AA pattern to FM and approximately10% of lipid with a beneficial FA profile. Thus, it is considered to be of similar quality to FM and suitable for fish feed. Berge & Austreng [11] reported a tendency for poorer growth with increasing level of MM in the diet of rainbow trout (Oncorhynchus mykiss), due to the low energy density of the diet caused by high ash content in mussel shells. In the present study, only de-shelled mussels were used in meal and no negative effect on growth was observed compared with FM groups. RO has been tested in Atlantic salmon (Salmo salar) [24], rainbow trout [25] and Arctic charr. Pettersson, et al. [26] concluded that a significant proportion (<75%) of dietary FO replacement by vegetable oil did not affect growth performance. Similar results were obtained in the present study, where there were no differences in fish growth between RO groups and FKO groups. Comparison 1 (Figure 1) examined the effects of oil source on FA profile. The results for groups R1 and R4 suggested that RO mainly affects MUFA (18:1n-9), ALA and n-6 PUFA in white muscle, which is in agreement with previous studies showing an increase in these FA [4, 24, 25, 26].The lower proportion of EPA and decreased n-3/n-6 ratio in group R1 compared with group K1 indicates that RO reduces the nutritional value of the fish for humans. Results for groups K1 and K4 showed that KO with FO gave much SFA (14:0, 16:0) and n-3 LCPUFA (EPA, DPA). A similar effect of KM on FA profile has been found in Atlantic salmon [21]. The KO used in this study was rich in SFA (40%) and n-3 PUFA (11%). Based on the FA profile of diets R1 and R4 compared with diets K1 and K4, we concluded that most dietary FA were represented in white muscle. However, some FA caused unexpected results. The levels of 18:3n-6 and AA were higher in group R1 fish than in groups M1 and M2, despite their levels being lower in diet R1 than in diets M1 and K1. Since group R1 had a higher level of LA than groups M1 and K1, we speculated that the higher AA proportion was formed by the elongation and desaturation pathway of LA. This contradicts findings by Pettersson, et al. [26] of no concomitant increase in AA with increasing LA proportion in the diet of Arctic charr. It is also interesting to note the higher ALA level in group R1 than in groups M1 and K1 but similar level of DHA in these three groups. Similar levels of EPA and DHA were also found for groups R4 and K4. The ALA level was actually similar in all groups, while the level of DHA and EPA in diet R1 (and diet R4) was lower than in diets M1 and K1 (and diet K4). The comparable level of EPA and DHA in groups R1 and R4 suggests that the Arctic charr tried to preserve these important FA. AA is also considered an important FA for Arctic charr and a 6-fold higher content of AA in the muscle of wild Arctic charr than its farmed counterpart has been reported [26]. Therefore, Arctic charr may try to synthesise these important FA, EPA, DHA and AA from the substrates ALA and LA. The results for groups R1 and R4 could be explained by a mechanism in FA desaturation and elongation, where the basic physiological need for EPA and DHA in fish tissues is met. At the same time, AA was most likely synthesised from LA to compensate for the lack of AA in the diet. There was a higher level of LA than ALA in diets R1 and R4, so most of the elongation and desaturation of LA led to an increase in AA in muscle and concomitant accumulation of ALA. On the other hand, LA level was low in diets M1, K1 and K4, while the EPA and DHA levels were high, which could inhibit the conversion of LA to AA [27]. ALA in groups M1, K1 and K4 may mainly be catabolised by β- oxidation, since diets M1, K1 and K4 were rich in EPA and DHA. These three groups possibly demonstrate the effect of relatively high dietary n-3 PUFA by the low level of AA and ALA in the muscle. Our experimental set- up revealed an ability of Arctic charr to desaturate and elongate LA and ALA to longer chain AA, EPA and DHA, contradicting Tocher, et al. [28]. To explain this difference, some gene expression studies have to be added. The high conversion rate of C18 FA to longer chain AA and DHA in group R1 could be explained by the deficiency of AST in the diet. This suggestion is based on results reported by Pickova, et al. [29] showing higher DHA in Atlantic salmon eggs exposed to higher peroxidation, and by Bell, et al. [30], who found that dietary deficiency of vitamin E and AST increased desaturated and elongated products of ALA and EPA in an in vivo study of salmon and that the absence of AST had a greater stimulatory effect on the conversion than the absence of vitamin E. Increases in AA and DHA were also observed in the liver total lipid of African catfish (Clarias gariepinus) fed diets containing oxidised FO without vitamin E compared with fish fed oxidised FO with vitamin E [31]. Deficiency in dietary antioxidants may increase the efficiency of desaturation and elongation of C18 FA, although the mechanism is not clear. In the present study, diets M1, K1 and K4 included KO or KM, and these two compounds supplied certain amounts of AST to these diets. However, diets R1 and R4 had a lower Carotenoid content. Therefore, it is possible that AST deficiency stimulated the conversion of C-18 PUFA to LCPUFA. Comparison 2 (Figure 2) explored the effects of different feed meals on the FA profile in fish tissue. The differences in FA profile between group R1 and group R2 suggest that KM played an important role in determining the FA profile. It provided SFA such as 14:0 and 16:0, but also 18:1n-7 and n-3 LCPUFA, mainly EPA and DPA. Similar results have been reported in studies on Atlantic salmon, Atlantic halibut (Hippoglossus hippoglossus) [21] and rainbow trout [32]. The comparison between group R1 and groups R3 and R5 showed that the influence of MM was mainly on 18:0, AA, EPA and DPA. We also compared the effect of KM and MM on FA profile. Group R2 exhibited higher levels of 14:0, 16:0, 18:1n-7 and EPA and lower levels of LA, 20:3n-6 and AA than group R5. This indicates that KM had a more pronounced effect on preserving n-3 LCPUFA, especially EPA, than MM. In addition, a slightly lower ALA level in groups R3 and R5 than in group R1 was observed. Since ALA proportion in diets R3 and R5 was higher than in diet R1, we suggest that this effect was caused by β- oxidation of ALA for energy and no conversion into DHA. This was confirmed by the similar level of DHA in the three groups. Comparison 3 also examined the effects of meal type on FA profile. The higher proportion of most n-3 PUFA and a higher n-3/n-6 ratio in group K2 than in group K1 confirm the conclusion reached in comparison of group R1 and group R2, suggesting the positive effect of KM on n-3 LCPUFA proportion in muscle. Differences between groups K3 and M2 and groups R1 and R3 also confirm that MM made a positive contribution to n-3 PUFA proportion. The average proportion of ALA, EPA, DHA, n-3 PUFA and n-3/n-6 in muscle of farmed salmonidsis reported to be 1.0, 5.0, 7.0, 17.0 g/100g FA and 6:1, respectively [33]. The corresponding ranges in the present study were 2.5-5.8, 3.7-5.9, 11.9-14.7, 21.3-25.1g/100g FA and 2:1-7.8:1, respectively. The n-3/n-6 ratio in the RO and MO groups represented the extremes in this study. Group K2 showed the highest n-3 FA and n-3/n-6 values. All these data lead to the conclusion that KM, MM and KO, together with FO, LO and RO, could be used to maintain a satisfactory FA profile in white muscle of Arctic charr. The differences in a*, b* value and TC between RO groups and FKO and MO groups revealed that RO replacement compromised colour properties, while KO improved colour properties of white muscle. Arai, et al. [34] reported good pigmentation in coho salmon (Oncorhynchuss kisutch) muscle with inclusion of KO in the feed. The higher values of a*, C* and TC in group R2 than in group R1also suggest a positive effect of KM on colour properties. This effect is confirmed by the higher level of a*, C* and TC value in group K2 than in group K1. The pigmentation effect of KM has also been reported in Atlantic salmon. The pronounced effect of KO and KM on pigmentation is not surprising, since they contain large amounts of AST (KO 884 mg/kg; KM482 mg/kg). The MM used in this study contained 480 mg/kg TC. The differences in a*, C* and TC between groups R3 and R5 and group R1 confirm that the effect of MM on pigmentation was significant. Grave, et al. [35] also observed a good pigmentation effect when MM was included in the diet of rainbow trout. In addition, the higher value of a* and TC in group R2 than in group R5 reveals that the pigmentation effect of KM was more pronounced than that of MM. The depth of pink colour in white muscle depends on its concentration of AST. Most studies report a linear relationship between a*, b*, C*, H value and AC. In this study, close logarithmic relationships were found between these parameters and AC (or TC), in agreement with Christiansen, et al. [36]. These results suggest that the positive effects of KM, KO and MM on AST in fish muscle were reflected by the colour properties. Pigment supplementation accounts for a substantial part of total diet costs in salmonid farming. Thus efficient utilisation of pigment, usually evaluated as retention rate of Carotenoid, is important. In diets R2, R4, M2, K2, K3 and K4, AC was sufficiently high (>60 mg/kg) for the fish to reach the desired level of AST in white muscle (6 mg/kg). However, RTC and TC for these groups were lower than reported in previous studies on salmonids [37]. Carotenoid utilisation depends on fish species, physiological status, dietary composition, pigment source, environmental conditions and other factors. Species differences in pigmentation retention efficiency may exist between Atlantic salmon, rainbow trout and Arctic charr [38]. Fish size could be one reason for the poor deposition of AST in this study. Storebakken, et al. [39] found that Atlantic salmon with an end weight of 400 g fed 60 or 90 mg/kg AST reached the same levels of final AST content in muscle (3-5 mg/kg),while in large salmon (end weight >1.5 kg) higher levels of AST(>5 mg/kg) accumulated [40]. Those authors concluded that small-sized salmon may reach a plateau level in the pigmentation capacity. Olsen and Mortensen [41] also reported that a pigmentation plateau in Arctic charr with start weight <300 g fed 70 mg/kg dietary AST, which coincides with the weight of the fish used in this study (<300 g). Pigment source could have been an important factor affecting AST retention and utilisation in this study. It is well established that AST ester can be utilised by salmonids and deposited as free AST in white muscle [42]. Nevertheless, free AST is usually absorbed and deposited better than AST ester [43]. The latter needs to be hydrolysed into free form, incorporated into mixed micelles or lipoproteins, absorbed in the intestine and finally transported to the liver and deposited in muscle [44]. Intestinal hydrolysis or cleavage could be a limiting step for the absorption of AST from its ester matrix [39]. White, et al. [45] found that the AST content in serum was higher in salmon fed free or mono-esterified AST than in salmon fed di-esterified AST. The AST in KO and KM is mainly di-esterified and thus could have a low hydrolysis rate in Arctic charr. In another study, White, et al. [46] found similar AST absorption rates in rainbow trout fed free and esterified AST. Therefore, the intestinal cleavage of AST ester may not be the only factor leading to its inefficient retention but further steps for the transport of AST in blood may also play important roles. There was no control group with free AST as the Carotenoid source in the present study and no measurement of AST content in blood was performed, so no conclusions can be drawn from the results. Further studies focusing on the bioavailability of AST are needed. Due to the positive effects of n-3 LCPUFA for human health, alterations are made to fish diets to increase the proportion in salmonids. However, n- 3 LCPUFA is susceptible to oxidation, forming secondary oxidation products which reduce storability, impart a poor sensory taste and cause nutritional losses [47]. Therefore, it is necessary to balance n-3 LCPUFA content against product stability. This was studied here by TBARS measurements as an indicator of effects of lipid content, FA profile and Carotenoid content and composition on oxidation of white muscle. The differences in TBARS value between group R4 and groups M2 and K4, and between group R2 and groups R1, R3 and R5, could be explained by more susceptible n-3 PUFA than n-6 PUFA. However, the n-3 PUFA level of these two groups was not significantly different. TBARS was closely related to TC in comparisons 2 and 3. The high TBARS value of groups R2, K2 and K4 suggests that AST did not exhibit antioxidant effects but prooxidant-like effects (not all the groups had high AST content). A study on white muscle of king salmon (Oncorhynchuss tshawytscha) showed a significant antioxidant effect of AST during storage [48]. However, AST exhibited no effect on inhibition of lipid oxidation in other studies [20]. AST mainly acts as singlet oxygen quencher and the protective mechanism may be of minor importance in meat products in comparison to free radical attacks [49]. In addition, at high concentrations some antioxidants may exhibit prooxidant effects, as demonstrated for β-carotene [50]. This would explain the prooxidant-like, but not antioxidant, activity of AST in some groups.
Conclusions
Diets containing KM, MM and KO can be used to improve FA profile and colour properties in white muscle of Arctic charr. Low AST content in fish diets can induce desaturation and elongation of LA and ALA into LCPUFA. AST di-ester in KO or KM can affect AST utilisation and bioavailability. Further studies on the bioavailability of AST and its effect on fish muscle stability are of interest.
Acknowledgements
NJ Faculty at the Swedish University of Agricultural Sciences and China Scholarship Council. Hanna Carlberg and Lisa Brännas are highly acknowledged for their help with sampling.
References
-
Von Schacky C, Harris WS (2007) Cardiovascular benefits of omega-3 fatty acids. Cardiovasc Res 73(2): 310-315.
-
Nettleton JA, Katz R (2005) n-3 long-chain polyunsaturated fatty acids in type 2 diabetes: a review. J Am Diet Assoc 105(3): 428-440.
-
Larsson SC, Kumlin M, Ingelman-Sundberg M, Wolk A (2004) Dietary long-chain n−3 fatty acids for the prevention of cancer: a review of potential mechanisms. Am J Clin Nutr 79(6): 935-945.
-
Bell JG, McGhee F, Campbell PJ, Sargent JR (2003) Rapeseed oil as an alternative to marine fish oil in diets of post-smolt Atlantic salmon (_Salmo salar_): changes in flesh fatty acid composition and effectiveness of subsequent fish oil "wash out". Aquaculture 218(1-4): 515-528.
-
Shahidi F, Metusalach, Brown JA (1998) Carotenoid Pigments in Seafoods and aquaculture. Crit Rev Food Sci Nutr 38(1): 1-67.
-
Hussein G, Sankawa U, Goto H, Matsumoto K, Watanabe H (2006) Astaxanthin, a Carotenoid with potential in human health and nutrition. J Nat Prod 69(3): 443-449.
-
Vine AL, Leung YM, Bertram JS (2005) Transcriptional regulation of connexin 43 expression by retinoids and carotenoids: similarities and differences. Mol Carcinog 43(2): 75-85.
-
Nicol S, Foster J, Kawaguchi S (2012) The fishery for Antarctic krill - recent developments. Fish Fish 13(1): 30-40.
-
Jönsson L, Elwinger K (2009) Mussel meal as a replacement for fish meal in feeds for organic poultry - a pilot short-term study. Acta Agr Scand A An 59(1): 22-27.
-
Tibbetts SM, Olsen RE, Lall SP (2011) Effects of partial or total replacement of fish meal with freeze-dried krill (_Euphausia superba_) on growth and nutrient utilization of juvenile Atlantic cod (_Gadus_ _morhua_) and Atlantic halibut (_Hippoglossus hippoglossus_) fed the same practical diets. Aquac Nutr 17(3): 287-303.
-
Berge GM, Austreng E (1989) Blue mussel in feed for rainbow trout. Aquaculture 81(1): 79-90.
-
Musumarra G, Scire S (2001) MODDE, Version 5.0, available from UMETRICS AB, European Office: Box 7960 SE-90719 UMEÅ, Sweden (telephone: +46-90-184800, fax: +46-90-184899, Web: http://www.umetrics.com); North American Office: 17 Kiel Avenue, Kinnelon, NJ 07405 USA (telephone: +1-973-492-8355, fax: +1-973- 492-8359). J Chemom 15: 199-200.
-
Jansson Kragh ST, Ervik JR, Grimsmo L (2010).
-
Trattner S, Kamal-Eldin A, Brännäs E, Moazzami A, Zlabek V, et al. (2008) Sesamin supplementation increases white muscle docosahexaenoic acid (DHA) levels in rainbow trout (_Oncorhynchus_ _mykiss_) fed high alpha-linolenic acid (ALA) containing vegetable oil: metabolic actions. Lipids 43(11): 989-997.
-
Appelqvist LÅ (1968) Rapid methods of lipid extractions and fatty acid methyl ester preparation for seed and leaf tissue with special remarks on preventing the accumulation of lipids contaminants. Royal Swedish Academy of Sciences (Kungliga Svenska Vetenskapsakademien) 28(36): 551-570.
-
Tolasa S, Cakli S, Ostermeyer U (2005) Determination of astaxanthin and canthaxanthin in salmonid. Eur Food Res Technol 221(6): 787- 791.
-
Choubert G, Luquet P, Cescosse R, Hontang Y, Lannebere R (1982) Fixation et rétention musculaire de la canthaxanthine par la truite arc- en-ciel. Ann Zootech 31(1): 1-10.
-
CIE: Commission Internationale de l'Éclairage. Colorimetry (1976) Publication no 15. Bureau central de la CIE, Austria, pp. 14.
-
Wyszecki G, Stiles WS (1967) Color Science. JohnWiley and Sons, New York, USA, pp. 628.
-
Sigurgisladottir S, Parrish CC, Lall SP, Ackman RG (1994) Effects of feeding natural tocopherols and astaxanthin on Atlantic salmon (_Salmo_ _salar_) fillet quality. Food Res Int 27(1): 23-32.
-
Suontama J, Karlsen Ø, Moren M, Hemre GI, Melle W, et al. (2007) Growth, feed conversion and chemical composition of Atlantic salmon (_Salmo salar_ L.) and Atlantic halibut (_Hippoglossus hippoglossus_ L.) fed diets supplemented with krill or amphipods. Aquac Nutr 13(4): 241- 255.
-
Hansen JØ, Penn M, Øverland M, Shearer KD, Krogdahl Å, et al. (2010) High inclusion of partially deshelled and whole krill meals in diets for Atlantic salmon (_Salmo salar_). Aquaculture 310(1-2): 164-172.
-
Yoshitomi B, Nagano I (2012) Effect of dietary fluoride derived from Antarctic krill (_Euphausia superba_) meal on growth of yellowtail (_Seriola quinqueradiata_). Chemosphere 86(9): 891-897.
-
Bell JG, McEvoy J, Tocher DR, McGhee F, Campbell PJ, et al. (2001) Replacement of fish oil with rapeseed oil in diets of atlantic salmon (_Salmo salar_) affects tissue lipid compositions and hepatocyte fatty acid metabolism. J Nutr 131(5): 1535-1543.
-
Pettersson A, Johnsson L, Brännäs E, Pickova J (2009) Effects of rapeseed oil replacement in fish feed on lipid composition and self- selection by rainbow trout (_Oncorhynchus mykiss_). Aquac Nutr 15(6): 577-586.
-
Pettersson A, Pickova J, Brännäs E (2009) Effects of crude rapeseed oil on lipid composition in Arctic charr _Savelinus alpinus._ J Fish Biol 75(6): 1446-1458.
-
Tocher DR, Bell JG, Dick JR, Henderson RJ, McGhee F, et al. (2000) The effect of dietary lipid on polyunsaturated fatty acid metabolism in Atlantic salmon (_Salmo salar_) undergoing parr-smolt transformation and the effects of dietary linseed and rapeseed oils. Fish Physiol Biochem 23: 59-73.
-
Tocher DR, Bell JG, MacGlaughlin P, McGhee F, Dick JR (2001) Hepatocyte fatty acid desaturation and polyunsaturated fatty acid composition of liver in salmonids: effects of dietary vegetable oil. Comp Biochem Physiol B Biochem Mol Biol 130(2): 257-270.
-
Pickova J, Dutta PC, Pettersson A, Frøyland L, Kiessling A (2003) Eggs of Baltic salmon displaying M74, yolk sac mortality syndrome have elevated levels of cholesterol oxides and the fatty acid 22:6 n-3. Aquaculture 227(1-4): 63-75.
-
Bell JG, McEvoy J, Tocher DR, Sargent JR (2000) Depletion of α- tocopherol and astaxanthin in atlantic salmon (_Salmo salar_) affects autoxidative defense and fatty acid metabolism. J Nutr 130(7): 1800- 1808.
-
Baker RTM, Davies SJ (1996) Increased production of docosahexaenoic acid (22: 6 n-3, DHA) in catfish nutritionally stressed by the feeding of oxidized oils and the modulatory effect of dietary α-tocopheryl acetate. J Fish Biol 49(4): 748-752.
-
Roncarati A, Sirri F, Felici AA, Stocchi L, Melotti P (2011) Effects of dietary supplementation with krill meal on pigmentation and quality of flesh of rainbow trout (_Oncorhynchus mykiss_). Ital J Anim Sci 10(2).
-
Simopoulos AP (2002) The importance of the ratio of omega-6/omega- 3 essential fatty acids. Biomed Pharmacother 56(8): 365-379.
-
Arai S, Mori T, Miki W, Yamaguchi K, Konosu S, et al. (1987) Pigmentation of juvenile coho salmon with carotenoid oil extracted from Antarctic krill. Aquaculture 66(3-4): 255-264.
-
Grave H, Schultz A, Van Thielen R (1979) The influence of blue mussel, Mytilus edulis and krill Euphausia superba on growth and proximate composition of rainbow trout, Salmo gairdneri. In: World Symp on Finfish Nutrition and Fishfeed Technology, Hamburg, 20-23 June 1978 (Ed.) JE H, Tiews K, Verlagsgesellschaft H, Berlin, pp. 575-586.
-
Christiansen R, Struksnæs G, Estermann R, Torrissen OJ (1995) Assessment of flesh colour in Atlantic salmon, _Salmo salar_ L. Aquac Res 26(5): 311-321.
-
Synowiecki J, Shahidi F, Penney RW (1994) Nutrient Composition of Meat and Uptake of Carotenoids by Artic Char (_Savelinus alpinus_). J Aquat Food Prod T 2(3): 37-58.
-
Bjerkeng B, Hatle B, Jobling M (2000) Astaxanthin and its metabolites idoxanthin and crustaxanthin in flesh, skin, and gonads of sexually immature and maturing Arctic charr (_Salvelinus alpinus_ L.). Comp Biochem Physiol B Biochem Mol Biol 125(3): 395-404.
-
Storebakken T, Foss P, Schiedt K, Austreng E, Liaaen-Jensen S, et al. (1987) Carotenoids in diets for salmonids: IV. Pigmentation of Atlantic salmon with astaxanthin, astaxanthin dipalmitate and canthaxanthin. Aquaculture 65(3-4): 279-292.
-
Storebakken T, Foss P, Huse I, Wandsvik A, Berg Lea T (1986) Carotenoids in diets for salmonids: III. Utilization of canthaxanthin from dry and wet diets by Atlantic salmon, rainbow trout and sea trout Aquaculture 51(3-4): 245-255.
-
Olsen RE, Mortensen A (1997) The influence of dietary astaxanthin and temperature on flesh colour in Arctic charr _Salvelinus alpinus_ L. Aquac Res 28(1): 51-58.
-
Mori T, Makabe K, Yamaguchi K, Konosu S, Arai S (1989) Comparison between krill astaxanthin diester and synthesized free astaxanthin supplemented to diets in their absorption and deposition by juvenile coho salmon (_Oncorhynchus kisutch_). Comp Biochem Physiol B Comp Biochem 93(2): 255-258.
-
Foss P, Storebakken T, Austreng E, Liaaenjensen S (1987) Carotenoids in diets for salmonids: V. Pigmentation of rainbow trout and sea trout with astaxanthin and astaxanthin dipalmitate in comparison with canthaxanthin. Aquaculture 65(3-4): 293-305.
-
Rørvik KA, Ytrestøyl T, Lundberg E, Jakobsen FA, Jakobsen AA, et al. (2010) How Apparent Digestibility of Carotenoids, Macronutrients, and Minerals are Differently Affected by Ration Level in Atlantic Salmon, _Salmo Salar_. J Appl Aquacult 22(2): 123-139.
-
White DA, Moody AJ, Serwata RD, Bowen J, Soutar C (2003) The degree of carotenoid esterification influences the absorption of astaxanthin in rainbow trout, _Oncorhynchus mykiss_ (Walbaum). Aquac Nutr 9(4): 247- 251.
-
White DA, Page GI, Swaile J, Moody AJ, Davies SJ (2002) Effect of esterification on the absorption of astaxanthin in rainbow trout, _Oncorhynchus mykiss_ (Walbaum). Aquac Res 33(5): 343-350.
-
Sampels S (2013) Oxidation and Antioxidants in Fish and Meat from Farm to Fork. In: Food Industry (Ed.) Muzzalupo I, InTech.
-
Larsen D, Quek SY, Eyres L (2010) Effect of cooking method on the fatty acid profile of New Zealand King Salmon (_Oncorhynchus_ _tshawytscha_). Food Chem 119(2): 785-790.
-
Bou R, Decker EA, Guardiola F, Codony R (2009) Improvement of poultry meat nutritional value and quality through different natural sources and mineral dietary supplements, in: Food Science And Security (Eds.) Amesl L, Hirsch L, Nova Science Publishers, Inc., New York, pp. 187-230.
-
Palozza P (1998) Prooxidant Actions of Carotenoids in Biologic Systems. Nutr Rev 56(9): 257-265.
- Genetic Improvement of Nile Tilapia (Oreochromis niloticus): Advances in Selective Breeding and Genomic Approaches for Sustainable Aquaculture
- Microplastics, Contaminants, and Waste Hotspots: Divergences and Faults in Prioritizing Control Efforts
- Creating a Healthier, More Vibrant Open and Closed Aquatic Environment. A Submersible, Centrifugal Magnetically Affixed Current Changing Aquarium Pump
- An Attempt to Assess Alpha Diversity and Sample Size: Using the Ostracod Assemblages off Kumamoto Port, Japan
- Assessment of the Efficiency of Common Fishing Gears and Crafts Used at Mohananda River of Chapai Nawabganj, Bangladesh
- Fish Productivity and Biodiversity Status of Sundarban Mangrove in Bangladesh