Macrozoobenthic Population under Heavy Anthropogenic Impact: Coastal Area of Vladivostok (Peter the Great Bay, Sea of Japan)
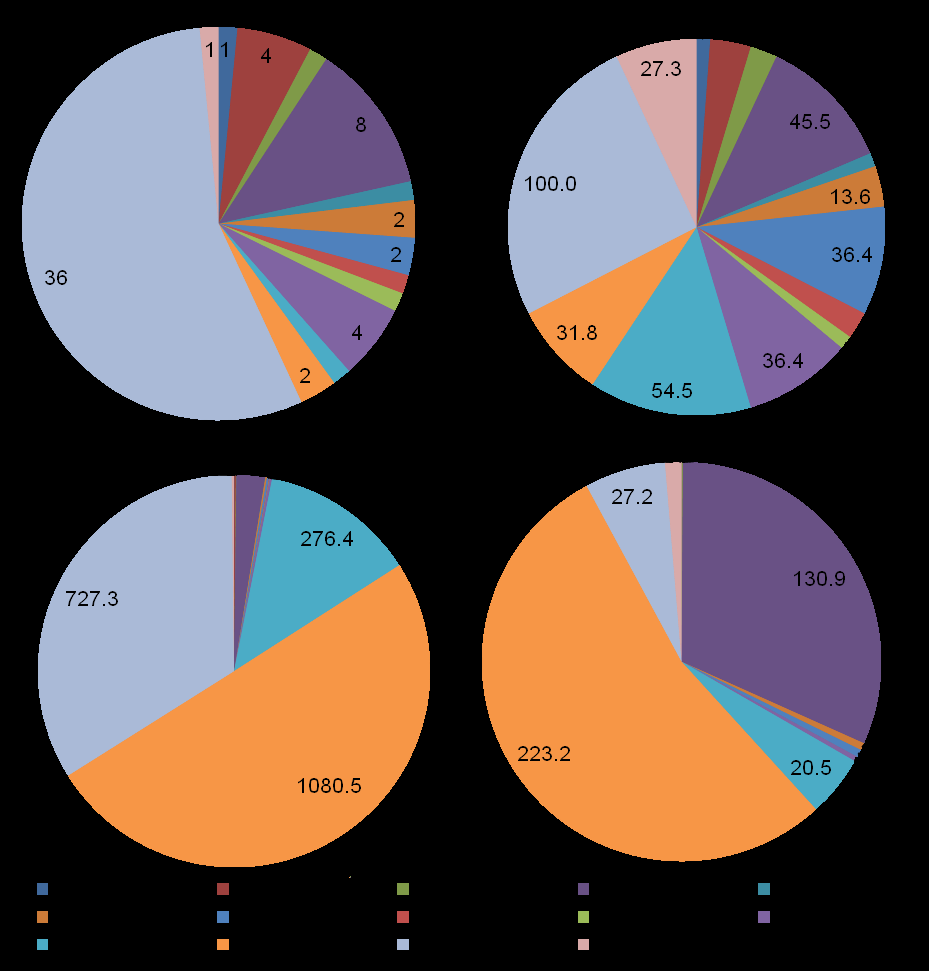
In total, 65 macrozoobenthic species belonging to 14 taxa were found at the area studied. Polychaetes were dominant in number of species (36), and then bivalves followed (8). Polychaete worms were the most frequent (100 %), ophiuroids occupied the second place (54.5 %), and then Bivalvia, Nemertea, Gastropoda, Phoronida, Priapulida went after (27.3- 45.5 %). Minimal values of ecological parameters were shown to locate to the most contaminated regions Golden Horn and Diomid Inlets that reflected a high level of anthropogenic impact. Worsening of ecological state of benthos at these areas and in the east part of Amursky Bay occurred due to not only high level of chemical contamination, but oxygen deficiency (and complex of factors connected) that is permanent in the north part of Golden Horn Inlet and seasonal off the western coast of Muraveva-Amurskogo Peninsula. Five macrozoobenthic communities were revealed. They were A. pacifica + Sch. japonica + C. capitata, O. sarsi vadicola + M. scarlatoi, O. sarsi vadicola + E. tenuis and a monodominant association of Phoronopsis sp. Differentiation of these communities at the area studied occurred due to effects of anthropogenic factors mainly. Communities of poor species composition were developed under extreme and heavy chemical contamination and almost all species found in these groups were positive indicators of pollution and eutrophication. Macrozoobenthic communities became more diverse, and various representatives of bottom fauna appeared side by side with positive indicators under decrease of anthropogenic impact. Benthic associations formed in sites with bad and poor ecological status were shown to be less changeable than those developed under moderate and even good ones.
Introduction
Monitoring of marine environment has to include observations on factors of influence (pollution) and status of biosphere elements (responses of living things on these impacts – changes in its structural and functional parameters) [1, 2]. One of the most effective methods of such estimations is oversights on the level of sediment contamination and state of bottom animals. Control of hydrobiological parameters should be a top priority for these objectives due to it provides a possibility for direct evaluation of condition of aquatic ecosystems affected by harmful influence of anthropogenic factors. Analysis of composition and structure of macrozoobenthic communities, by which we mean a population of bottom animals of the second and third trophic levels that inhabits specific biotope and possesses certain quantitative ratios between species [3]. Animals settling at the same bottom patch, in the same biotope, interact inevitably, and its associations acquire some emergent properties due to this cooperation (for example, they become more tolerant to external actions) that naturally leads to inadequate results of ‘survival’ experiments in situ and in vitro. Bottom sediments are one of the finite stages of migration of matter in marine ecosystems [4]. Many contaminants accumulate in sediments, and its content may serve as integral indicator of pollution for coastal waters [5, 6, 7, 8]. So, namely sediments are the most demonstrative element in system of impact evaluations due to they are more infallible indicator of contamination for aquatic objects, than water. At the same time, pollution effects on benthic organisms in natural conditions occur at the background of influence of many other ecological factors and, in other words, environment exert a complex impact on populations of species including in a community. Therefore, estimation of contamination effects should be accompanied by that of other environmental factors, although the main ones. First data on composition and abundance of benthos over the area of Vladivostok port have been obtained in the beginning of the last century [9, 10]. These investigations were continued by soviet scientists in the second half of 20th century [11, 12, 13, 14, 15, 16, 17]. The last complex ecological observations on bottom sediments and macrozoobenthos in Golden Horn Inlet were conducted in 2001, at the northern part of Amursky Bay in 2005, and in East Bosphorus Strait (Patrokl Inlet and area near Russky Island) in 2006-2007 [18, 19, 20, 21, 22].
And only not so long ago Belan TA, et al. [23, 24] published the results of joint expedition of IMB FEB RUS and FERHRI of 2001, and described benthic population of Golden Horn Inlet and East Bosphorus Strait. Since that time, emergency escapes of oil products occurred repeatedly there and, thus, reliable data on current status of bottom population are absent for this area now. The objective of the present work is to fill in the gap, estimate ecological status of benthic fauna and evaluate the role of chemical contamination in development and transformation bottom communities of this region.
Materials and Methods
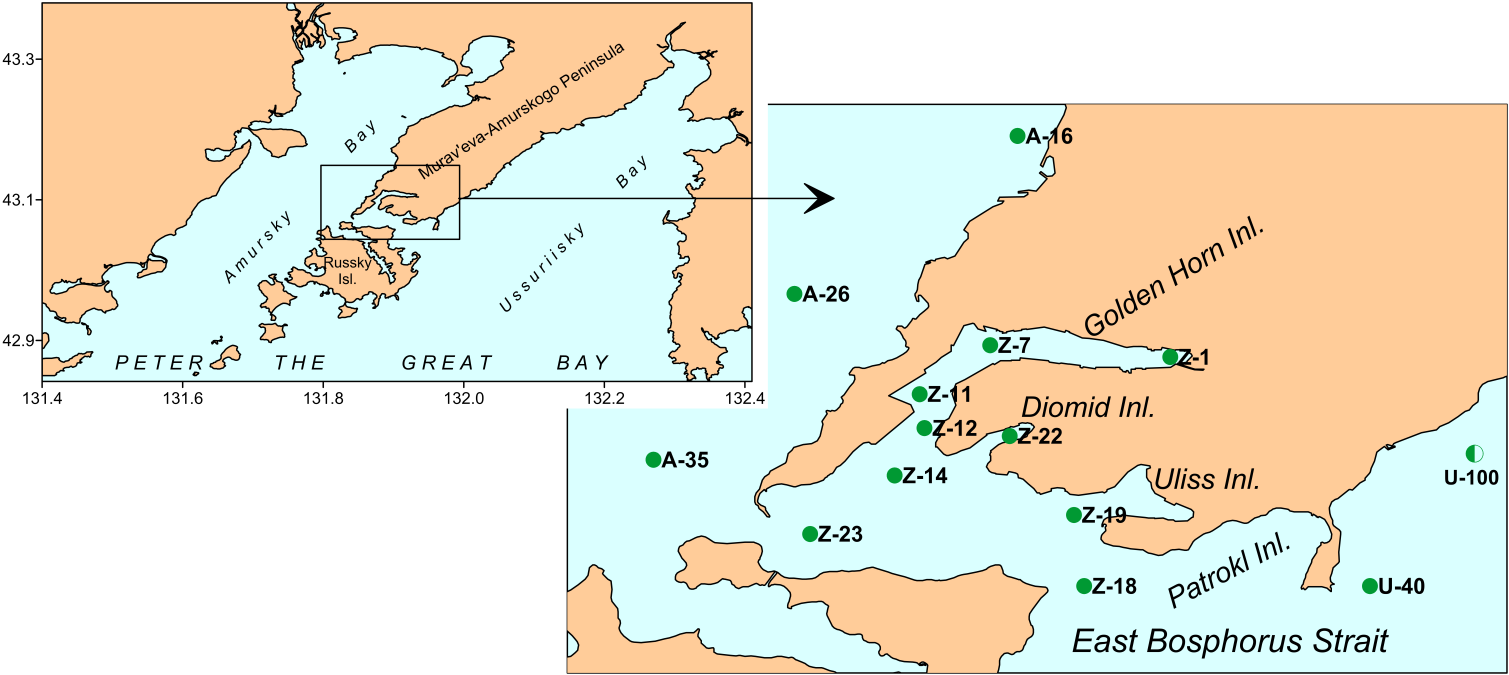
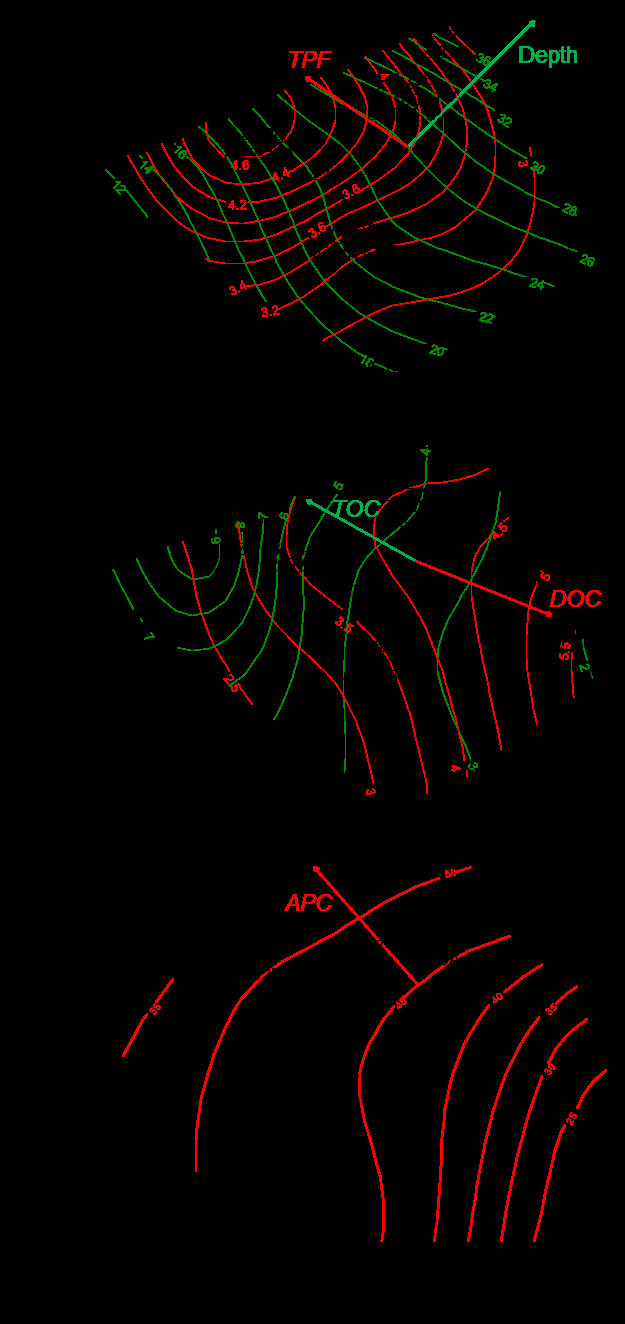
Sediments were sampled in Amursky and Ussurisky Bays, Golden Horn Inlet and East Bosphorus Strait in August 2016 using van Veen grab (13 stations; 1-2 replicas) (Figure 1). For chemical analysis only surface sediments (1-2 cm) were collected. For biological analysis, sediments were washed by sea water through 1-mm sieve and residues including macro benthos were preserved by 4 % buffered formaldehyde. Total content of organic carbon (TOC), metals, hydrocarbons, phenols, chlorinate pesticides were determined using standard methods of Russian Federal Service for Hydrometeorology and Environmental Monitoring [25]. Besides, the results obtained at stations of long-term monitoring including data on fractional composition of sediments (mean grain size − MGS, entropy of granulometric spectra − H_gr) and content of dissolved oxygen in near-bottom layer (_DOC; 2014, the year with pronounced oxygen drop in summer, and 2016) were used. Sediments in Golden Horn and Diomid Inlets are presented by a mix of coal and slag particles with different anthropogenic impurities, liquid and semi-liquid muds impregnated by oil products that make impossible a standard procedure of fractional analysis. So, concentration of Fe was used to characterize the content of fine particles (>0.1 mm, APC). Content of Fe is little changeable under impact of anthropogenic factors and determined mainly by mechanical differentiation that effect displays in enrichment of fine fractions by this element [26, 27]. Dependence of APC on Fe content in relatively clear areas of Peter the Great Bay is almost linear (APC=0.0023*Fe–8.1176, r=0.917, p=0.000, n=107).
S $$ Y = \sum_ {i = 1} ^ {S} \left(B _ {i} - A _ {i}\right) / [ 5 0 \cdot (S - 1 $$ )] 1 ( 50 [ ) ( S / A B W i i ; it changes between –1 and =
1 i +1, its value approaches to –1 in almost completely destroyed communities, and tends to +1 in undisturbed ones (r- and K-strategists dominate correspondingly). Ecological status of benthos was characterized by AMBI (AZTI Marine Biotic Index) and M-AMBI indices [31, 32].
$$ A M B I = [ (0 \times \% G I) + (1, 5 \times \% G I I) + (3 \times \% G I I I) + (4, 5 \times \% G I V) + (6 \times $$
%GV)]/100, where GI−GV − groups of species which
present similar abundance profiles along the enrichment
gradient by organic matter of the environment. The
second index, M-AMBI or Multivariate AMBI, is calculated
on the base of factor analysis using AMBI, H’ and R. There
is a program freely distributed on the Internet to compute
AMBI and M-AMBI [33, 34]. Besides these indices, a method
for quantitative appraisal of disturbances of
macrozoobenthic communities was used [18, 19]. It is based
on changes in Shannon-Wiener index for bivalve mollusks
(Hb’) along TPF gradient. Measures of these disturbances are
ERLq and ERMq (2.78 and 3.23 in TPF units,
correspondingly), which limit the area of progressive
degradation of bottom communities (an almost linear drop
of Hb’).
In statistical treatment we used standard procedures
and tests offered by STATISTICA 6.0, PRIMER v5 and R
3.4.0 program packages [35, 36, 37]. These are nonparametric
analogue of the corresponding variant of ANOVA, the
Kruskal-Wallis test (null hypothesis H0: factor effect does
not lead to relative shift of distributions); linear
regression and nonlinear estimation with computation of
correlation and regression coefficients (r and bi) and its
statistical estimation (verification of H0: r=0 and bi=0).
Communities (synonyms – groups, associations) were
distinguished by different hierarchical agglomerative
methods (metrics – Bray-Curtis similarity coefficient)
with following bootstrapping for estimation of probability
of appearance of nodes at dendrograms (R, modules
hclust, pvclust and function pvclust_bcdist.R) [36, 38].
ANOSIM was used to check the significance of that appearance; this procedure allows us to get a statistical estimation of belonging of stations or samples to a particular group. Then SIMPER was applied to evaluate contributions from each species to the average similarity within the associations found. Mantel’s test was used to estimate significance of correspondence between species abundance, environmental factors and geographical locations (R, vegan module). Main environmental variables that determine development of a particular community were revealed by constrained correspondence analysis (CCA) under sequential removal of insignificant parameters on the base of permutation test and ANOVA. Visualization of spatial distributions of different parameters was made in Surfer v. 9.9 [39, 40].
Results
Total Level of Chemical Contamination of Marine Environment
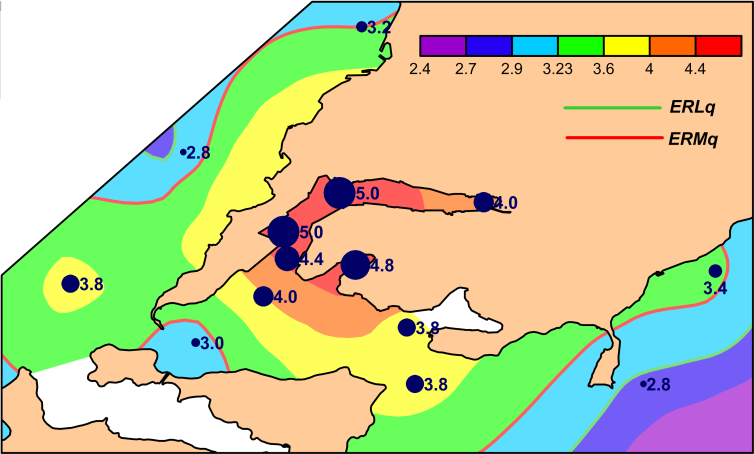
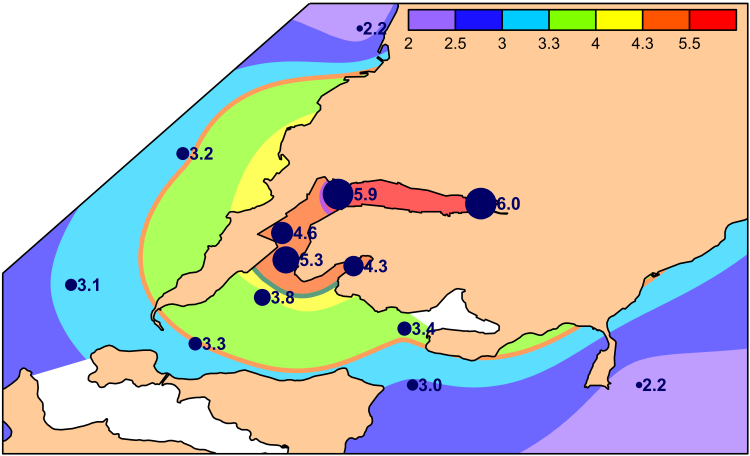
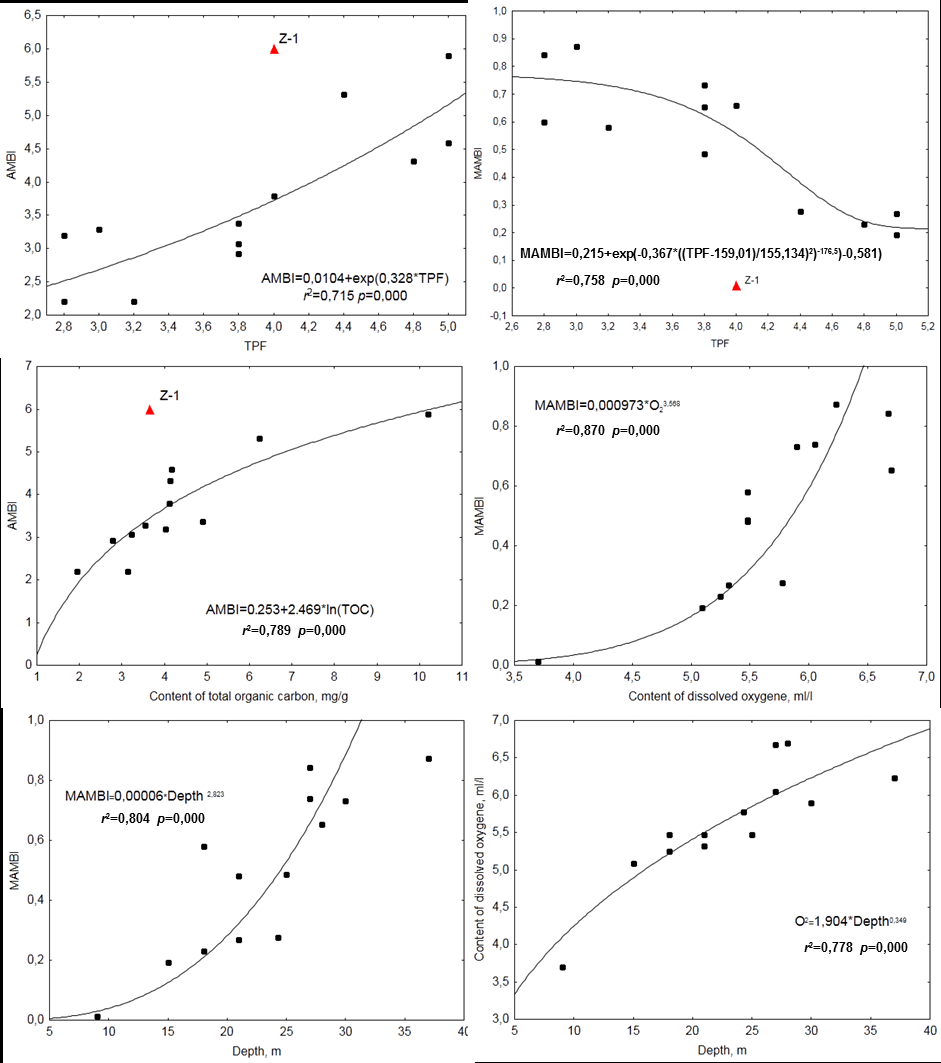
Spatial variations of total chemical pollution of sediments over the area studied are displayed clearly in distribution of TPF values (Figure 2). The most favorable for benthic organisms environmental conditions, relatively to chemical contamination, are observed in the seaward part of Ussurisky Bay, to the north-west from the coast of Murav’eva-Amurskogo Peninsula in Amursky Bay and in the south-west part of East Bosphorus Strait, at stations U-40, A-26 and Z-23 (TPF<3.2). However, even at these sites the level of chemical contamination matches approximately to the boundary of beginning of progressive degradation for benthic communities. The majority of other stations are located to areas, where this process was finished, under TPF>3.23, exclusion is station A-16 (TPF=3.2). Bivalve mollusks disappear completely from benthic population under further growth of TPF. In our case, they were absent at station Z-12 under TPF=4.4, whereas one species of these animals – Macoma scarlatoi – was found at station Z-14 (TPF=4.0, H_b’=0). Sediments are extremely contaminated in the outer and middle parts of Golden Horn Inlet, but not in its inner part (_TPF=4.4– 5.0 and 4.0 correspondingly).
Composition, Abundance, Structure of Macrozoobenthos and Ecological Status of Environment
In total, 65 macrozoobenthic species belonging to 61 genera, 14 families and 14 taxonomical groups of higher order were found at the area studied. Polychaetes were dominant in species number (36 species, 55 %), and then bivalves followed (8 and 12.3); number of species in other groups did not exceed 4 (Figure 3). Polychaete worms were the most frequent (100 %), ophiuroids occupied the second place (54.5 %), and then Bivalvia, Nemertea, Gastropoda, Phoronida, Priapulida went after (27.3-45.5 %). Average values of total biomass and density made up 414.4±126.3 g/m2 and 2156±540 inds./m2. Phoronids, presumably related to Phoronopsis, possessed the maximal share in total biomass (59.3 %), bivalve mollusks contributed significantly also (31.6 %), and the group that was richest in species number, the polychaete worms, made up 6.6 % only (Figure 3). Phoronids and polychaetes led in contributions to total density (50.1 and 33.7 %).
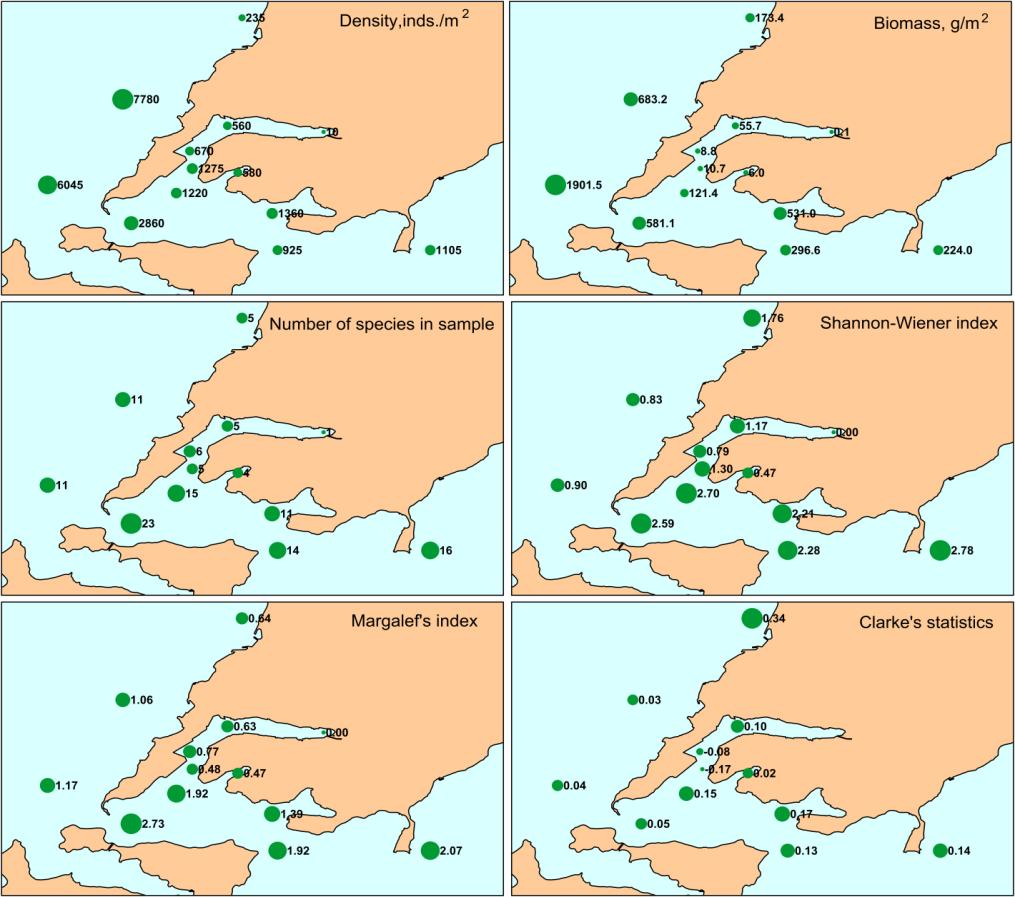
The highest biomass (>600 g/m2) was found in Amursky Bay at stations А-35 and А-26, where phoronids produced it base, up to до 96 % (Figure 4). High biomasses (>200 g/m2) were observed in East Bosphorus Strait (stations Z-23, Z-18), Uliss Inlet (Z-19) and Ussurisky Bay (U-40). Bivalve mollusks contributed mainly in total biomass there, M. scarlatoi in East Bosphorus Strait and Mizuhopecten yessoensis, Ennucula tenuis, Yoldia johani in Ussurisky Bay. The lowest biomasses of macrozoobenthos were marked at stations Z-1 (<0.1 g/m2) in Golden Horn Inlet and Z-22 (6.0 g/m2) in Diomid Inlet. Maximal densities (>7000 inds./m2) were found at stations А-35 and А-26 also, again due to phoronids aggregations. Rather high numerical abundances (925– 2860 inds./m2) were observed in East Bosphorus Strait, Uliss Inlet, Ussurisky Bay and at the mouth of Golden Horn Inlet. Such densities occurred due to a joint contribution of ophiuroid Ophiura sarsi vadicola, polychaete worms Aphelochaeta (Tharyx) pacifica, Scoloplos armiger, Schistomeringos japonica (in various combinations at different stations). As for biomass, minimal densities were located to the inner part of Golden Horn Inlet. Only ten macrozoobenthic species belonging to 3 faunal groups were observed in Golden Horn Inlet. One single polychaete species Capitella capitata occurred at station Z-1. Five species were found in the middle part of this inlet (Z-7), and 6 species were observed at its mouth (Z-11 and Z-12). Polychaetes C. capitata, A. pacifica, Sch. japonica showed the highest frequency there. Only four polychaete species occurred in Diomid Inlet, and A. pacifica dominated among them (540 inds./m2). Benthos was more diverse in the mouth of Uliss Inlet; 16 species belonging to 8 faunal groups were found there. M. scarlatoi, O. sarsi vadicola and A. pacifica showed the maximal values of numerical parameters: the first of them dominated in biomass (475.9 g/m2 in average), the second species prevailed in density (480 inds./m2), and the third one made up similar numerical abundance (420 inds./m2). In total, 44 species of benthic animals belonging to 12 taxonomic groups occurred at 3 stations of East Bosphorus Strait. The highest densities were found for O. sarsi vadicola (665 inds./m2), polychaetes Dipolydora cardalia (271 inds./m2), A. pacifica (183 inds./m2), S. armiger (117 inds./m2). Spatial variations of ecological status of marine environment are displayed in distribution patterns of AMBI and M-AMBI (Figure 5). It should be characterized as bad in inner and middle parts of Golden Horn Inlet (stations Z-1 and 7; AMBI>5.5 and M-AMBI=0.2 and less), and as poor in its outer part and Diomid Inlet (station Z-11, 12 and 22; AMBI>4.3 and M-AMBI<0.39). Environmental conditions were moderate and good according AMBI, good and even high according M-AMBI in East Bosphorus Strait (3.3−3.8 and 0.7−0.9). State of marine milieu improved even more at the outlet of the strait, in Ussurisky Bay. Its status was good according AMBI, and moderate or similar to it mainly according M-AMBI in Amursky Bay.
above, bottom population was in very bad condition in spite of ‘non-extreme’ level of chemical pollution of sediments. M-AMBI correlated to content of dissolved oxygen (power function; r=0.933, p=0.000). DOC grew under depth increase at the area studied (power function; r=0.910, p=0.000) and the dependence of M-AMBI on depth appeared due to this connection evidently (power function; r=0.897, p=0.000). Correlation coefficients of AMBI and DOC and depth were much less than those for M-AMBI, although they were significant too (r=−0.658 and −0.578, p=0.015 and 0.039), and that for M-AMBI and TOC was low and insignificant (r=0.491, p=0.088; in all cases linear approximation showed the best results; dependencies were not show).
Macrozoobenthic Communities: Status and Effects of Chemical Contamination
Grouping of samples and stations allowed us to reveal three main clusters (Figure 7). The first of them (A) included 5 stations located to Golden Horn and Diomid Inlets, the second cluster (B) was formed by stations of the open part of East Bosphorus Strait and station in the mouth of Uliss Inlet, and the third one (C) was made up by stations A-26 and A-35 in Amursky Bay. Stations U-40 and A-16 remained unclassified and created independent groups D and E. Usage of species densities and biomasses in clusterization led to almost identical results (were not shown for biomass). Extraction of groups A, B and C was statistically significant both for density and biomass that is testified by results of ANOSIM (Table 1). Formation of these specie groups was caused by significant effects of both a sum of environmental variables and ‘geographical’ location of stations (results of Mantel test; Table 2). In other words, each group was located to a certain area and occupied a certain biotope. Marginal significance of connection found between matrices of factors and locations showed the presence of rather clear spatial gradient for environmental variables.
Groups compared R Level of significance Number of possible permutations A−B 0.810/0.842 0.000 3003 3003 A−C 0.504/0.583 0.005 210 210 A−D 0.833 0.036 28 28 A−E 0.875 0.036 28 28 B−C 0.989/0.983 0.002 495 495 B−D 0.961/0.914 0.022 45 45 B−E 1.000 0.022 45 45 C−D 1.000 0.067 15 15 C−E 1.000 0.067 15 15 D−E 1.000 0.333 3 3 Table 1: Results of ANOSIM (global statistics R=0.831. p=0.000. number of permutations-10000). Note: numerator − for density, denominator − for biomass (if differences occurred).
Real number of
permutations
| 95-% confidence | p (under | ||
|---|---|---|---|
| Distance matrices compared | Mantel’s statistics r | ||
| interval for r | randomization) | ||
| {Species abundance S} ~ {Environmental factors E} | 0.430/0.389 | 0.276 ÷ 0.584 0.238 ÷ 0.538 | 0.001/0.001 |
| {Species abundance S} ~ {Spatial location G} | 0.485/0.407 | 0.348 ÷ 0.622 0.261 ÷ 0.553 | 0.001/0.001 |
| {Environmental factors E} ~ {Spatial location G} | 0.192/0.192 | -0.031 ÷ 0.415 -0.014 ÷ 0.398 | 0.072/0.061 |
| Correlation between three matrices S, E and G simultaneously | 0.392/0.346 | 0.230 ÷ 0.554 0.213 ÷ 0.479 | 0.001/0.001 |
Table 1: Results of Mantel’s test for evaluation of statistical significance in connections of macrozoobenthic species abundance,
A. pacifica, C. capitata, Sch. japonica made the main contribution into within group similarity for stations of cluster A, both in density and biomass (Table 3). In this relation O. sarsi vadicola led in group B according to ‘density’ input, and M. scarlatoi did so according to biomass; Phoronopsis sp. was the main species in group C (both density and biomass). The same inputs were observed for O. sarsi vadicola and E. tenuis (density) in group D, and the first species outstripped the second one in ‘biomass’ contribution. Finally, only three macrozoobenthic species – polychaetes Scalibregma inflatum, Maldane sarsi and Lumbrineris sp. 2 – provided 100-% input in group E. Its shares were almost equal in intragroup similarity according to numerical abundance (31.6−35.0 %), and the last species was behind the first two ones according to biomass. Evidently, taking in account the results of ANOSIM and Mantel test, the groups revealed should be considered as communities of A. pacifica + Sch. japonica + C. capitata, O. sarsi vadicola + M. scarlatoi, Phoronopsis sp., O. sarsi vadicola + E. tenuis и S. inflatum + M. sarsi + Lumbrineris sp. 2. Ordination of species with the maximal contributions to within group similarity relatively to stations and main environmental factors is showed at Figure 8, and some biotic parameters of the communities revealed are presented in Table 4. The community of A. pacifica + Sch. japonica + C. capitata was characterized by the least average values of number of species, biomass, Clarke’s statistics, Shannon- Wiener’s and Margalef’s indices and, at the same time, by rather high density among other groups (Table 4). In total, 13 species of benthic animals were found in this community, A. pacifica was the most frequent among them (83.3 %) and dominated in numerical abundance (373 inds./m2). Relatively rare Nereis sp. led in biomass (50 % and 8.2 g/m2). Negative values of W-statistics testified to dominance of relatively small animals. The association of O. sarsi vadicola + M. scarlatoi showed higher values for all parameters than those in previous group (Table 4). In total, 46 species of invertebrates were revealed in this community that greater than that in the rest of associations in times. Three species – Lumbrineris sp. 1, S. armiger and A. pacifica – possessed 100-% frequency; O. sarsi vadicola led in density (619 inds./m2), and M. scarlatoi did so in biomass (274.9 g/m2) under frequency of 86,8 % in both species. Phoronida community had the maximal values of abundance parameters, but ceded substantially to the association O. sarsi vadicola + M. scarlatoi in diversity of bottom animals (Table 4). In total, 17 species was observed in the group, and 4 of them − Phoronopsis sp. (absolute dominant in density and biomass, 5920 inds./m2 and 1228 g/m2), polychaetes Notomastus latericeus, A. pacifica, Sch. japonica − were found in all samples. Strong domination of small phoronids provoked not only low values of Clarke’s statistics, but also those of H‘and e indices_._
| Taxon | A or B | i | SD () i i | CN, % | CCN, % |
|---|---|---|---|---|---|
| Group A. Density. Average similarity: 35,95 | |||||
| Aphelochaeta pacifica | 373.33 | 17.46 | 1.08 | 48.56 | 48.56 |
| Schistomeringos japonica | 246.67 | 8.64 | 0.72 | 24.02 | 72.58 |
| Capitella capitata | 83.33 | 7.40 | 0.77 | 20.57 | 93.15 |
| Nereis sp. | 5.00 | 2.46 | 0.48 | 6.85 | 100.00 |
| Group A. Biomass. Average similarity: 32.26 | |||||
| Aphelochaeta pacifica | 3.58 | 16.19 | 1.09 | 50.19 | 50.19 |
| Schistomeringos japonica | 2.17 | 6.66 | 0.76 | 20.66 | 70.84 |
| Capitella capitata | 0.83 | 5.67 | 0.78 | 17.58 | 88.42 |
| Nereis sp. | 8.18 | 3.74 | 0.48 | 11.58 | 100.00 |
| Group B. Density. Average similarity: 50.60 | |||||
| Ophiura sarsi vadicola | 618.75 | 8.98 | 1.60 | 17.75 | 17.75 |
| Aphelochaeta pacifica | 242.50 | 7.37 | 2.65 | 14.56 | 32.31 |
| Scoloplos armiger | 148.75 | 7.24 | 2.56 | 14.30 | 46.62 |
| Lumbrineris sp. 1 | 73.75 | 6.29 | 5.88 | 12.44 | 59.05 |
| Macoma scarlatoi | 35.00 | 4.38 | 1.60 | 8.65 | 67.70 |
Group B. Biomass. Average similarity: 49.77
| Macoma scarlatoi | 274.88 | 13.59 | 1.58 | 27.31 | 27.31 |
| :--- | :--- | :--- | :--- | :--- | :--- |
| Ophiura sarsi vadicola | 35.70 | 8.18 | 1.60 | 16.43 | 43.74 |
| Aphelochaeta pacifica | 6.22 | 5.45 | 2.07 | 10.95 | 54.69 |
| Scoloplos armiger | 5.13 | 5.40 | 2.23 | 10.86 | 65.54 |
| Lumbrineris sp. 1 | 0.78 | 3.93 | 4.15 | 7.90 | 73.45 |
Group C. Density. Average similarity: 70.29
| Phoronopsis sp. | 5920.00 | 24.55 | 8.38 | 34.92 | 34.92 |
| :--- | :--- | :--- | :--- | :--- | :--- |
| Aphelochaeta pacifica | 620.00 | 11.63 | 3.00 | 16.54 | 51.46 |
| Notomastus latericeus | 90.00 | 8.33 | 15.22 | 11.86 | 63.31 |
| Schistomeringos japonica | 22.50 | 6.24 | 21.27 | 8.88 | 72.19 |
| Lumbrineris sp. 2 | 47.50 | 3.67 | 0.91 | 5.22 | 77.42 |
Group C. Biomass. Average similarity: 66.26
| Phoronopsis sp. | 1227.50 | 30.27 | 12.44 | 45.69 | 45.69 |
| :--- | :--- | :--- | :--- | :--- | :--- |
| Aphelochaeta pacifica | 13.30 | 9.03 | 2.43 | 13.62 | 59.31 |
| Notomastus latericeus | 2.63 | 7.05 | 5.41 | 10.64 | 69.95 |
| Schistomeringos japonica | 0.24 | 3.85 | 11.26 | 5.81 | 75.76 |
| Ophiura sarsi vadicola | 15.31 | 2.68 | 0.62 | 4.04 | 79.80 |
Group D. Density. Average similarity: 63.03
| Ennucula tenuis | 305.00 | 10.88 | – | 17.27 | 17.27 |
| :--- | :--- | :--- | :--- | :--- | :--- |
| Ophiura sarsi vadicola | 390.00 | 10.88 | – | 17.27 | 34.54 |
| Scoloplos armiger | 90.00 | 7.28 | – | 11.55 | 46.09 |
| Lumbrineris sp. 3 | 65.00 | 6.95 | – | 11.03 | 57.12 |
| Maldane sarsi | 65.00 | 6.95 | – | 11.03 | 68.15 |
Group D. Biomass. Average similarity: 58.86
| Ophiura sarsi vadicola | 52.15 | 13.71 | – | 23.29 | 23.29 |
| :--- | :--- | :--- | :--- | :--- | :--- |
| Ennucula tenuis | 16.10 | 10.31 | – | 17.52 | 40.81 |
| Scoloplos armiger | 13.60 | 8.56 | – | 14.54 | 55.36 |
| Maldane sarsi | 4.25 | 7.10 | – | 12.06 | 67.42 |
| Lumbrineris sp. 3 | 0.70 | 4.57 | – | 7.76 | 75.18 |
Taxon | $A$ or $B$ | $\delta_i$ | $\delta_i / SD(\delta_i)$ | $CN, \%$ | $CCN, \%$ |
Group E. Density. Average similarity: 69.91
| Scalibregma inflatum | 90.00 | 24.45 | – | 34.98 | 34.98 |
| :--- | :--- | :--- | :--- | :--- | :--- |
| Maldane sarsi | 85.00 | 23.36 | – | 33.42 | 68.39 |
| Lumbrineris sp. 2 | 40.00 | 22.10 | – | 31.61 | 100.00 |
Group E. Biomass. Average similarity: 50.67
| Maldane sarsi | 11.00 | 24.07 | – | 47.50 | 47.50 |
| :--- | :--- | :--- | :--- | :--- | :--- |
| Scalibregma inflatum | 8.25 | 16.05 | – | 31.67 | 79.16 |
| Lumbrineris sp. 2 | 0.35 | 10.56 | – | 20.84 | 100.00 |
Note: Species are arranged according to decrease of percent contributions; $A$ -density (inds./m²), $B$ -biomass (g/m²), -similarity, SD -standard deviation, CN -percent input, CCN-cumulative percents.
| Community | |||||
|---|---|---|---|---|---|
| A. A. pacifica + Sch. | C. | D. O. sarsi | E. S. inflatum + M. | ||
| Parameter | B. O. sarsi vadicola + | ||||
| japonica + C. | Phoronopsis | vadicola + E. | sarsi + Lumbrineris | ||
| M. scarlatoi | |||||
| capitata | sp. | tenuis | sp. 2 | ||
| A, inds./m2 | 619±204 | 1591±434 | 6913±876 | 1105±147± | 235±5 |
| B, g/m2 | 16.3±10.2 | 382.5±106.9 | 1292.3±615.3 | 224.0±110.7 | 173.5±150.8 |
| S | 4.1±0.9 | 15.5±2.5 | 10.8±0.3 | 15.5±0.5 | 4.5±0.5 |
| H‘ | 0.74±0.24 | 2.44±0.12 | 0.86±0.04 | 2.78±1.40 | 1.76±0.13 |
| R | 0.47±0.13 | 1.99±0.28 | 1.11±0.05 | 2.07±0.03 | 0.64±0.09 |
| e | 0.41±0.08 | 0.63±0.03 | 0.25±0.01 | 0.70±0.003 | 0.82±0.01 |
| W | -0.035±0.059 | 0.127±0.027 | 0.037±0.006 | 0.187±0.057 | 0.347±0.110 |
| AMBI | 5.21±0.29 | 3.31±0.14 | 3.13±0.04 | 2.19±0.19 | 2.23±0.38 |
| MAMBI | 0.22±0.04 | 0.72±0.03 | 0.49±0.02 | 0.83±0.00 | 0.55±0.00 |
Table 3: Parameters of macrozoobenthic communities Note: Mean values ± standard errors are shown. The community of _O. sarsi vadi
Table 4: Parameters of macrozoobenthic communities Note: Mean values ± standard errors are shown. The community of O. sarsi vadicola + E. tenuis located to station U-40 was the third in abundance of macrofauna and the most diverse in composition, according to theory of information (maximal values of H‘). Total number of species made up 22, and 9 of them were found in both samples. O. sarsi vadicola and E. tenuis were the most abundant (390 and 305 inds./m2, 100 %), M. yessoensis prevailed in biomass (125.2 g/m2, 50 %). Rather high values of W-statistics were provided by the dominance of relatively large ophiuroids and bivalve mollusks, not to mention Primorian scallop. Only 6 macrozoobenthic species were found at station A-16 (the association of S. inflatum + M. sarsi + Lumbrineris sp. 2) at the background of the least density, but rather high informational diversity and maximal values of Clarke’s statistics (Table 4). Such a diversity provided by high evenness of rank distribution of species and its low number. The last determined mainly the maximum of W-statistics also. Dominants were M. sarsi, S. inflatum (density, 85 and 90 inds./m2, 100 %) and bivalve mollusk Protocallithaca adamsii (biomass, 153,5 g/m2, 50 %) that are rather big animals. Depth, total level of chemical pollution TPF, concentration of dissolved oxygen DOC (data for ‘extreme’ 2014), content of fine particles APC (obtained from equation showed above) ‘participated’ significantly in differentiation of еру communities (Table 6, Figure 8, 9). Total content of organic carbon TOC did so at a marginal level (p<0.1). Granulometric parameters MGS and H_gr’ did not enter in the model at significant level, and if we used _DOC for 2016 instead of 2014, it became insignificant too.
Discussion
Species composition, abundance and structure of benthic population displaed different level of anthropogenic impact at the areas studied. All numerical parameters of macrozoobenthos were diminished in heavy contaminated sediments of Golden Horn and Diomid Inlets. The most frequent and abundant species there were C. capitata, A. pacifica, Sch. japonica (the community of A. pacifica + Sch. japonica + C. capitata), which are well-known indicators of pollution and eutrophication (the first one is a hypoxia indicator also) [15, 41]. ‘Benthic community health’, according to AMBI, corresponded to ‘heavy polluted’ in the middle parts of Golden Horn Inlet bordering on ‘azoic’ zone, and to ‘polluted’ and ‘transitional to heavy pollution’ in its outer part and in Diomid Inlet (terms were used after: [42]). Benthos health should be characterized as ‘unbalanced’ in all other sites.
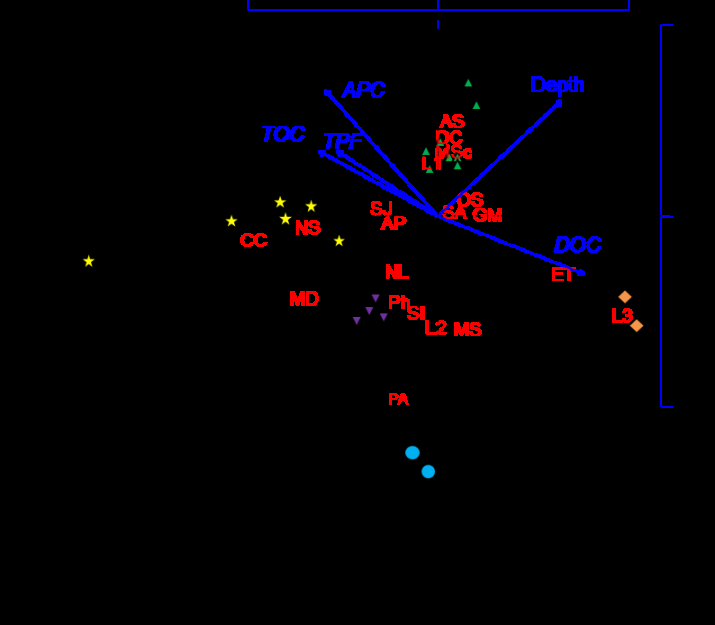
‘Titular’ or the most important macrozoobenthic species: AP − A. pacifica, AS − Axinopsida subquadrata, CC − C. capitata, DC − D. cardalia, ET − E. tenuis, GM − G. maculata, L1-3 − Lumbrineris sp. 1−3, MD − Maldanidae, MS − M. sarsi, MSc − M. scarlatoi, NL − N. latericeus. NS − Nereis sp., OS − O. sarsi, PA − P. adamsi, Ph − Phoronopsis sp., SA − S. armiger, SI − S. inflatum, SJ − Sch. japonica, Evidently, the ‘drop-out’ of Z-1 station occurs due to effects of other factors. The main «pretender» to leading role in this fallout is content of dissolved oxygen. Ob’yasneniya River
| Variable | CCA 1 | CCA 2 | r2 | Pr(>r) |
|---|---|---|---|---|
| Depth | 0.72043 | 0.69353 | 0.7227 | 0.001 |
| TPF | -0.83082 | 0.55654 | 0.3554 | 0.041 |
| TOC | -0.87189 | 0.48970 | 0.4541 | 0.015 |
| DOC | 0.92747 | -0.37391 | 0.6113 | 0.001 |
| APC | -0.65363 | 0.75682 | 0.7307 | 0.002 |
| MGS | -0.32855 | 0.94449 | 0.2824 | 0.079 |
| H ’ gr | -0.98819 | 0.15324 | 0.0146 | 0.888 |
Table 4: Results of CCA: ANOVA for models with full and reduced number of variables (number of permutations: 999; biotic data wer
Variable Degrees of freedom χ2 F Pr(>F) Total model: A ~ Depth + TPF + TOC + DOC + APC + MGS + Hgr’ Model 7 2.0521 1.9285 0.001 Residual 14 2.1282 Terms added sequentially: A ~ Depth + TPF + TOC + DOC + APC Depth 1 0.44262 2.7447 0.001 TPF 1 0.33498 2.0772 0.002 TOC 1 0.23305 1.4451 0.081 DOC 1 0.34359 2.1306 0.005 APC 1 0.24588 1.5247 0.048 Residual 16 2.58020 Marginal effects of terms: A ~ Depth + TPF + TOC + DOC + APC Depth 1 0.35159 2.1803 0.001 TPF 1 0.19995 1.2399 0.175 TOC 1 0.23005 1.4266 0.076 DOC 1 0.22881 1.4189 0.046 APC 1 0.24588 1.5247 0.034 Residual 16 2.58020 Marginal tests for axes: A ~ Depth + TPF + TOC + DOC + APC CCA1 1 0.51177 3.1735 0.001 CCA2 1 0.45092 2.7962 0.001 CCA3 1 0.31480 1.9521 0.001 CCA4 1 0.18376 1.1395 0.263 CCA5 1 0.13886 0.8611 0.671 Residual 16 2.58020 Table 6: Results of CCA: ANOVA for models with full and reduced number of variables (number of permutations: 999; biotic data were fourth root transformed). Another situation appeared near the west coast of Murav’eva-Amurskogo Peninsula where the conditions of environment varied notably according to different parameters. Most likely, its depressed status that was reflected in low values of M-AMBI, low species diversity and sharp dominance of one species of phoronids is stipulated by seasonal changes in marine milieu. Near- bottom hypoxia appears there in summer due to decay of died off phytoplankton that is accompanied by growth in concentrations of biogenic elements (i.e. eutrophication) [44]. The communities of Phoronopsis sp. and S. inflatum + M. sarsi + Lumbrineris sp. 2 were located to this area.
Regular hydrobiological observations at the area of Vladivostok port began from the mid-70's of the last century, but these works continued until the late 80's; then more than a ten-year gap was somewhat filled up by investigations in the new millennium (2001). A detailed comparison of bottom fauna in the mid-70's − early 80's, in the mid-80’s and late 80's and 2001 was made by T.A. Belan and colleagues [23, 24]. Bottom fauna of Golden Horn Inlet was poor in this period (especially in it inner part) and showed low quantitative characteristics excluding population density. The vast majority of animals belonged to the category of species that are insensitive to contamination, i.e. to its positive indicators. These were still the same C. capitata, Sch. japonica, A. pacifica, Nereis sp. in Golden Horn (middle part) and Diomid Inlets. Parameters of benthic abundance and diversity grew in moving towards open parts of the inlet and areas of East Bosphorus Strait. As it was shown above, almost the same composition and distribution pattern are observed now. Total level of chemical contamination was high (>ERM_q) and did not change at this area for more than 30 years [45]. Thus, the same macrozoobenthic communities were formed there for several decades at the background of relatively stable and heavy chemical pollution. Benthic communities look more variable in open and, correspondingly, less contaminated parts of the area studied. For example, polychaete community with heavy dominance of _A. pacifica (maximal density made up 2154 inds./m2) and subdominants G. capitata, D. cardalia, C. capitata inhabited stations of the strait and Uliss Inlet in 2001 [23, 24]. As it was mentioned above, we found the association of O. sarsi vadicola + M. scarlatoi in 2016 there. The community of O. sarsi vadicola + S. armiger and monodominant association of D. cardalia were found in the eastern part of East Bosphorus Strait in 2006–2007 (at the same depth approximately and similar sediments, but in clearer conditions – TPF=2.6–3.2), and its differentiation was determined by natural factors, depth and fractional composition (in preparation). In our case, only depth might be considered as completely ‘natural’ factor (if we do not take into account dredging), whereas other ones – TOC, DOC, APC, TPF and even MGS and H_gr’ – possessed ‘anthropogenic’ origin to some extent or completely. Earlier, authors observed similar changes in benthic communities in northern part of Amursky Bay [46]. Two communities occurred there at soft sediments in 1989−2005. One of them existed at depths up to 8.5 m, and the second group occurred within 12−20 m. _M. sarsi dominated in the first association in 1989, L. longifolia prevailed in it in 2001; it and bivalve mollusk Potamocorbula amurensis did so in 2005. Naturally, changes were observed not only for dominant species. The second group was not less variable in these years: A. pacifica → S. inflatum + L. longifolia + Macoma tokyoensis → Phoronopsis harmeri + A. pacifica. Sharp drop of benthic abundance and diversity in Peter the Great Bay occurred within the transition from moderate to heavy chemical contamination (from 3 to 4 in TPF units) [47]. More precise appraisal made for macrozoobenthic communities showed the ‘permissible level’ TPF=2.8 [48]. Inversion of inputs of ‘natural’ and ‘anthropogenic’ factors in variability of integral parameters of communities occurred at this level, and contribution of the second factors began to exceed that of the first ones. A thorough restructuring of bottom associations began and progressed that is expressed in mass appearance and rapid growth of abundance of positive indicators of pollution, decrease in diversity of the most abundant groups of animals, changes in size-age composition (r-strategs, the opportunistic species, become dominants). The communities of O. sarsi vadicola + M. scarlatoi, Phoronopsis sp., O. sarsi vadicola + E. tenuis и S. inflatum + M. sarsi + Lumbrineris sp. 2 exits namely at such TPF levels (2.8–4.0). Possibly, benthic communities that exists in ‘stress conditions’ of contamination for a long time and occurs on the verge of restructuring of its diversity and abundance become less resistant and pass into state that is similar to completely 'destroyed' associations under any additional negative impact. This can be exemplified by development of the community of A. pacifica + G. capitata, complete absence of O. sarsi and almost complete one of bivalve mollusks at the stations of East Bosphorus Strait in 2001. Cause of such restructurings may be repetitive events of low and extremely low content of dissolved O2 in near- bottom water layer in previous years. Such incidents happen regularly there: they occurred during 3 years running at stations Z-18 and 23 in July and August 1999– 2001 (2 weeks before sampling in 2001). Summer oxygen deficiency before sampling in 2006–2007 was not so severe, as for 2015–2016 also, although during 2007 (after sampling)–2014 such phenomenon occurred repeatedly. As a whole, DOC dropped even less 2 ml/l in this period (August 2001 and 2007 – 1.96 and 1.88 ml/l). Threshold concentration for hypoxia makes up namely 2 ml/l [49]. It should be underlined that DOC decrease in this region was always accompanied by pH reduction (r=0.756 and 0.746, p=0.000 at stations Z-18 and 23) and by less synchronous, but notable, growth in concentrations of biogenic elements − phosphate, silicates, ammonium (unpublished data). Possibly, this testified to development of decay processes.
Evidently, free substrata are occupied by those animals, which larvae may ‘randomly’ occur in plankton and are ‘ready’ to settle. Opportunistic species, such as A. pacifica, D. cardalia, Sch. japonica, etc., give several generation of larvae during a year and, therefore, appearance of these polychaete worms, in large amounts at that, is rather objective result, especially if its population are dense and numerous at adjacent areas. In the sequel, community recovered under maintenance of relatively «favorable» conditions (appearance of O. sarsi, enrichment of polychaete fauna and decrease in r-strateg’s contribution, strengthening of mollusks role). Dominance of E. tenuis and M. scarlatoi among the last ones (in 2006 and 2016 correspondingly) may be the result of random processes again or outcome of some another mechanisms. For example, that may be so-called ‘population waves’, periodic or nonperiodic oscillations in abundance of organisms in natural populations. Causes of such oscillations are of ecological origin usually.
Conclusions
Minimal values of ecological parameters are shown to locate to the most contaminated regions – Golden Horn and Diomid Inlets – that reflect a high level of anthropogenic impact. Worsening of ecological state of benthos at these areas and in the eastern part of Amursky Bay occurs due to not only high level of chemical contamination, but oxygen deficiency (and complex of factors connected) that is permanent in the northern part of Golden Horn Inlet and seasonal off the western coast of Murav’eva-Amurskogo Peninsula. Differentiation of benthic association revealed in the area studied occurred due effects of anthropogenic factors mainly. Communities of poor species composition are developed under extreme and heavy chemical contamination and almost all species found in these groups are positive indicators of pollution and eutrophication. Macrozoobenthic communities become more diverse, and various representatives of bottom fauna appear side by side with positive indicators under decrease of anthropogenic impact. Benthic associations formed in sites with bad and poor ecological status are less changeable than those developed under moderate and even good ones.
References
-
Israel Yu A (1979) Ecology and monitoring of status of natural environment. Leningrad Hydrometeoizdat.
-
Mann RE (1973) Global environmental monitoring system (GEMS). Action Plan for Phase 1, SCOPE, rep 3 Toronto.
-
Propp MV (1971) Ecology of coastal bottom communities of Murmansk coasts of the Barents Sea. Moscow Nauka.
-
Martin JM, Whitefield M (1983) The significance of the river input of chemical elements to the sea, in: Trace Metals in Sea Water. Eds. CS Wong, F Boyle, KW Bruland, JD Burton (ED.), Goldberg, New York Plenum Press, pp: 265-294.
-
Bradford WL, Luoma SN (1980) Some perspectives on heavy metal concentrations in shellfish and sediment in San Francisco Bay, California, in: Contaminants and Sediments. R Baker (ED.), Ann Arbor Scientific Publishing MI, USA, pp: 501-532.
-
Daskalakis KD, O Connor TP (1995) Distribution of chemical concentrations in US coastal and estuarine sediment. Mar Environ Res 40(6): 381-398.
-
Goldberg ED, Griffin JJ, Hodge V, Koide M, Windom H (1979) Pollution history of the Savannah River estuary. Environ Sci Technol 13(5): 588-594.
-
Hirschberg DJ, Chin P, Feng H, Cochran JK (1996) Dynamics of sediment and contaminant transport in the Hudson River estuary: evidence from sediment distribution of naturally occurring radionuclides. Estuaries 19 (4): 931-949.
-
Shmidt PYu (1904) The fishes of the Eastern Seas of Russian Empire. The scientific results of Korean- Sakhalin expedition of the Imperial Russian Geographical Society. St. Petersburg Imperial Russian Geographical Society.
-
Pavlenko MN (1910) Fishes of Peter the Great Bay. Kazan.
-
Klimova VL (1988) Assessment of the consequences of soil dumping on biological indicators in dumping areas in the Sea of Japan. The results of research in connection with the dumping of waste in the sea. Moscow Hydrometeoizdat, pp: 137-141.
-
Tkalin AV, Klimova VL, Shapovalov EN, Sevastianov AV, Belan TA, et al. (1990) Some regional consequences of anthropogenic impact on the marine environment.
-
Bagaveeva EV (1992) About ecology of polychaete worms in the Golden Horn Bay (Sea of Japan). Investigation of the fauna of the seas 43(51): 115- 129.
-
Tkalin AV, Belan TA, Shapovalov EN (1993) The state of the marine environment near Vladivostok, Russia. Mar Pollut Bull 26(8): 418-422.
-
Belan TA (2001) Features of abundance and species composition of benthos in conditions of pollution (Peter the Great Bay, Sea of Japan). Mar Pollut Bull: 46(9): 1111-1119.
-
Davydkova IL, Fadeevf NP, Kovekovdova LT, Fadeev VI (2005) The content of heavy metals in the tissues of the dominant benthos species and in the bottom sediments of the Golden Horn of the Sea of Japan. Russian Journal of Marine Biology 31(3): 202-206.
-
Ogorodnikova AA (2001) Ecological and economic assessment of the impact of coastal pollution sources on the natural environment and bioresources of the Peter the Great Bay. Vladivostok.
-
Moshchenko AV, Belan TA (2007) Development of new methods for appraisal of ecological state of natural environment in Far East seas. Dynamics of marine ecosystems and conditions for formation of biological potential in Russians seas. Collective monograph. Vladivostok: Dalnauka, pp: 276-313.
-
Moshchenko AV, Belan TA (2008) Method for the appraisal of anthropogenic disturbance of macrozoobenthic communities of soft substrata. Russian Journal of Marine Biology 34(4): 279-292.
-
Belan TA, Moshchenko AV, Lishavskaya TS (2007) Long- term changes in the level of pollution of the marine environment and the composition of benthos in the Peter the Great Bay. Dynamics of marine ecosystems and current problems of preserving the biological potential of the seas of Russia. Vladivostok Dal'nauka 50-74.
-
Moshchenko AV, Shaikhlislamova LE (2010) Ecological state of the eastern part of East Bosphorus Strait (Peter the Great Bay, Sea of Japan). Izv. TINRO 161: 199-211.
-
Moshchenko AV, Belan TA (2005) Near-bottom environmental conditions and macrobenthos of the inner part of Amursky Bay (Peter the Great Bay, Japan Sea). Pacific Oceanography 3(2): 121-136.
-
Belan TA, Belan LS, Berezov AV (2009) Living conditions and peculiarities of spatial distribution of macrozoobenthos at the marine area of Vladivostok port (Peter the Great Bay, Sea of Japan). Vladivostok Dalnauka, pp: 116-128.
-
Belan TA (2015) Comparative characteristics of environmental conditions and parameters of macrozoobenthic communities at marine coastal areas near Vladivostok. Vladivostok Dalnauka, pp: 156-171.
-
(1996) Determination of contaminants in samples of marine sediments and suspended matter. RD 52(10): 556-595.
-
Ackerman F, Bergmann H, Schleichert U (1983) Monitoring of heavy metals in coastal and estuarine sediments – a question of grain size: <20 μm versus <60 μm. Environ Technol Letters 4(7): 317-328.
-
Windom HL, Schropp SJ, Calder FD, Ryan JD, Smith RGJ, et al. (1989) Natural trace metal concentrations in estuarine and coastal marine sediments of the southeastern United States. Environ Sci Technol 23(3): 314-320.
-
Belan TA, Moshchenko AV, Chernova AS (2003) Long- time changes in species diversity of polychaete taxocenes in coastal area of Sea of Japan. Reports of working meeting on study of global changes at Far East region. Vladivostok Dalnauka, pp: 196-224.
-
Belan TA, Moshchenko AV (2005) Polychaete taxocene variability associated with sediment pollution loading in the Peter the Great Bay (Sea of Japan). Ocean Science Journal 40(1): 1-10.
-
Clarke KR (1990) Comparison of dominance curves. Exptl Mar Biol Ecol 138 (1-2): 143-157.
-
Borja A, Franco J, Muxika I (2004) The biotic indices and the Water Framework Directive: the required consensus in the new benthic monitoring tools. Mar Poll Bull 48(3- 4): 405-408.
-
Muxika I, Borja A Bald J (2007) Using historical data, expert judgment and multivariate analysis in assessing reference conditions and benthic ecological status, according to the European Water Framework Directive. Mar Poll Bull 55(1-6): 16-29_._
-
AZTI Marine Biotic Index, http://ambi.azti.es/.
-
Borja A, Mader J, Muxika I (2012) Instruction for the use of the AMBI index software (Version 5.0). Revista de Investigacion Marina 19(3): 72-82.
-
Borovikov VP, Borovikov IP (1998) STATISTICA®- Statistical analysis and data processing in Windows® media. Information and publishing house, Moscow Filin.
-
Shitikov VK, Rosenberg GS (2013) Randomization and bootstrap: statistical analysis in biology and ecology using R. Tol’yatty, Kassandra.
-
(1995) Statistical analysis and interpretation of marine community data. Reference methods for Marine Pollution Studies UNEP 64.
-
Oksanen J (2015) Multivariate Analysis of Ecological Communities in R: vegan tutorial. Pp: 1-43.
-
Sukhanov VV (2005) Scientific graphics using PC. Vladivostok Dalnauka.
-
Surfer Mapping System, http://www.goldensoftware.com.
-
Rygg B (1985) Distribution of species along pollution- induced diversity gradients in benthic communities in Norwegian Fjords. Mar Poll Bull 16(12): 469-474.
-
Muxika I, Borja A, Bonne W (2005) The suitability of the marine biotic index (AMBI) to new impact sources along European coasts. Ecological Indicators 5(1): 19- 31.
-
Sevastyanov AV, Lishavskaya TS, Chatkina TV (2012) Hypoxia of near bottom waters in coastal areas of Peter the Great Bay. FERHRI Proceedings 154: 226- 244.
-
Tishchenko HY, Lobanov VB, Zvalinsky VI, Sergeev AF, Volkova TI, et al. (2011) Seasonal hypoxia of Amursky Bay (Sea of Japan). Izv TINRO 165: 136-157.
-
Moshchenko AV, Belan TA, Lishavskaya TS, Borisov BM (2017c) Ecological state of the marine environment and macrozoobenthos at the southern tip of the Murav'ev-Amursky Peninsula. Proceedings of the FERHRI.
-
Moshchenko AV, Belan TA (2008) Ecological studies and the state of the ecosystem of Amursky Bay and the estuarine zone of the Razdolnaya River (Sea of Japan). Vladivostok Dalnauka, pp: 61-91.
-
Moshchenko AV, Belan TA, Borisov BM, Lishavskaya TS, Sevastianov АВ (2017a) Macrozoobenthos of soft sediments of Peter the Great Bay and chemical pollution of the environment, in: The Far Eastern seas and their basins: biodiversity, resources, environmental problems. The Second All-Russian Conference with International Participation, timed to the year of ecology in Russia. (3-4 October) Vladivostok, pp: 90-92.
-
Moshchenko AV, Belan TA, Lishavskaya TS, Borisov BM (2017b) The maximal permissible level of pollution and macrozoobenthic communities (Abstr.). The Third Scientific Conference on Oceanography of the Peter the Great Bay and the adjacent part of the Sea of Japan. (26-28 April) Vladivostok, pp: 26.
-
Diaz RJ, Rosenberg R (2008) Spreading Dead Zones and Consequences for Marine Ecosystems. Science 321(926): 926-929.
- Genetic Improvement of Nile Tilapia (Oreochromis niloticus): Advances in Selective Breeding and Genomic Approaches for Sustainable Aquaculture
- Microplastics, Contaminants, and Waste Hotspots: Divergences and Faults in Prioritizing Control Efforts
- Creating a Healthier, More Vibrant Open and Closed Aquatic Environment. A Submersible, Centrifugal Magnetically Affixed Current Changing Aquarium Pump
- An Attempt to Assess Alpha Diversity and Sample Size: Using the Ostracod Assemblages off Kumamoto Port, Japan
- Assessment of the Efficiency of Common Fishing Gears and Crafts Used at Mohananda River of Chapai Nawabganj, Bangladesh
- Fish Productivity and Biodiversity Status of Sundarban Mangrove in Bangladesh