Culture of Soft Shell Mangrove Crab, Scylla Spp. Production in the Southwest Region of Bangladesh
The experiment was conducted for a rearing for a period of 150 days from mid-September to mid-February 2017 in three earthen ponds with an installing of 9880 cages per hectare with an average depth of 1.0 meter. The experiment was designed at the ponds of Kaligonj Chingri Farm as a treatment T1, Allarchar chingri farm as a treatment T2 and Shamnagar private crab farm as a treatment T3. Before stocking crabs were categorized at five size groups. At stocking, all crabs were with an initial mean carapace width and weight of individual was recorded in three treatments. The average final weight of crab was recorded to be 180.56±4.08, 175.80±7.11 and 178.62±6.42 g in treatment T1, T2 and T3, respectively. The increase in weight of mud crab was the highest in T1 followed by T3 and T2. About five group of different crab weight was stocked in the cages of three treatments. Best SGR (1.67±0.01) and FCR (2.00±0.08) were recorded in treatment T1. The highest survival rate was also observed in T1 and the lowest survival rate was in T2. There was a significant variation (P<0.05) in the survival rate of crabs among three treatments. The net production of crab was at 5082.51, 4689.63 and 4923.48 kg/ha in treatment T1, T2 and T3, respectively. Highest production of soft shell crab was recorded in treatment T1. But no significant (P<0.05) different was recorded in treatment T1 and T3. But a significant (P>0.05) different was found between treatment T2 and treatment T1 and T3. Majority of the crabs about 60-70% molted during night than day time. As the crabs were increased in size, molt duration became longer from 17.0 to 26 days. Overall, highest growth, survival, production and net benefit of soft shell crab recorded at treatment T1. Therefore, treatment T1 and treatment T3 appeared to be most suitable for soft shell crab culture for availability of saline water and trash fish in this area.
Introduction
Mud crab aquaculture has been practiced for many years in the coastal regions, particularly in southeast (Chittagong, Cox, s Bazar, Noakhali) and southwest bhola, Potuakhali, Barguna, Phirujpur, Bhagerhat, Khulna and Satkhira) Bangladesh [1]. Farmers are to be practiced soft shell mud crab cage culture in the coastal area of Stathkhira and Cox’s Bazar districts.
There are four species of mangrove crab or mud crab of the genus Scylla, namely; S. serrata, S. olivacea, S. paramamosain and S. tranquebarica [2, 3, 4] and the two first species are common in Bangladesh. Among two common mangrove crab species in Bangladesh S. serrata is the fast growing species. For fattening this species is a very suitable for culture in estuaries including brackish water ponds. Most consumers prefer large size mud crabs. Live mud crabs are always highly demand and fetch attractive price in international markets [5]. Live crabs are mainly exported to south-east Asian countries. Female crabs are highly demandable particularly Hong Kong, Taiwan, Singapore and Japan. There is another growing market for frozen soft-shelled mud crabs in the USA as a value added product. Many consumers prefer soft-shell crabs because it can be eaten whole when cooked. Among the marine crustaceans found along the Bay of Bengal coasts, crab ranks second after shrimp. The crab fishery in Bangladesh is fast developing and there is high demand for crab due to its taste and nutrient contents [6].
The crabs molt several times to grow. During molting the old exoskeleton or shell splits and the crab backs out of its exoskeleton. The newly molted crab is soft. The supply of soft-shell crabs depends on the ability of collectors to recognize crabs in the premolt stage. Production of soft-shell crabs can be continuing if a continuous supply of 80-160 g crabs is ensured. In the present study 80-180g crabs were used to know the molting duration, weight increment and the difficulties in availability of small and bigger-sized crabs in the soft- shell crab production. In Bangladesh soft-shell crabs production is running depending on wild seed stock. But the aquaculture of crab in pen and cage would not be sustainable because of shortage of crab population.
This study presents the results of the soft-shell crab production using wild stock of Scylla spp. population. There is no established hatchery in Bangladesh. Soft shell crab farmer is totally depended on wild stock of Mangrove area. A systematic plan is needed to continue soft shell crab culture by ecofriendly capturing of mud crab from coastal area until to establish crab hatchery in Bangladesh.
Materials and Methods
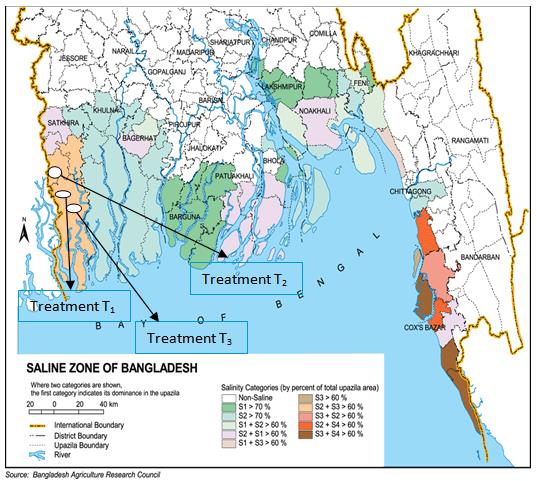
Culture of soft-shell mangrove crab Scylla spp. was carried out in Kaligonj chingri farm, Allarchar chingri farm and Shamnagar private crab farm in the southwest region of Bangladesh (Figure 1).
Study Area and Experimental Design
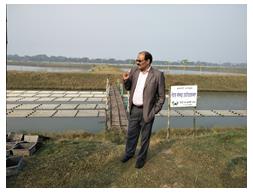
The research was designed at the ponds of Kaligonj Chingri Farm as treatment T1 (Figure 2), Allarchar chingri farm as treatment T2 (Figure 3) and Shamnagar private crab farm as treatment T3 (Figure 4). The experiment was conducted for a period of 150 days from mid-September to mid-February 2017 in six earthen ponds with an installing of 9880 cages per hectare with an average depth of 1.0 meter.

The ponds were having similar rectangular size, depth, basin conformation, contour and bottom type. Three
treatments were employed with two replicates each.
Pond Preparation, Stocking and Fertilization
The ponds were dewatered, freed from aquatic vegetation, exposed to full sunlight and had a well designed system of inlet and outlet. After drying, quicklime (CaCO3, 250 kg/ha) was spread over the pond bottom and liming also during the experimental period. All the ponds were filled with saline water. The experimental cage was stocked one crab per cage up to molting. Before installing cages, all the ponds were fertilized with cow dung at the rate of 247.0 kg/ha, urea 25.0 kg/ha and TSP 37.50 kg/ha to stimulate the primary productivity of the ponds.
Cage Setting
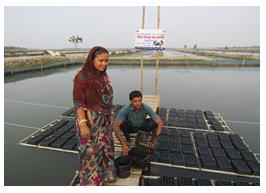
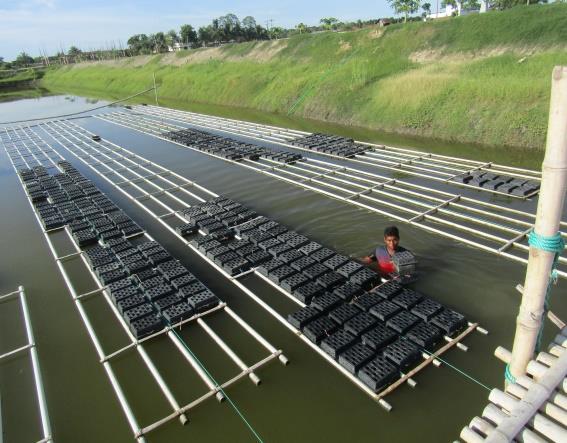
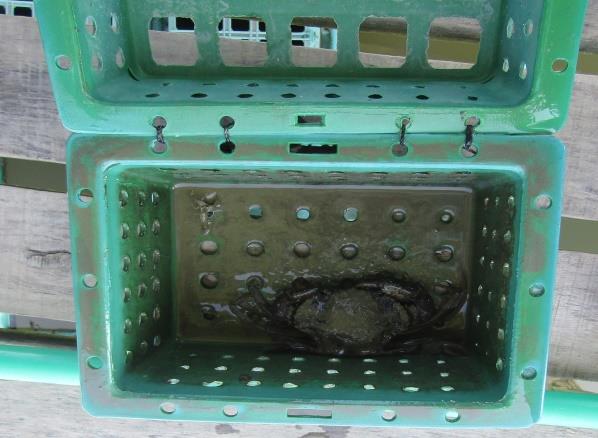
About 9880 crab boxes per hectare of low density polyethylene (LDPE) were used for soft-shell crab production. The size of the boxes 30.5 × 30.5 × 30.5 cm (lower portion) and 25.4 cm at the top of the cover is 20.4 cm in height (Figure 5). The box was designed to accommodate 300 g crab. The base and the top cover of the box were joined with PVC rings. The boxes were posted on 40 mm PVC floating frame where 50 mm PVC spacers were used instead of wooden poles to maintain the distance between each long pipe (Figure 6). The floating frame was provided with rope tide at both ends of the frame to facilitate movement under the bridge or observation flat form during feeding, monitoring band collection of molted crabs. A long galvanized wooden bridge with roof served as the area of feeding and monitoring of crabs while moving the floating frames.
Source and Stocking of Crabs
The crabs were collected from the mangrove area of Sundarbon and categorized up to 81 to 180 g for this study. The pond-reared crabs were grouped into five size ranges (Table 1). Each box was numbered for easy monitoring and feeding.
| Number | Size groups of mud crab (g) | ||||
|---|---|---|---|---|---|
| 1 | 81-100 | ||||
| 2 | 101-120 | ||||
| 3 | 121-140 | ||||
| 4 | 141-160 | ||||
| 5 | 161-180 |
Table 1: Different size group of _Scylla sp._ based on the soft shell crab production.
Supplementary Feeding
In order to meet the increasing dietary demand, crabs in the production boxes were feed with trash fish at 2.0% of the body weight regularly.
Monitoring
The crabs were monitored in each box every four hours. Newly molted crabs were removed and measured for body weight and carapace width. The crabs were observed for molting at 0100, 0500, 900, 1300, 1700 and 2100 hrs.
The physico-chemical parameter of the experimental area was within the suitable range for mud crab and did not show any marked variation during culture period except Allarchar Chingree farm. The water temperature ranged from 26.77 to 31.15oC during experimental period. The dissolve oxygen was recorded at 3.80 ppm in the morning while 5.50 ppm in the afternoon. The range of salinity recorded at 2.20 to 18.50 ppt. In Allarchar Chingree farm, salinity was recorded at 2.2 ppt in December and January. pH was found at 7.3 -8.6, respectively (Table 2).
Water Quality Parameters
Physico-chemical parameters of ponds water were monitored between 9.00 and 10.00 h. Water temperature was recorded using a Celsius thermometer and transparency (cm) was measured by using a Secchi disc of 20 cm diameter. Dissolved oxygen and pH were measured directly using a digital electronic oxygen meter and an electronic pH meter. Salinity of water was measured by Refactometer. Total alkalinity was determined by titrimetric method [7].
Estimation of Growth, Survival and Production
Growth in terms of weight and carapace width, Specific Growth Rate (SGR) and Food conversion rate (FCR) was estimated. SGR and FCR were calculated according to Brown ME [8], Castell JD, et al. and Gangadhara B, et al. respectively [9, 10, 11]. The body weight and carapace width of the crabs were taken at stocking and after molting. Survival (%) and production of crabs were then calculated and compared among the treatments.
Economic Analysis
The cost analysis was in terms of hectare to maintain a standard unit. Cost-return and partial budgeting analyses were done to compare the viability and profitability of the various treatments used [12].
Analysis of experimental data
The data were analyzed through one way analysis of variance (ANOVA) using MSTAT followed by Duncan’s New Multiple Range test to find out whether any significant difference existed among treatment means [13, 14, 15].
Results
| Treatment | |||||||||||
|---|---|---|---|---|---|---|---|---|---|---|---|
| Parameter | |||||||||||
| T1 | T2 | T3 | |||||||||
| Temperature (oC) | 29.88±2.61 | 29.86±2.66 | 29.90±2.60 | ||||||||
| Transparency (cm) | 28.22±4.66a | 27.28±5.44b | 26.26±6.44c | ||||||||
| pH | 7.88±0.14 | 7.80±0.16 | 7.92±0.12 | ||||||||
| Dissolved oxygen (mg/l) | 5.20±0.66 | 4.88±0.48 | 5.01±0.88 | ||||||||
| Salinity (ppm) | 16.20±3.02 | 12.20±3.88 | 14.80±3.66 | ||||||||
| Total alkalinity (mg/l) | 132.16±8.84b | 127.48±7.14c | 136.08±8.44a |
Table 2: Physico-chemical characters of water in the cage culture of mud crab during the experimental period.
- Body Weight and Carapace Width regularly. The growth in terms of weight showed not much variation in different treatment and continued till final harvesting. No formulated feed was used in this experiment.
- The increase in body weight and carapace width of various size groups of crab during molting is shown in
- Tables 2-7. The growth and production of crabs in term of gain in weight under three treatments were monitored
- Body weight (Treatment T1)
- Size group (g)
- Before molting (g) After molting (g) Net weight gain (g)
- Increase in average body-weight (%)
- Weight (kg)
- 81-100
- 92.5±1.12
- 136.4±3.34
- 43.9±2.02
- 47.46±1.08
- 13.64±0.96
- 101-120
- 109.6±1.28
- 159.2±3.44
- 49.6±3.25
- 45.26±1.42
- 15.92±1.10
- 121-140
- 128.8±1.08
- 186.8±3.14
- 58.0±3.06
- 45.03±1.34
- 18.68±1.04
- 141-160
- 148.2±1.14
- 208.0±3.08
- 59.8±2.85
- 40.35±1.11
- 20.80±1.01
- 161-180
- 167.7±1.32
- 212.4±2.88
- 44.7±1.96
- 26.67±0.91
- 21.24±0.99
Table 3: Increase in body weight after molting in various size groups of Scylla spp. in treatment T1.
- Table 3: Increase in body weight after molting in various size groups of Scylla spp. in treatment T1. Values presented are means ± S.D of 100 crabs.
- Body weight (Treatment T2)
- Size group (g)
- Before molting (g)
- After molting (g)
- Net weight gain (g) Increase in average body-weight (%)
- Weight (kg)
- 81-100
- 90.6±1.11
- 130.4±3.11
- 39.80±2.32
- 43.93±1.10
- 13.04±0.55
- 101-120
- 105.2±1.28
- 155.4±3.24
- 50.20±3.04
- 47.72±1.24
- 15.54±0.59
- 121-140
- 129.1±1.08
- 182.6±3.07
- 53.50±3.11
- 41.44±1.24
- 18.26±0.63
- 141-160
- 147.9±1.14
- 201.9±3.22
- 54.0±2.44
- 36.56±1.22
- 20.19±0.88
- 161-180
- 166.4±1.32
- 208.7±2.08
- 42.30±1.88
- 25.42±0.98
- 20.87±1.01
Table 4: Increase in body weight after molting in various size groups of Scylla spp. in treatment T2.
- Table 4: Increase in body weight after molting in various size groups of Scylla spp. in treatment T2. Values presented are means ± S.D of 100 crabs.
- Body weight (Treatment T3)
- Size group
- Before molting (g)
- After molting (g)
- Net weight gain (g)
- Increase in average body-weight (%)
- Weight (kg)
- 81-100
- 91.4±1.11
- 134.4±2.88
- 43.00±2.44
- 47.05±1.21
- 13.44±0.74
- 101-120
- 107.2±1.28
- 160.8±3.04
- 53.60±3.13
- 50.60±1.82
- 16.08±0.86
- 121-140
- 130.4±1.08
- 180.1±3.01
- 49.70±3.04
- 38.11±1.44
- 18.01±0.92
- 141-160
- 150.5±1.14
- 191.0±3.14
- 40.50±2.74
- 26.91±1.30
- 19.10±1.05
- 161-180
- 170.1±1.32
- 215.7±2.02
- 45.60±2.01
- 26.80±1.10
- 21.57±1.08
Table 5: Increase in body weight after molting in various size groups of Scylla spp. in treatment T3.
In every treatment five size groups were tested to find out the net weight gain, percentage of average body weight and average total weight. In treatment T1, size group 81-100 g showed result about 13.64 kg, size group 100-120 g showed result about 15.92 kg, size group 121- 140 g showed result about 18.68 kg, size group 141-160 g showed result about 20.80 kg and size group 161-180 g showed result about 21.24 kg. Total production was recorded at 5082.51 kg/ha. In treatment T2, size group 81-100 g showed result about 13.04 kg, size group 100- 120 g showed result about 15.54 kg, size group 121-140 g showed result about 18.26 kg, size group 141-160 g showed result about 20.19 kg and size group 161-180 g showed result about 20.87 kg. Total production was recorded at 4689.63 kg/ha. In treatment T2, size group 81-100 g showed result about 13.44 kg, size group 100- 120 g showed result about 15.55 kg, size group 121-140 g showed result about 18.21 kg, size group 141-160 g showed result about 19.21 kg and size group 161-180 g showed result about 21.77 kg. Total production was recorded at 4923.48 kg/ha (Tables 6-7).
| Carapace width | ||||||||||||
|---|---|---|---|---|---|---|---|---|---|---|---|---|
| Size group (g) | c | Increase in average | ) | Increase in average carapace - width (%) | ||||||||
| Before molting (cm) | After molting (cm) | |||||||||||
| arapace - width (cm | ||||||||||||
| 81-100 | 8.40±0.11 | 9.80±0.10 | 1.40±0.09 | 16.67±0.15 | ||||||||
| 101-120 | 9.00±0.07 | 10.20±0.10 | 1.20±0.08 | 13.33±0.18 | ||||||||
| 121-140 | 9.50±0.11 | 10.70±0.09 | 1.20±0.10 | 12.63±0.16 | ||||||||
| 141-160 | 9.80±0.08 | 11.00±0.08 | 1.20±0.11 | 12.25±0.13 | ||||||||
| 161-180 | 10.20±0.09 | 11.30±0.09 | 1.10±0.06 | 10.78±0.11 |
Table 6: Increase in carapace width after molting in various size groups of Scylla serrata, in treatment T1.
| Carapace width | ||||||||||||
|---|---|---|---|---|---|---|---|---|---|---|---|---|
| Size group (g) | Increase in average | I | ncrease in average carapac | |||||||||
| Before molting (cm) | After molting (cm) | |||||||||||
| carapace width (cm) | width (%) | |||||||||||
| 81-100 | 8.50±0.12 | 9.80±0.09 | 1.30±0.06 | 15.29±0.15 | ||||||||
| 101-120 | 8.90±0.09 | 10.10±0.11 | 1.20±0.07 | 13.48±0.11 | ||||||||
| 121-140 | 9.30±0.10 | 10.50±0.10 | 1.20±0.08 | 12.90±0.18 | ||||||||
| 141-160 | 9.60±0.07 | 10.80±0.08 | 1.20±0.10 | 12.50±0.11 | ||||||||
| 161-180 | 10.1±0.11 | 11.20±0.08 | 1.10±0.07 | 10.10±0.15 |
Table 7: Increase in carapace width after molting in various size groups of Scylla serrata in treatment T2.
The increase in average carapace width (%) of crab in treatment T1, T2 and T3 were (10.59-12.65) %. The increase in average carapace width (%) of crab in treatment T1, T2 and T3 were (16.67-10.78)%, (15.29- 10.10)% and (15.12-10.78)% and increase in average carapace width were (1.40-1.10)cm, (1.20-1.10) cm and (1.15-1.2) cm in treatment T1, T2 and T3 (Tables 5-7). However, the increase in average carapace width and increase in average carapace width of soft shell crab in different treatments were not significantly different (P>0.05) (Table 8).
| Carapace width | ||||||||||||
|---|---|---|---|---|---|---|---|---|---|---|---|---|
| Size group (g) | Increase in average | I | ncrease in average carapac | |||||||||
| Before molting (cm) | After molting (cm) | |||||||||||
| carapace width (cm) | width (%) | |||||||||||
| 81-100 | 8.50±0.10 | 9.90±0.09 | 1.40±0.09 | 16.47±0.15 | ||||||||
| 101-120 | 9.30±0.06 | 10.60±0.10 | 1.30±0.08 | 13.98±0.21 | ||||||||
| 121-140 | 9.60±0.11 | 10.90±0.11 | 1.30±0.10 | 13.54±0.14 | ||||||||
| 141-160 | 9.90±0.08 | 11.10±0.09 | 1.20±0.11 | 12.12±0.21 | ||||||||
| 161-180 | 10.20±0.08 | 11.30±0.10 | 1.20±0.06 | 10.78±0.14 |
Table 8: Increase in carapace width after molting in various size groups of Scylla serrata in treatment T3.
| Treatments | |||||||||||
|---|---|---|---|---|---|---|---|---|---|---|---|
| Parameters | |||||||||||
| T1 | T2 | T3 | |||||||||
| Specific growth rate (SGR) | 1.67±0.01a | 1.59 ±0.01b | 1.60 ±0.02c | ||||||||
| Survival rate (%) | 95.0±1.03a | 90.0±1.76c | 93.00±1.22b | ||||||||
| FCR | 2.0±0.08a | 2.06±0.06c | 2.09±0.06c | ||||||||
| Production (kg)/ha | 5082.51±8.02a | 4689.63±6.11c | 4923.48±7.12b |
Table 9: Growth performance, survival and production of Scylla spp. after 180 days of rearing; mean ± S.D. with ranges in Figure
Table 9: Growth performance, survival and production of Scylla spp. after 180 days of rearing; mean ± S.D. with ranges in Figure in the same row having the same superscript are not significantly different (P>0.05). Figure in the parenthesis indicates the range. Table 9: Growth performance, survival and production of Scylla spp. after 180 days of rearing; mean ± S.D. with ranges in parentheses.
The highest survival rate (95.0±1.03) was also observed in T1 and the lowest (90.0±1.76) in T2. There was a significant variation (P<0.05) in the survival rate of crabs among three treatments. The net production of crab was (5082.51±8.02kg), (4689.63±6.11kg) and (4923.48±7.12kg) ha-1.days-180 in treatment T1, T2 and T3, respectively. Highest production of soft shell crab was recorded in treatment T1. But no significant (P<0.05) different was recorded in treatment T1 and T3. But a significant (P>0.05) different was found between treatment T2 and treatment T1 and T3 (Table 10).
Time of Molt
Majority of the crabs molted during night time (60-70)% than day time (30-40)% (Table 9).
| Size group | Molting (%) at night time | Molting (%) at day time | Stocking to molting period (days) | ||||||||
|---|---|---|---|---|---|---|---|---|---|---|---|
| 81-100 | 70.5±0.11 | 29.5±0.10 | 17.0±0.90 | ||||||||
| 101-120 | 68.8±0.07 | 31.2±0.10 | 18.0±0.82 | ||||||||
| 121-140 | 67.4±0.11 | 32.6±0.09 | 20.0±0.88 | ||||||||
| 141-160 | 66.2±0.08 | 33.8±0.08 | 23.0±0.77 | ||||||||
| 161-180 | 69.3±0.09 | 30.7±0.09 | 26.0±1.86 |
Table 10: Percentage of molting during the day and night and molt duration of Scylla spp.
101-120 g, 20.0 days in 121-140 g, 23.0 days in 141-160 g and 26.0 days in 161-180 g crabs (Table 11).
| Amount | ||||||||||
|---|---|---|---|---|---|---|---|---|---|---|
| TK/ha/day150 | ||||||||||
| Item | Remarks | |||||||||
| Treatment T1 (Tk) | Treatment T2 (Tk) | Treatment T3 (Tk) | ||||||||
| Total return (TR) | 3049506 | 2813778 | 2954088 | Sale price @ Tk.600/kg | ||||||
| a. Variable cost: | ||||||||||
| 1. Price of crab | 171000 | 174000 | 177000 | @ Tk.300/kg | ||||||
| 2. Price of cage | 642200 | 642200 | 642200 | @ Tk.65/number | ||||||
| 2. Feed (Tk. 52.00/kg) | 177840 | 185130 | 188488 | @ Tk. 52/kg | ||||||
| 3. Fertilizer, lime | 8212 | 8212 | 8212 | |||||||
| 4. Human labour cost | 108000 | 108000 | 108000 | @ Tk. 200/number | ||||||
| (03 labour day-1) | ||||||||||
| 5. Chemicals | 7208 | 8280 | 8390 | |||||||
| Wooden bridge | 200000 | 200000 | 200000 | |||||||
| 6. Miscellaneous | 50000 | 50000 | 50000 | With harvesting | ||||||
| Total Variable cost (TVC) | 1364460 | 1375822 | 1382290 | |||||||
| b. Fixed cost : | 24700 | 24700 | Tk. 200/dec. according to local rate. | |||||||
| 1.Pond rental value | 24700 | |||||||||
| 2.Interest of operating | 136446 | 137582 | 138229 | 10% interest according to BKB, |
capital Bangladesh Total fixed cost (TFC) 161146 162282 162929 Total cost 1525606 1538104 1545219 (TC= TVC+TFC) Gross margin 1685046 1437956 1571798 (GM= TR-TVC) Net return (TR-TC) 1523900 1275674 1408869
- Figures with different superscripts in the same row varied significantly (P<0.05). Figures in the parenthesis indicate range. *1 US$ =BDTk. 84.00, BKB= Bangladesh Krishi Bank.
Table 12: Cost and benefits from the nursing of Scylla spp. in 1-ha earthen ponds for a culture period of 150 days.
Total cost production in treatment T1, T2 and T3 was recoded BDTk. 1525606, 1437956 and 1545219 respectively. Cost of production in three treatments was more or less similar (Table 3). Highest net return (in term of Bangladeshi Tk/ha) was obtained in treatment T1 (1523900) followed by T3 (1408869) and T2 (1275674).
Discussion
The physicochemical parameters exert an immense influence on the maintenance of a well aquatic environment and production of food organisms. Growth, feed efficacy and feed consumption of aquatic live are normally governed by a few environmental factors [16]. The physico-chemical parameters were recorded in three treatments was favorable for the growth and survival of the crabs. For experimental period, the water temperature in three treatments T1, T2 and T3 was conducive to the growth of the soft shell crab. The salinity in treatments T1 and T3 was relatively more stable; due to a good water exchange in the pond during the culture period as the pond was located close to the seawater inlet. But in case of treatment T2 the salinity range for soft shell crab culture was not favorable for December to January. Because, the pond was not located close to the seawater inlet [17]. The pH values agree well with the findings of APHA and Clesceri LS, et al. [8, 19]. The dissolved oxygen in the morning was low in ponds stocked with a high density of fish compared to ponds stocked with a low density. Similar results were observed by Boyd (1982) and APHA (1998) [18, 19].
Crustacean’s growth is to be a combination of the increase in size after a molt the frequency of molting [20, 21]. The molt interval becomes longer in bigger- sized crabs. Majority of the crabs molted during the night. The newly molted crab expands its body and limbs by talking in water before the new shell hardness [22]. The present study shows the possibility of a continuous supply of crabs for soft shell crab production farm. I this study, about (60-70)% crabs molted during night [23]. About
80-180 g crabs was used in the box for short duration of molting. The molted crabs with less than 180 g BW were restocked in new boxes to determine the number of days until the succeeding molt. It took a longer period of time for these restocked crabs. Generally new stock of Scylla spp. with size ranges from 80-180 g sourced directly from the Mangrove area molted within 26 days. Crabs weighing 80-160g is ideal for soft shell crab production since molt duration is shorter [24]. During the culture period it is found that mortality of crabs in the cage was comparatively low because the crabs were collected from the very closed to mangrove area and the crabs were not subjected to transport stress. But in case of treatment T2 crabs were collected from a long distance mangrove area and crabs were in stress position.
The stocking densities of crabs were 9880 cages/ha which is very similar to the culture of soft shell crab in Taiwan [25]. No cannibalism was found in three treatments [26, 27]. In this study, the survival was higher due to no cannibalism of mud crab because one crab was stocked in one cage [3]. Survival of mud crab for the present study was recorded at 95%, 90% and 95% in the treatment T1, T2 and T3 [28]. This experiment has shown that the crabs were able to grow in the cage, as indicated by the increase in SGR values in three treatments. A similar growth rate is recorded by Bensam P [29] who found increase in weight in a period of 3 months of culture. However the lower FCR value in the present study indicated better food utilization efficiency. Significantly higher survival was noted in treatment T1, where, the salinity of stocking pond was very optimum level. The reason for reduced survival rate in treatment T2 was due to lower salinity of the experimental ponds [29].
The mangrove crab is omnivorous and feeds on raw crushed fish, crustaceans, bivalves, molluscs, penaeids and detrital matter. The application of trash fish as feed, the presence of naturally occurring food and muddy nature favored the growth of mud crab [30, 31]. Growth of crab depended on the quality of food available. In the present investigation, the amount of trash fish given in different treatments was based on the number of crab stocked and amount of feed provided per individual was kept at the same level. The results in the present experiment are very similar to those of Chakraborty BK, Mirera Do, et al. Escritor GL; Samonto GPB, et al.; Mwaluma J and Bensam P [1, 23, 29, 30, 31, 32, 33]. In the present study, a significant higher net benefit was obtained from treatment T1 than those from the treatment T3 and T2. Overall, highest production, survival and benefits of soft shell crab culture were recorded in treatment T1.
Finally, it can be concluded that the survival, growth, production of Scylla spp. were dependent on a good salinity, feed and stress of stocking population and management of cage. Stocking of 9880 cage/ha may be advisable for rearing of soft shell crab culture for 150 days culture period. Production of adequate quality mud crab through application of our present findings might be extremely helpful for earning economic benefit of farmer.
Acknowledgements
The author wishes to thank private soft shell farmer and Department of Fisheries who help for successfully conduct the experiments.
References
-
Chakraborty BK (2018) Effect of Stocking Density on Survival, Growth and Production of Mud Crab Juvenile by Pen Culture System of Bangladesh. International Journal of Oceanography & Aquaculture 2(4): 1-11.
-
Mirer DO (2014) Capture-based mud crab (Scylla serrata) aquaculture and artisanal fishery in East Africa-Practical and ecological perspectives. Ocean Docs Repository of ocean publications: 79.
-
Trino AT, Millamena OM, Keenan C (1999) Commercial evaluation of monosex pond culture of the mud crab Scylla species at three stocking densities in the Philippines. Aquaculture 174(1-2): 109-118.
-
Keenan CP, Davie PJF, Mann DL (1998) A revision of the genus Scylla De Haan, 1883 (Crustacea: Decapoda: Brachyura: Portunidae). Raffles Bulletin of Zoology 46(1): 217-245.
-
Kathirvel M (1993) Mud crab. In: Handbook on aqua farming of shrimps, lobsters and crabs, MPEDA Publication, Cochin, pp: 72.
-
Keenan CP (1999) The fourth species of Scylla. In: Mud Crab Aquaculture and Biology, ACIAR Proceeding No. 78. In: Keenan CP & Blacksha A (Eds.), Darwin, Australia, 21-24 April 1997, Australian, pp: 48-58.
-
Sudakar M, Manivannan K, Soundrapandian P (2009) Nutritive value of hard and soft shell crabs of Portunus sanguinplentus (Herbst). International Journal of Animal and Veterinary Advances 1(2): 44- 48.
-
Clesceri LS, Greenberg AE, Trussell RR (1989) Standard Methods of the Examination of Water and Wastewater 17th (Edn.), American Public Health Association, American Water Works Association and Water Pollution Control Federation, 1015 Washington DC, USA: 10-203.
-
Brown ME (1957) Experimental studies on growth. In: The physiology of fishes, Academic Press, New York 1: 361-400.
-
Castell JD, Tiews K (1980) Report of the EIFAC, IUNS and ICES Working Group on the Standardization of Methodology in Fish Nutrition Research, Hamburg, Federal Republic of Germany. EIFAC Tech Pap 36: 24- 25.
-
Gangadhara B, Nandeesha MC, Varghese TJ, Keshavanath P (1997) Effect of varying protein and lipid levels on the growth of Rohu, Labeo rohita. Asian Fish Sci 2: 139-147.
-
Shang YC (1990) Aquaculture economics analysis: an introduction. World Aquaculture Society 2: 211.
-
Duncan DB (1955) Multiple range and multiple F- testes. Biometrics 11: 1-42.
-
Zar JH (1984) Biostatistics analysis. Prentice-Hall, Inc. Englewood Cliffs, New Jersey, USA pp: 1-718.
-
Statistical Analysis System Institute (1988) SAS/STATTM User’s Guide. Release 6.03 (Edn.), SAS Institute, Cary, NC.
-
Brett JR (1979) Environmental factors and growth. Fish Physiology 8: 599-675.
-
Bhuiyan AL, Islam MJ (1981) Tolerance and distribution of Scylla serrata in response to salinity of Karnafully river estuary, Bangladesh. J Agric 6(1): 7- 15.
-
Boyd CE (1982) Water Quality Management for Pond Fish Culture. Elsevier 318.
-
APHA (1998) Standard methods for the examination of water and wastewater. 20th (Edn.), American Public Health Association, Washington, DC.
-
Hilke A, Shing YL, Jan-Olaf M, Karen D, Inga N, et al. (2016) Life-history, movement, and habitat use of Scylla serrata (Decapoda, Portunidae): current knowledge and future challenges. Hydrobiologia 763(1): 5-21.
-
Edwards E (1979) The Edible crab and it’s Fishery in British Waters. Fishing News Book, England, pp: 142.
-
Ganesh K, Dinakaran GK, Sundaresan T, Satheesh K, Gangadharan KV, et al. (2013) Soft shell crab Production using hatchery-produced Mangrove crab Scylla serrta Juveniles. Rajiv Gandhi Centre for Aquaculture pp: 101-106.
-
Mirera DO, Mtile A (2009) A preliminary study on the response of mangrove mud crab (Scylla serrata) to different feed types under drive-in cage culture system. Journal of Ecology and Natural Environment 1: 7-14.
-
Quinitio ET, Lwin MM (2009) Soft-shell mud crab farming. SEAFDEC Aquaculture Department, Iloilo, Philippines, pp: 19.
-
Chen LC (1990) Mud crab culture. In: Aquaculture in Taiwan. Fishing News Books, London, pp: 142-149.
-
Baliao DD, Rodriguez EM, Gerochi DD (1981) Culture of mud crab Scylla serrata (Forskal) at different stocking densities in brackish water ponds. SEAFDEC/Aquaculture Department Quarterly Research Report 5(1): 10-14.
-
Cholik F, Hanafi A (1992) A review of the status of the mud crab (Scylla spp.), fishery and culture in Indonesia. In: The Mud Crab, Angell CA (Edr.), pp: 13- 28.
-
Triño AT, Millamena OM, Keenan CP, Blackshaw A (1999) Monosex culture of the mud crab Scylla serrata at three stocking densities with Gracilaria as crab shelter, Australian Centre for International Agricultural Research 78: 61-66.
-
Bensam P (1986) Culture experiment on the crab Scylla serrata (Forskal) at Turiconin during 1975- 1977 to assess growth and production. Proc Symp Coast Aqua 4: 1183-1189.
-
Alberts-Hubatsch H, Lee SY, Diele K, Wolff M, Nordhaus I (2014) Microhabitat use of early benthic stage mud crabs, Scylla serrata (Forska ˚l, 1775), in eastern Australia. Journal of Crustacean Biology. 34(5): 604-610.
-
Mwaluma J (2001) Pen Culture of the Mud Crab Scylla serrata, in Mtwapa Mangrove System, Kenya. Western Indian Ocean Journal of Marine Science 1(2): 127- 133.
-
Escritor GL (1972) Observations on the culture of the mud crab Scylla serrata. Coastal Aquaculture in the Indo Pacif Reg Fishing News Books Ltd, London, pp: 355-361.
-
Samonto GPB, Agbayani RF (1992) Pond Culture of mud crab (Scylla serrata). An economic analysis. SEAFDEC-ASIAN Aquacult 14: 3-5.
- Genetic Improvement of Nile Tilapia (Oreochromis niloticus): Advances in Selective Breeding and Genomic Approaches for Sustainable Aquaculture
- Microplastics, Contaminants, and Waste Hotspots: Divergences and Faults in Prioritizing Control Efforts
- Creating a Healthier, More Vibrant Open and Closed Aquatic Environment. A Submersible, Centrifugal Magnetically Affixed Current Changing Aquarium Pump
- An Attempt to Assess Alpha Diversity and Sample Size: Using the Ostracod Assemblages off Kumamoto Port, Japan
- Assessment of the Efficiency of Common Fishing Gears and Crafts Used at Mohananda River of Chapai Nawabganj, Bangladesh
- Fish Productivity and Biodiversity Status of Sundarban Mangrove in Bangladesh