Evaluating Household's Willingness to Pay for Catfish Species Conservation in Lake Hawassa, Sidama National Region State, Ethiopia
Lake Hawassa is one of the main freshwater shallow Lakes found in the central Ethiopian Rift Valley. The total of aquatic and terrestrial habitats adjoining the Lake facilitate the rich diversity of flora and fauna compared to other Ethiopian Rift valleys Lakes. However, the biomass of catfish species in this Lake is declined from time to time. So, the purpose of this study was to evaluate households willingness to pay and determine the factors affecting willingness to pay for catfish species conservation in Lake Hawassa, Sidama National Region state, Ethiopia. The survey was conducted through face-to-face interviews of 200 respondents. The elicitation method used to value is contingent valuation, through a single dichotomous choice and openended follow-up question. The probit model was used to identify the willingness to pay of the respondents. The descriptive result showed that the respondents average age was 28.82 years, the experience of respondents in fishing was 9.3 years, income from fish was 85.8 US$ per year, a distance of respondents home from Lake was 41.54 minutes and land size was 0.2313 hectares and from the total sampled respondents 75% were male and 25% were female. About 82.5% of the respondents were willing to pay and 17.5% were unwilling to pay for catfish species conservation in Lake Hawassa. The mean willingness to pay for catfish species conservation of respondents was found to be 3.62 US$ per year and aggregating the mean value of total respondents would give 954,090.23 US$ per year. The probit model result revealed that the total income, training on fish species conservation, and experience of respondents on fishing were positively affected the willingness to pay. On the other side, the distance of respondents home from Lake and land size of respondents have negatively affected willingness to pay. So, training and awareness creation is needed to fulfill the knowledge gap of communities on catfish species conservation.
Introduction
Providing adequate food for a rapidly increasing human population is one of the greatest challenges of these days in the world. Globally fish production is about 154 million tons per year with a consumption level of 18.5 kg per capita per year [1]. Projections also indicate that the aggregation of global fish supply will increase to 186 million tons (2030) compared to the 154 million tons (2011 year) [2]. Similarly, global fish consumption rates are growing faster than the global population growth, because of increased incomes and awareness of the health benefits associated with consuming fish, as well as rising urbanization [3]. In addition to directly providing high-quality food, fisheries and aquacultures create economic value through the production, trade, and marketing of wild and farmed fish [4]. The Ethiopian economy is heavily dependent on the agricultural sector that is defied by poor cultivation practices and frequent drought. Being the dominant sector, agriculture contributes about 46.3% of the total gross domestic product (GDP), 60% of exports, 98% of the total calorie supply, 70% of industrial raw material suppliers, and 80% of total employment [5].
The artisanal freshwater fishery is one of the most important economic activities in Ethiopia [6]. Improvements in the fishery sector would contribute to poverty alleviation and environmental sustainability in Ethiopia [7]. The fish productions in major Ethiopian Lakes are below the maximum sustainable yields except for Lake Hawassa where 140% of its maximum sustainable yield is caught [8]. The annual per capita consumption of fish from Lake Hawassa is 1.56 kg. Among the major species of fish in Lake Hawassa, tilapia and catfish species account for more than 90% of the landed fish biomass. About 73% of fish caught from Lake Hawassa is sold in a nearby market [6]. The factors, which trigger demand for fish in Hawassa city, include the relatively low price of fish as compared to the increasing prices of its substitutes and religious influences. For example, Ethiopian Orthodox Church followers tend to resort to fish during lent when they abstain from meat and dairy products [9].
The valuation of catfish species conservation in Lake Hawassa from the perception of users is a critical input for the implementation of catfish species conservation. Hence, the project needs to be addressed for the catfish species conservation in Lake Hawassa is keeping the river from pollution, protecting deforestation and land degradation, preventing fishing at the river mouth and river during the breeding season, and providing effective training and extension work for active participation of the community in conservation actions.
Therefore, the objective of this research was to evaluate household’s willingness to pay for a hypothetical project aiming to achieve the above mentioned catfish species conservation points and identify the factors that affect their willingness to pay for it through applied contingent valuation method in Lake Hawassa, Sidama National Region State, Ethiopia.
Methodology
Description of the Study Area
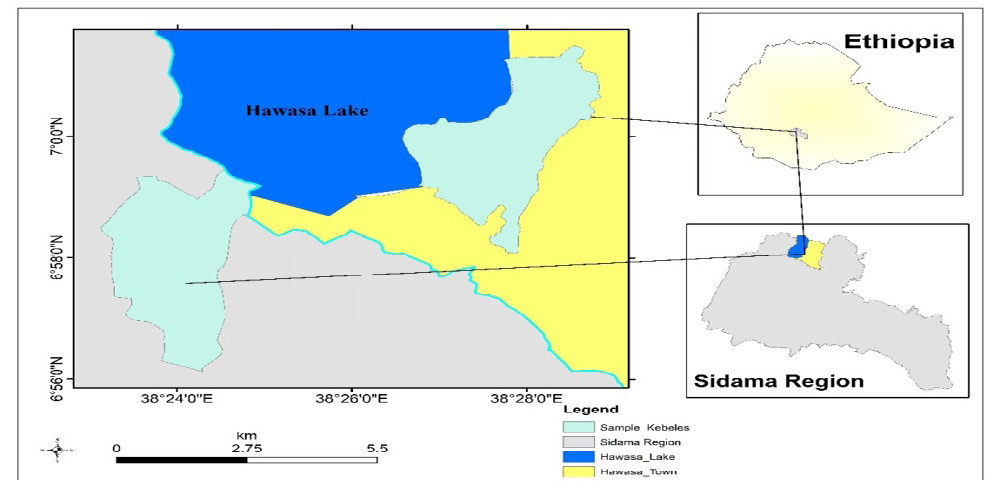
The study was carried out in Lake Hawassa, Sidama National Regional State, Ethiopia. It is 275 km from the capital city of Ethiopia, Addis Ababa. The Lake lies in between 60 56’ to 70 0’ N and 380 24’ to 380 28’ E E. Hawassa city characterized by medium rainfall with a mean annual rainfall of 1000 mm. The annual temperature ranges from 140C to 28 0C with a mean 210C [10]. The Lake is surrounded by four districts such as Addis Ketema, Hayk Dar, Tabor, and Tula [11]. The Lake stretches 16km from the Northeast to Southwest direction and extends 8km from northwest to southeast direction having an approximate water volume of 1.3 billion meter cube (45.9 billion feet3). The maximum depth of the Lake is 21.6m (70.9 feet) with a mean depth of 11m [12]. The catchment has a total area of 1455 km2 of which 93.6 km2 is the surface area of the Lake that may increase up to 99.3 Km2 in the rainy season. The annual net groundwater outflow from Lake Hawassa to adjacent basins is estimated at 58 ×106 m3 [13, 14] (Figure 1).
Sampling Techniques and Sample Size Determination
Three-stage sampling techniques were applied to select sampled respondents. In the first stage, 2 districts were selected randomly from 4 surrounder districts to the Lake. In the second stage, 2 kebeles that are potential in fish production were purposively selected from selected 2 districts. In the third stage, 200 sample respondents were selected using a simple random sampling technique based on probability proportional to the size of the population in the 2 selected kebeles. The sample size of the research was determined based on the Kothari formula for determining the sample size of respondents as follows:
2 $$ n = \frac {z ^ {2} \times p \times q \times N}{e ^ {2} (N - 1) + z ^ {2} \times p \times q} - 1 $$ ( ) Where N is the total size of respondents population, n is the sample size, Z is Z value which is 1.96 as per the table of the area under the normal curve for the given confidence level of 95%, e=margin of error is the plus or minus figure usually, expressed as a decimal (0.05); the estimate should be within 5% of true value. The researchers desire to be used 95% confident that the percentage has been estimated. p=sample proportion, success for each respondent to be included in the sample which is p=0.7, q=1–p, failure for each household to be included in the sample (1- P =0.3).
Types, Sources, and Data Collection Methods
Both primary and secondary sources of data were used in this study. Primary data collected from the surrounding respondents through a structured questionnaire to know their willingness to pay for the conservation of the catfish species and secondary data which was collected from the Lake Hawassa Fishery Association and Hawassa City Agricultural office were used. A Direct (face-to-face) interview method of data collection was used to conduct the survey.
**Methods of Data Analysis**
To address the objectives of this research, two types of analysis, namely descriptive and econometric analyses were used for analyzing the collected data. Stata version 13 was used to analyze the data. Descriptive analysis (minimum, maximum, mean, standard deviation, percentage, frequency, and an inferential statistical test) were used to compare and contrast different categories of sample units concerning the desired variables. Under the econometric analysis, the contingent valuation method was used to calculate the mean willingness of the respondents to pay for the hypothetical catfish conservation program. Besides, the probit model was applied to identify major factors that affect the willingness of the respondents. The study used the probit model developed by Haab TC, et al. [15].
$$WTP = \beta_0 + \beta_1 T_1 + \sum_{i=1}^{n} \beta_i X_i + \epsilon_i$$
Where, WTP is the willingness to pay; $T_1$ is the bid questions; Xi represented explanatory variables, $\beta$ is the coefficients and $\epsilon_i$ is an error term. Willingness to pay equation is a single-bounded dichotomous choice. This model provides information on what variables were crucial for each of the responses to the willingness to pay question. They further state that estimation of the mean willingness to pay is feasible using the contingent valuation method [15] put the general econometric model for a single bounded dichotomous choice as follows:
$$WTP_i = \mu_i + \epsilon_i$$
Where WTP$_i$ represents the $i$th respondent’s willingness to pay, and $i=1, 2,...$, represents the first and second answers. The $\mu_i$ is the means for the first and second responses. $\epsilon_i$ was an unobservable random component.
Setting $\mu_i=xi$, $\beta_i$ allows the mean to be dependent upon the characteristics of the respondents (demographic and socio-economic variables). To construct the likelihood function, we first derived the probability of observing each of the possible single-bid responses. To design the probability that respondent $i$ answers yes to the first bid and no to the second were given by:
$$Pr(\text{yes, no}) = pr(WTP_1j \geq T_1), \Pr(+ \geq T_1)$$
The factors of the willingness to pay for conservation were determined depending on the previous researcher works [16, 17, 18, 19, 20]. Accordingly, the most important determinants were yearly income, age, family size, sex, training on fish conservation, educational level, experience, memberships of environmental project, land size, and distance of respondent’s home from Lake. These determinants include socioeconomic, demographic, and attitude indicators of respondents as explanatory variables. So, for this study the critical variables could be specified as follow:
Where WTP was the willingness to pay for catfish species conservation, AGER was the age of respondents, SER was the sex of respondents, FMSR was the family size of respondents, EDLR was the educational level of respondents, TRR was the training of respondents about fish conservation, DLHR was the distance of respondent’s home from Lake, EXR was the experience of respondents on fishing, LSR was the land size of respondents, TIR was total income of respondents, MEPR was membership of environmental project of respondents and $\epsilon_i$ was an error term.
**Results**
**Descriptive Results**
The socio-economic and demographic characteristics of respondents were computed using minimum, maximum, mean, standard deviation, percentages, frequency distributions, and inferential statistical test. Therefore, a total of 200 respondents from the Addis Ketema and Tabor districts were surveyed and had a complete response. The mean age of respondents is 29 years with a minimum of 15 and a maximum of 65 years. The minimum, maximum and mean distance of Lake from the home of respondents is 1, 180, and 42 minutes respectively which is statistically significant at $t$-value of 2.61. The mean fishing experience of respondents is 9.3 years with a minimum of 0 and a maximum of 50 year/s and also statistically significant at $t$-value of 3.617. The mean landholding size of respondents is 0.23 hectares with a minimum of 0 hectare and a maximum of 2 hectares which is statistically significant at $t$-value of 1.97. The average income of each respondent per year is 85.8 US$ with a minimum of 7.9 US$ and a maximum of 526.3 US$ and also it is statistically significant at $t$-value of 4.92 (Table 1).
| Name variables | No. | Min. | Max. | Mean | Std. Dev. | t-test for Equality of Means | ||
|---|---|---|---|---|---|---|---|---|
| t-value | Mean dif. | Std.dif | ||||||
| Age(AGER) in years | 200 | 15 | 65 | 28.82 | 8.745 | 0.461 | 0.752 | 1.631 |
| The distance of Lake(DLHR) in min. | 200 | 1 | 180 | 41.54 | 30.763 | -2.61*** | -14.722 | 5.643 |
| Fishing experience(EXR) in year | 200 | 0 | 50 | 9.3 | 7.974 | 3.617*** | 5.212 | 1.441 |
| Total land size(LSR) in hectare | 200 | 0 | 2 | 0.2313 | 0.45112 | -1.97* | -0.166 | 0.08416 |
| Total income(TIR) in US$ | 200 | 7.9 | 526.3 | 85.8 | 98.7 | 4.92*** | 3248.874 | 660.281 |
Table 1: Summary statistics of continuous variables. Note: one US dollar is equal to 38.2 ETB. Source: Own computation (2020).
From a total of 200 respondents, 165 (82.5%) of them showed interest to contribute money for catfish species conservation since the catfish species population and quality of the Lake Hawassa were decreased from year to year and 35(17.5%) respondents had not been interested. The main reasons of the 35 respondents who had not been interested in contributing money for catfish species conservation were: Proper management of the catfish species conservation is the responsibility of the government (27,77%), I am poor (I cannot pay)(7,20%) and I am satisfied with the current situation (it does not need improvement) (1, 3%) respectively. From the165 respondents who showed interest to contribute money for catfish species conservation, (95,58%) respondents preferred money to be collected through association payment, (45,27%) of them wanted direct payment, and the remaining (25,15%) preferred via the chairman of the kebeles.
Out of the total surveyed respondents, 75% of respondents were found to be males, while the rest 25% were females. From total respondents 14.5%, 5%,16%, 24% and 40.5% had 1,2,3,4 and more than 4 family members respectively. Out of the total respondents 3.5%, 10.5%, 58.5% , 18.5% , 2% and 7% were illiterate, have none formal schooling, elementary, high school, vocational and college/ university respectively. As the surveyed study showed, 21.5% of respondents didn’t take training and 78.5% of respondents took training, and also 28% of respondents weren’t a member of an organization working on an environmental project, and 72% of respondents participated in the environmental project (Table 2).
| Description | No. | % | Chi-Square Tests (X²) | |
|---|---|---|---|---|
| Sex of respondents (SEXR) | Female | 50 | 25 | 0.289 |
| Sex of respondents (SEXR) | Male | 150 | 75 | 0.289 |
| Sex of respondents (SEXR) | Total | 200 | 100 | 0.289 |
| Total number of families member (FMSR) | One | 29 | 14.5 | 3.249*** |
| Total number of families member (FMSR) | Two | 10 | 5 | 3.249*** |
| Total number of families member (FMSR) | Three | 32 | 16 | 3.249*** |
| Total number of families member (FMSR) | Four | 48 | 24 | 3.249*** |
| Total number of families member (FMSR) | >4 | 81 | 40.5 | 3.249*** |
| Total number of families member (FMSR) | Total | 200 | 100 | 3.249*** |
| Educational level of (EDLR) | Illiterate | 7 | 3.5 | 2.17 |
| Educational level of (EDLR) | None formal schooling | 21 | 10.5 | 2.17 |
| Educational level of (EDLR) | Elementary | 117 | 58.5 | 2.17 |
| Educational level of (EDLR) | High school | 37 | 18.5 | 2.17 |
| Educational level of (EDLR) | Vocational | 4 | 2 | 2.17 |
| Educational level of (EDLR) | College/University | 14 | 7 | 2.17 |
| Educational level of (EDLR) | Total | 200 | 100 | 2.17 |
| Training (TRR) | No | 43 | 21.5 | 22.515*** |
| Training (TRR) | Yes | 157 | 78.5 | 22.515*** |
| Training (TRR) | Total | 200 | 100 | 22.515*** |
| Membership in environmental project (MEPR) | No | 56 | 28 | 4.645** |
| Membership in environmental project (MEPR) | Yes | 144 | 72 | 4.645** |
| Membership in environmental project (MEPR) | Total | 200 | 100 | 4.645** |
Table 2: Summary statistics of the dummy and categorical variables. Source: Own computation (2020).
Probit Model Results
It was applied to estimate coefficients of independent variables for a single bounded dichotomous choice. Before estimating the effect of explanatory variables on respondent’s willingness to pay an assumption test was made for the prevalence of multicollinearity and heteroscedasticity problems. Therefore, from the correlation matrix generated, it was observed that there is no multicollinearity problem. Variance inflation factor (VIF) was 1.32, which is less than ten (10) and implies again there is no series multicollinearity problem. The model passed the assumption test of the overall significance of explanatory variables by using the Wald test. The Wald test takes a chi-squared (χ2) distribution with 10 degrees of freedom was about 72.16 with a p-value (prob> chi2) 0.0000 tell us the probit model as a whole is statistically significant. The likelihood ratio test of overall significance also approves a similar result that the null hypothesis of zero coefficients was rejected at 5% level of significance. Pseudo R-sq is found to be 0.81 in the probit model. This implied the model explains 81% of the variation in willingness to pay. The estimates of the probit regression model also showed that among the ten variables five (training on fish conservation, the distance of respondent’s home from the Lake, experience of respondents, respondent’s land size, and respondent’s total income) were found to be statistically significant in affecting the willingness to pay for catfish species conservation (Table 3). The estimated mean willingness to pay for catfish species conservation of Lake Hawassa from the probit model was 3.62US$ per year (Table 4). Also, from the targeted 256,280 households, the aggregate economic benefit was 954,090.23US$ (Table 5).
| Parameter | Coef. | Robust Std. Err. | P>z | [95% Conf.interval] | ||
|---|---|---|---|---|---|---|
| Cons | β0 | -2.21 | 1.593 | |||
| AGER | β1 | -0.001 | 0.028 | -1.59×10^{-10}$ | $ | |
| SEXR | β2 | 0.239 | 0.569 | 3.07×10^{-8}$ | $ | |
| FMSR | β3 | -0.15 | 0.153 | -1.65×10^{-8}$ | $ | |
| EDLR | β4 | 0.023 | 0.205 | 2.52×10^{-9}$ | $ | |
| TRR | β5 | 2.284*** | 0.411 | 8.94×10^{-5}$ | $ | |
| DLHR | β6 | -0.012* | 0.007 | -1.31×10^{-9}$ | $ | |
| EXR | β7 | 0.069** | 0.031 | 7.66×10^{-9}$ | $ | |
| LSR | β8 | -1.108*** | 0.323 | -1.22×10^{-7}$ | $ | |
| TIR | β9 | 0.002*** | 0.001 | 2.33×10^{-10}$ | $ | |
| MEPR | β10 | -0.426 | 0.552 | -2.72×10^{-8}$ | $ | |
| Wald chi2(10) | 72.16 | |||||
| prob > chi2 | 0.000*** | |||||
| Log pseudo-likelihood | -17.71 | |||||
| pseudo R2 | 0.81 | |||||
| Variables | Coef. | Robust Std. Err. | P>z | [95% Conf.interval] | ||
| BID | -0.014812 | 0.003363 | 0.000*** | -0.008221 | -0.0214 | |
| Constant(C) | 2.03519 | 0.363322 | 0.000*** | 2.74729 | 1.32309 | |
| Wald chi2(1) | 19.4 | |||||
| Prob > chi2 | 0.000*** | |||||
| Log pseudo-likelihood | -95 | |||||
| Pseudo R2 | 0.88 | |||||
| Mean of WTP | US$3.62 |
Table 3: Estimated coefficients of the probit model. Note: ***, ** and *, significant at 1%, 5% and 10% level of significance, re
| S.no | Districts | Total households (a) | % of zero in each district (b) | Expected households to have zero (c=a*b/100) | Expected households with valid responses (d=a-c) | Mean (WTP) (e) | Aggregate benefit ( money) (f=d*e) |
|---|---|---|---|---|---|---|---|
| 1 | Addis ketema | 31,752 | 1.98 | 629 | 31,123 | US$3.62 | US$112,666.38 |
| 2 | Tabor | 77,613 | 4.84 | 3,756 | 73,857 | US$3.62 | US$267,360.64 |
| 3 | Hyke Dari | 30,958 | 1.93 | 597 | 30,361 | US$3.62 | US$ 109,905.05 |
| 4 | Tula | 1,40,531 | 8.76 | 12,311 | 1,28,220 | US$3.62 | US$464,158.15 |
| Mean | US$3.62 | US$954,090.23 |
Table 4: Aggregate Economic Benefit. Source: Own computation (2020).
Discussion
Descriptive Analysis
Respondents who showed interest to contribute money for catfish species conservation were 82.5% since there was the problem of: contamination of water in the Lake by different industries, decrement of a catfish species population in the Lake, and lack of proper management of the Lake. Respondents had unwilling to contribute money for catfish species conservation were 17.5%. The main reasons given for this were: (a) proper management is the responsibility of the government, (b) lack of money to pay (poverty), and (c) satisfaction with the current situation.
Econometric Analysis
Factors affecting willingness to pay for catfish species conservation: The results of the probit model were subjected to post estimation test using marginal effect analysis to estimate the trivial change from each factor that influences willingness to pay. Quantification of the marginal effects of these variables is vital to estimate the change that will occur for a change in one unit of that variable. Accordingly, the model results for each significant variables were discussed as follows:
Training on fish conservation: The coefficient for the training on fish conservation had a statistically significant and positive relationship with willingness to pay at 1% significant level. This is consistent with the prior expectation that those respondents who are well trained in fish conservation were more willing to pay than those who didn’t have training on fish conservation. A positive effect of this variable suggested that well-trained respondents are more likely to be efficient in resource allocation, practical use of modern techniques, adoption of improved aquaculture production practices, and use inputs in the right way. The marginal effect result implies that well-trained respondents have a probability of willing to pay which is 8.94×10⁻³ % greater than those respondents with no fish conservation training. This result implied that investing in the training of respondents is an important mechanism of conservation of catfish species. The result has similar users [18, 21, 22] who understand what the resource is, have a greater appreciation of its importance, and are willing to pay more for conservation.
The distance of respondent’s home from Lake: The coefficient for distance from respondent’s home to the Lake was found to be the expected sign, negative and it is significant at 10% level. This implies that increased distance from the Lake makes the respondents unwilling to contribute to the catfish species conservation program and vice versa. This is because respondents who are at a relatively farther distance from the Lake are assumed to get less access to the fish product as compared to the closer ones and less responsible for managing the catfish. The marginal effect of distance of respondent’s home from Lake implies that as other factors held constant, the distance respondent’s of home from Lake increase by one minute, their probability of willing to pay also decrease by 1.31×10⁷%. This result is in line with the works of Ramanathan B and Belete Z, et al. [22, 23] whereby willingness to pay for conservation decreases as households gets farther away from the resources.
Experience of respondents: The result of the model showed that fishing experience is positively, and significantly at 5% correlated with willingness to pay for the proposed hypothetical catfish species conservation program. The marginal effect result shows that for each additional increase in the year of experience of the respondents, the probability of the willingness to pay for the catfish species conservation will increase by 7.66×10⁻⁷ %. The reason for this might be that respondents who have started fishing earlier might have developed good knowledge about the trend of the fishing production system. This is inlined with CSA [25] who reported that fishing experience is positively and strongly significant to the willingness to pay for Lake management.
Land size of respondents: Respondent’s land size was found to be a significant variable at 1% with an expected negative sign. The marginal effect of land size implies that as other factors held constant when the respondent’s landholding size increase by one hectare, their probability of willingness to pay decreases by 1.22×10⁻⁵ %. As land size increases, willingness to pay for catfish species conservation may decrease; because they are maybe getting more benefit from their land than the fishery. The result is in line with Nigus HY and Assefa M, et al. [19, 24] who reported that land size had a negative influence on willingness to pay for conservation activities.
Total income of respondents: Total income is also a significant variable at a 1 % level of significance and has an expected positive sign. As the income of respondents increases, their willingness to pay will also increase. The marginal effect showed that when the income raises by one US dollar the probability of willingness to pay for conservation increases by 2.33×10⁻⁸ %, other factors remain constant. The implicationis that as the income of the respondent increase, the paying power will also be increased. The result is consistent with Belete Z and Satyanarayana K, et al. [23, 26] who reported that respondents with higher yearly income were more likely to contribute the first bids than households with lower income.
Estimation of mean willingness to pay and aggregate economic benefit: The estimated mean willingness to pay for catfish species conservation of Lake Hawassa was 3.62 US$ per year. Thus, 3.62 US$ estimated from the first equation was used in this study to estimate the mean willingness to pay. From a total of the targeted 256,280 households, the aggregate economic benefit was 954,090.23US$.
Conclusion
The objective of this research was to give a quantitative estimate for the conservational value of catfish species to help planners and decision-makers expanding in the input from economic valuation by presenting a sound valuation technique and process to accept the best possible approach towards sustainable catfish species conservation. From the total of 200 respondents, 82.5% of respondents showed interest to contribute money for catfish species conservation and 17.5% of respondents had not been interested to contribute money for catfish species conservation. The study identified the determinants of willingness to pay from the response’s point of view. In doing so, the contingent valuation method and probit model were applied to estimate respondent’s willingness to pay for catfish species conservation and identified factors that affect catfish species conservation respectively. The point estimates of mean willingness to pay for catfish species conservation of Lake Hawassa were found to be 3.62US$ and the aggregate economic benefit was 954,090.23US$.
The result from the probit model showed that training on fish conservation, the experience of respondents, and the total income of respondents were among the significant and positive variables that affected respondent’s willingness to pay for catfish species conservation. On the other hand, the distance of respondent’s home from Lake and land size of respondents had a negative sign and were significant variables. These results support the argument for using economic instruments to promote the conservation of catfish species.
Recommendations
Depending on the results of this research, the following more refined recommendations could be delivered: The result of the research indicated that communities were largely concerned and were willing to pay for the conservation of catfish species. Therefore, any program designed to conserve the catfish species should consider a joint community involvement for its successful implementation. By making the communities the participant and direct beneficiary from the Lake, it is possible to conserve the catfish species.
So, awareness creation and training are recommended to be given to the communities on efficient conservation of catfish species and recreational areas through shared efforts of all stakeholders. Programs which are presented in the hypothetical market scenario are recommended to be implemented with the collaboration of the different stakeholder and community to sustainably conserve the catfish species.
References
-
FAO (2013) Fish consumption in Somalia. CAADP Work- shop. Information for better livelihoods. The European Commission Swiss Agency for development and cooper- ation (EU-SDC) donor’s technical partner report. Fisher- ies and Aquaculture Department of food and agriculture organization of the United Nations, Rome, Italy, pp: 4-6.
-
WB (Worldbank) (2013) Prospects for Fisheries and Aqua- culture, pp: 1-102.
-
Anderson JL, Asche F, Garlock T, Chu J (2017) Aquaculture: Its role in the future of food. In Frontiers of Economics and Globalization: 17: 159-173.
-
Cai J, Huang H, Leung PS (2019) Understanding and measuring the contribution of aquaculture and fisheries to gross domestic product (GDP). FAO Fisheries and Aquaculture Technical Paper 606: 1-83.
-
EEP (2015) Agriculture in Ethiopia. The free encyclope- dia.
-
FAO (2012) The State of the World Fisheries and Aqua- culture, pp: 230.
-
Global Fish Alliance (2010) The importance of capture fisheries in food security in Ethiopia. Fact sheets on the state of fisheries in African countries.
-
Assefa MJ **(**2014) Fish production, consumption, and management in Ethiopia. Janko Int J Econ and Manage 3(3): 1-6.
-
FAO (2016) The State of World Fisheries and Aquaculture. Contributing to food security and nutrition for all. Rome, pp: 204.
-
SNNPR MS (2020) SNNPR of Meteorological service center of five years report.
-
HCAO (2020) Hawassa City Agricultural Office annual report.
-
Elias D (2000) Reproductive biology and feeding habits of the catfish Clarias gariepinus (Burchell) (Pisces: Clari- idae) in Lake Hawassa, Ethiopia. Ethiopian journal of sci- ence 23(2): 231-246.
-
Yemane G (2004) Assessment of the Water Balance of Lake Hawassa Catchment. The International Institute for Geo-information Science and Earth Observation, ITC, Netherlands, pp: 1-103
-
EFASA (2013) Annual Report of the European Food Safety Authority for 2013.
-
Haab TC, McConnell KE (2002) Valuing Environmental and Natural Resources. The Econometrics of Non-Market Valuation. Edward Elgar Publishing, pp: 352.
-
Bandara R, Tisdell C(2002) Willingness to Pay for Conservation of the Asian Elephant in Sri Lanka. A Contingent Valuation Study. A Working Paper in Economics, Ecology, and Environment.
-
Bantie Y (2011) The value of Improved Water Supply in Mota Town, East Gojjam, Ethiopia, Application of Contingent Valuation Method (CVM). Master thesis, Addis Abeba University.
-
Etensa T (2014) Economic Valuation of Conservational Benefits of Natural Wetland Ecosystem Values. LAP LAMBERT Academic Publishing.
-
Nigus HY (2014) Household’s Willingness to Pay for Camel Milk in Aba’ala Woreda, Afar Regional State. Master Thesis, Mekelle University, pp: 1-126.
-
Berhan A, Birhanu B, Misikire T, Afework K, Biniam G, et al. (2016) Estimating Willingness to Pay for Labeobarbus Fish Species Conservation in Lake Tana, Ethiopia: A Contingent Valuation Study. International Journal of Natural Resource Ecology and Management 1(4): 155- 161.
-
Haroyu Y, Bayeh M, Wolle H (2016) Valuation of Environmental Goods and Services: The case of Bale Mountain National Park, Ethiopia. African Journal of Economics and Management 4(3): 266-277.
-
Belete Z, Assefa Y (2001) Willingness to Pay for Endangered Environment. The case of Nechsar National Park, pp: 1-29.
-
Binilkumar AS, Ramanathan A (2007) Valuing stakeholder preferences on improved conservation and management of Kol wetland: A contingent valuation study, pp: 1-29.
-
Assefa M, Lemma Z (2015) Fisher Man’s Willingness to Pay for Fisheries Management. The Case of Lake Zeway, Ethiopia. Journal of FisheriesSciences 9(4): 016-022.
-
CSA (2007) Administrative Boundaries Census Report: Addis Ababa, Ethiopia.
-
Satyanarayana K, Tadesse B **(**2014) An Analysis of Eco- nomic Valuation through Contingent Valuation Method in Semien Mountains National park (SMNP), Ethiopia. International Journal of Innovative Research and Devel- opment 3 (13): 1-8.
- Genetic Improvement of Nile Tilapia (Oreochromis niloticus): Advances in Selective Breeding and Genomic Approaches for Sustainable Aquaculture
- Microplastics, Contaminants, and Waste Hotspots: Divergences and Faults in Prioritizing Control Efforts
- Creating a Healthier, More Vibrant Open and Closed Aquatic Environment. A Submersible, Centrifugal Magnetically Affixed Current Changing Aquarium Pump
- An Attempt to Assess Alpha Diversity and Sample Size: Using the Ostracod Assemblages off Kumamoto Port, Japan
- Assessment of the Efficiency of Common Fishing Gears and Crafts Used at Mohananda River of Chapai Nawabganj, Bangladesh
- Fish Productivity and Biodiversity Status of Sundarban Mangrove in Bangladesh