Effect of Phyto-Additive Allium Sativum in Feed on Survival Rate and Growth Performance of Post-Juvenile Clarias Gariepinus
The study on the effect of the supplementation of Allium sativum in feed on the survival rate and growth characteristics of postjuveniles of Clarias gariepinus, was carried out over 150 days at the Massoma fish farm located in the Douala 4th Subdivision, Cameroon (04° 03’- 04° 07’ LN and 09° 37’- 09° 41’ LE). The objective was to contribute to a better intensive production of Clarias gariepinus using feed additive. For this purpose, 750 post juveniles of C. gariepinus (375 males and 375 females) with a mean initial weight of 80 ± 1g and a mean total length of 22.51 ± 1.33 cm were divided into five batches, each representing a treatment and corresponding to a ration which was repeated 3 times. The rations noted R0 ; R3,5 ; R4 ; R4,5 and R5 respectively corresponded to supplementation rates of 0; 3.5; 4; 4.5 and 5% of Allium sativum in the feed. Fish were fed twice a day at 3% of the ichthyo biomass and readjusted each month after the control fishery. Following the latter, growth characteristics were also recorded each month. The results obtained were as follows: the survival rate varied from 72.00 ± 3.06 to 89.33 ± 3.79% with the highest value significantly (p<0.05) with the ration supplemented with 4.5% A. sativum. Regarding growth characteristics, they were significantly (p<0.05) affected by the supplementation rate of A. sativum. The highest average food consumption (793.55 ± 67.92g) was recorded with R5 and the lowest (603.74 ± 38.92g) with the R0 ration. The highest total length (43.42 cm) was obtained in males from the R5 treatment and the lowest (39.56 cm) with females fed with 0% A. sativum. The highest weight gain (715.60 ± 87.80g), mean daily gain (4.77 ± 0.59g) and specific growth rate (1.52 ± 0.07% g / d) were recorded in males with the R5 ration and the lowest in females fed with R0. The highest K factor (0.97) was obtained in females of R3.5 and in both sexes of R4.5. The highest protein efficiency coefficient (1.92 ± 0.09) was observed in males from the R5 treatment and the most reliable (1.60 ± 0.20) with females from R0. The lowest consumption index (1.18 ± 0.08) was recorded with the R5 ration and the highest (1.37 ± 0.17) with the R0 ration. This study reveals that the supplementation rate of 5% of A. sativum in the food of post juveniles of C. gariepinus is better on the survival rate and growth.
Introduction
The assessment of commercial fish stocks indicates that the proportion fished at a biologically sustainable level has decreased from 90% in 1974 to 68.6% in 2013 [1]. Estimates show that 31.4% of fish stocks are therefore overexploited [2]. The attainment of the maximum yield point of fishery was confirmed in 2014, when the contribution of the aquaculture sector to fish supply intended for human consumption exceeded for the first time that of the fishing sector [2]. Globally, per capita apparent fish consumption has increased from an average of 9.9 kg in the 1960s to 14.4 kg in the 1990s and 19.7 kg in 2013 [3]. This global per capita consumption of fish has reached 20.3 kg, thanks to the strong growth of aquaculture, which now provides half of the fish intended for human consumption [2]. This upward trend is expected to be maintained to reach a figure of 21.5 kg per capita by the year 2030 [4]. Hence there is need to take a strong interest in this activity. However, the development of aquaculture in Cameroon is based mainly on five species, including Clarias gariepinus because of its high zootechnical potential (diversified diet, rapid growth, very popular flesh and resistance to diseases) compared to other fish species [5, 6, 7]. However, its breeding still faces several difficulties, including the lack of highly performant local market, low-cost feed for fish farmers; the insufficient quality and quantity of fry and the high costs of imported feed [8, 9]. The benefit of intensive aquaculture is closely linked to the reduction in the cost of production [10, 11] because feed represents the main cost (55-60%) of aquaculture. Hence the need to put an emphasis on the valuation of our ingredients by combining phyto- biotics (additives of plant origin) such as Allium sativum found in our environment, in order to solve the problems related to the high cost of fish feed. This food additive is locally available and natural, inexpensive and harmless to animals, humans and the environment. These additives not only have the ability to strengthen the immune system [12, 13], but also to stimulate growth thanks to the presence of allicin in most of them and their antioxidant properties. Supplementing garlic in the diet of fish may improve growth. However, the optimal rate that could produce the best zootechnical results is not yet known. It is with this in mind that this work was initiated with the general objective of contributing to the improvement of the productivity of Clarias gariepinus through the use of Allium sativum powder as feed additive. More specifically, evaluate the effect of the incorporation of Allium sativum on the survival and the characteristics of the growth of the post-juveniles of Clarias gariepinus (food consumption, total lengths, weight gain, consumption index, specific growth rate, condition factor K and Protein Efficiency Coefficient).
Materials and Methods
Study Area
This study took place at the Massoma fish farm located in the Douala 4th Subdivision, Wouri Division, Littoral Region Cameroon with the following geographical coordinates: 04° 03 ‘- 04° 07’ of Latitude North and 09° 37’- 09° 41 ‘East Longitude. This area is located at an average elevation of 7 m above sea level [14]. The climate of the city of Douala is of the “Cameroonian” type, very humid and hot (22 and 29°C), a variant of the equatorial climate.
Animal and Plant Material used During the Study
A total of 750 post juveniles of Clarias gariepinus, or 375 males and 375 females with a mean initial weight of 80 ± 1g and a mean total length of 22.51 ± 1.33cm were used for the experiment. These fish were obtained through artificial reproduction and pre-grown on site on the farm and then sexed for the study. They were acclimatized in fastanks for 2 weeks and fed a food consisting of three ingredients: fishmeal, soybean meal, wheat bran [15] until the start of the trials. Allium sativum in the feed was purchased from local market in the city of Dschang, West Region of Cameroon, then oven-dried at 50 ° C for 5 days, and machine ground.
Breeding Structure
The breeding took place in 15 fastanks of 0.343 m3 (0.7 x 0.7 x 0.7 m) each with a useful volume of 0.30 m3. Each fastank was equipped with a water supply device and a Ø 32 mm pressure hose overflow which also served as a drain and made it possible to maintain a constant head of water in the tanks. At the bottom of each fastank, was installed a circular basin for the collection of refusals. These basins were placed vertically in a circular floating frame also placed on its surface with the water of each tank.
Experimental Rations
A basic ration without A. sativum (R0) titrating 45% protein was formulated (Table 1) and 4 other rations were obtained by adding respectively to the basic ration 3.5%; 4%; 4.5% and 5% Allium sativum powder. The by-products used were purchased from the BELGOCAM Company, in order to ensure their traceability. The mixing went as it follows; ingredients of smaller mass were mixed with those of larger mass and gradually until a homogeneous mixture was obtained. Then water was added (2 liters for 10 kg of food) to make a paste. The formulated and wet foods were granulated from a granulator 0.3 and 0.4 cm in diameter; then dried in the sun for 6 hours. The granules were stored in opaque bags. The bromatological compositions and nutritional values of the different rations are shown in Table 1.
| Ingredients | Quantite (kg) |
|---|---|
| Corn | 8 |
| Cassava flour | 3 |
| Cotton cake | 3 |
| Soybean meal | 35 |
| Blood meal | 5 |
| Fish meal | 40 |
| Bone meal | 1 |
| Palm oil | 3 |
| Premix | 2 |
| Total | 100 |
| Centesimal chemical composition | |
| PB (%) | 45.59 |
| ME (kcal / kg) | 3106.82 |
| Ca (%) | 3 |
| P (%) | 1.72 |
Table 1: Experimental ration for the post juveniles of _Clarias_ _gariepinus_. Rations: • R0 = basic ration (control) • R3.5 = ba
Conduct of the Experiment
The experiment took place in 15 fastanks of 0.30 m3 of water volume each, into which were introduced five batches of post juveniles (50 individuals therefore 25 males and 25 females per fastanks) comparable in terms of size and weight. These five lots corresponded to the rations of R0; R3.5; R4; R4.5 and R5. Each of the treatments was repeated 3 times. During the test period, the animals were fed 3% of their ichthyo-biomass daily [16, 17]. However, the daily rations were split into two meals each and distributed at fixed times (7 am-8am and 5pm-6pm). The food adjustment was made after each control fishing (every month) and food refusals were also collected every two days using a basin placed at the bottom of the tanks and vertically on a frame floating on the surface water which was intended to direct the unconsumed food into the basin. Thus, these refusals were dried in the sun to constant weight and then weighed to estimate food consumption. Control fishing was carried out monthly using a dip net with a mesh size of 1cm. During the control fishing, 60% of individuals (males and females) were taken at random from each tank for measurement (total and standard lengths) using an ichthyometer with 1 mm precision then weighed individually using an SF-400 brand electronic scale with a precision 1g and a capacity of 10000g [18]. At the end of the trial, all the fish were counted, weighed and measured.
Parameters and Characteristics Studied
Survival rate = (Initial number of fish-mortality) X100 / (Initial number of fish).
- Growth Characteristics
- Food Consumption (g) = Quantity of food served - Refused
- Total Length Gains (TLG) = initial total length - final total length
- Weight Gain (WG) = Final weight-initial weight
- Average Daily Gain (ADG) = (Final weight - initial weight) / Time (number of days)
- Specific Growth Rate (SGR) = ((ln final weight – ln initial weight) X100)) / (Time (number of days) ; ln = neperien logarithm
- Consumption Index (CI) = Quantity of food consumed / (Final Weight-Initial weight)
- Condition Factor K = (W / LT 3) x 100 (Ricker, 1975) W = Weight (g) LT = Total length (cm)
- Protein Efficiency Ratio (PER) = Weight Gain / (Protein Ration Consumed)
Statistical Analyses
One-way ANOVA was used to test the effect of the rate of Allium sativum incorporation on survival and growth characteristics. When there were significant differences between the means, they were separated by Duncan’s test at a 5% significance level. SPSS 21.0 statistical software was used for this purpose.
Results
Effect of Allium sativum on the Survival Rate of Post-juvenile Clarias gariepinus at Grow-out
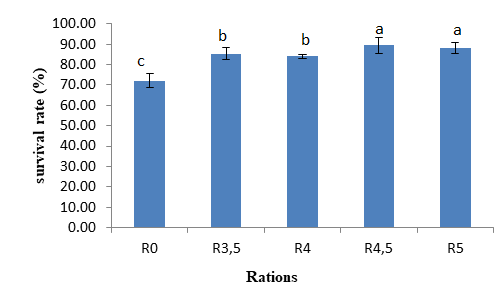
The influence of the incorporation of Allium sativum on the survival rate of Clarias gariepinus as shown in Figure 1 shows that the highest survival rate (89.33 ± 3.79%) was obtained with the ration R4,5 which is also significantly (p <0.05) comparable to that of R5 (88.00 ± 2.65%) and the lowest (72.00 ± 3.46%) with the ration R0.
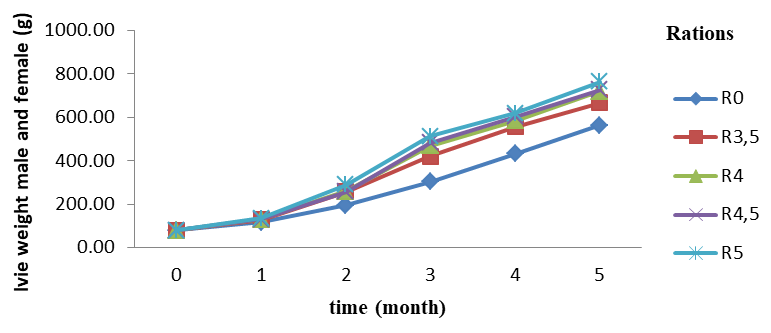
Like food consumption, the live weight of the subjects was highly variable between sexes and between individuals of the same sex (Table 2). The highest body weight was recorded with the R5 treatment (763.40 ± 88.86g) followed by R4.5 (727.17 ± 100.62g) otherwise significantly comparable (p <0.05) and the lowest with R0 (563.68 ± 65.65g). Taking sex into account, the highest live weight value was observed in males fed with feed containing 5% additive (774.16 ± 88.37g) followed by R4.5 (740, 60 ± 100.73g) and the lowest (554.68 ± 65.52g) was recorded in females fed at R0. The shape of the fish weight evolution curves as shown in Figure 3 is identical regardless of the ration, with a linear trend throughout the test period. However, the weight curve of individuals fed with the R5 ration was higher throughout the study.
As for the total length (Table 2), it was significantly higher (43.57 ± 1.67 g) in the fish fed with R5 followed by those of R4.5 (42.17 ± 1.67g) and the lowest with R0 (39.83 ± 1.94g). Considering sex, significantly longer individuals (44.38 ± 1.18 cm) were observed with males of the R5 treatment followed by those of the same sex of R4.5 (42.91 ± 1.38 cm).
The shortest length (38.93 ± 1.71 cm) was recorded with the females of R0.
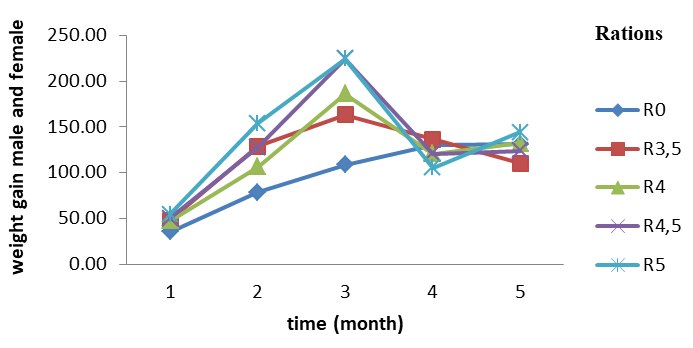
The weight gains as presented in Table 2 shows the highest value (683.40 ± 88.69g) significantly (p<0.05) were obtained from individuals fed the food at the highest rate of incorporation (5%) followed by those of R4.5 (647.17 ± 100.33g) and the lowest with R0 (461.13 ± 69.10g). Depending on sex, males fed with the ration incorporated with 5% A. sativum were significantly larger (715.60 ± 87.80g) followed by individuals of the same sex of R4.5 (685.07 ± 98.03g) but the lowest gain was obtained with the females fed with the R0 ration (409.60 ± 50.13g). The same trend was observed with the average daily gain where the highest value (4.56 ± 0.59g) was recorded with the ration R5 and the lowest with R0 (3.07 ± 0.46g) regardless of either the factor considered. The evolution curve of weight gain as a function of the incorporation rate as shown in Figure 4 shows an increasing trend with all treatments during the first three months of the study. However, the weight of individuals on R5 treatment remained higher during this period. However, between the 3rd and 4th month, a decrease in weight gain was recorded regardless of the ration. On the other hand, during the last month, the curves resume a slight increase with the exception of that of R3.5.
| Growth characteristics | Incorporation rate (%) | |||||
|---|---|---|---|---|---|---|
| R 0 | R 3,5 | R 4 | R 4,5 | R 5 | P | |
| CA (g) | 603.74±38.92 e | 748.35±46.41 d | 753.29±58.83 c | 755.85±65.27 b | 793.55±67.92 a | 0 |
| LW(g) | ||||||
| ♀ | 521.27±58.39 c | 615.93±69.91 b | 631.33±59.39 b | 689.07±90.83 a | 730.80±79.85 a | 0 |
| ♂ | 606.53±40.30 c | 718.60±70.67 b | 715.07±57.45 b | 765.27±98.05 ab | 796.00±87.76 a | 0 |
| ♂♀ | 563.90±65.65 c | 667.27±86.58 b | 673.20±71.48 b | 727.17±100.62 a | 763.40±88.86 a | 0 |
| TL (cm) | ||||||
| ♀ | 38.93±1.71 d | 40.19±1.70 c | 40.49±2.03 c | 41.43±1.63 b | 42.75±1.72 a | 0 |
| ♂ | 40.73±1.76 c | 42.91±1.02 b | 42.31±1.67 b | 42.91±1.38 b | 44.38±1.18 a | 0 |
| ♂♀ | 39.83±1.94 c | 41.55±1.95 b | 41.40±2.05 b | 42.17±1.67 b | 43.57±1.67 a | 0 |
| WG (g) | ||||||
| ♀ | 409.60±50.13 d | 551.33±49.12 c | 551.67±59.04 c | 609.27±90.36 b | 651.20±79.78 a | 0 |
| ♂ | 512.67±41.07 e | 651.53±52.65 d | 634.73±57.69 c | 685.07±98.03 b | 715.60±87.80 a | 0 |
| ♂♀ | 461.13±69.10 d | 601.43±71.41 c | 593.20±71.23 c | 647.17±100.33 b | 683.40±88.69 a | 0 |
| ADG (g) | ||||||
| ♀ | 2.70±0.33 d | 3.68±0.33 c | 3.68±0.39 c | 4.06±0.60 b | 4.34±0.53 a | 0 |
| ♂ | 3.41±0.27 e | 4.34±0.35 d | 4.23±0.38 c | 4.57±0.63 b | 4.77±0.59 a | 0 |
| ♂♀ | 3.07±0.46 d | 4.00±0.48 c | 3.96±0.47 c | 4.31±0.67 b | 4.56±0.59 a | 0 |
| CI | 1.37±0.17 a | 1.28±0.11 b | 1.29±0.07 b | 1.20±0.09 c | 1.18±0.08 c | 0 |
| SGR (%g/j) | ||||||
| ♀ | 1.21±0.07 d | 1.38±0.05 c | 1.38±0.06 c | 1.43±0.08 b | 1.48±0.07 a | 0 |
| ♂ | 1.33±0.05 c | 1.47±0.05 b | 1.46±0.06 b | 1.50±0.09 a | 1.52±0.07 a | 0 |
| ♂♀ | 1.27±0.09 d | 1.43±0.07 c | 1.41±0.09 c | 1.47±0.09 b | 1.50±0.08 a | 0 |
| K | ||||||
| ♀ | 0.84±0.14 b | 0.97±0.06 a | 0.95±0.08 a | 0.97±0.11 a | 0.94±0.09 a | 0.02 |
| ♂ | 0.88±0.11 b | 0.92±0.05 b | 0.95±0.09 a | 0.97±0.12 a | 0.91±0.05 b | 0 |
| ♂♀ | 0.86±0.12 b | 0.95±0.06 a | 0.95±0.09 a | 0.97±0.11 a | 0.92±0.07 a | 0.01 |
| PER | ||||||
| ♀ | 1.60±0.20 c | 1.71±0.16 b | 1.69±0.09 b | 1.83±0.13 a | 1.86±0.12 a | 0 |
| ♂ | 1.69±0.18 c | 1.78±0.10 b | 1.76±0.09 b | 1.91±0.12 a | 1.92±0.09 a | 0 |
| ♂♀ | 1.65±0.20 c | 1.75±0.14 b | 1.73±0.09 b | 1.87±0.13 a | 1.89±0.11 a | 0 |
Table 2: Growth characteristics of _Clarias gariepinus_ with respect the rate of feed incorporation with _Allium sativum._ a, b a
Table 2: Growth characteristics of Clarias gariepinus with respect the rate of feed incorporation with Allium sativum. a, b and c: the means with the same lowercase letters on the same line are not significantly different (p> 0.05). CA = Food consumption, LW= live weight, TL = total length, WG= weight gain, ADG = average daily gain, SGR= Specific growth rate, CI = Consumption index, K = Condition factor, PER = protein efficiency ratio, p = probability.
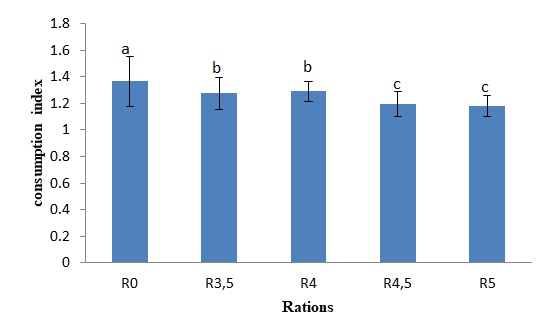
The consumption index as shown in Figure 5 was significantly affected by the rate of incorporation. Thus, the lowest value (1.17 ± 0.07) of the index was recorded in the batch which received the ration with 5% of A. sativum followed by that of R4.5 (1.12 ± 0, 09), moreover significantly comparable (p<0.05) and the higher value (1.37 ± 0.19) was obtained with the batch which received 0% ration. This characteristic tends to decrease with the rate of incorporation in the ration.
Regarding the specific growth rate, the significantly lower value was obtained with the R0 ration (1.27 ± 0.09%g/d) and the highest with R5 (1.50 ± 0.08%g/d) depending on sex and ration (Table 2). When sex is taken into consideration, the males in the R5 ration recorded the significantly higher rate (1.52 ± 0.07%g/d) followed by R4.5 (1.50 ± 0.09%g/d) and the lowest (1.21 ± 0.07%g/d) with the females of R0. The evolution of the growth rate of C. gariepinus post juveniles fed at different rations according to the level of incorporation (Figure 6) shows that, whatever the treatment, the specific growth rate showed a regular increase in the onset of study until the second month, before decreasing over time until the end of the test. However, this decrease was more rapid in batch R5 (5% of A. sativum), then in batches containing 3.5 and 4.5% of A. sativum respectively. In contrast, the batch containing 0% A. sativum was higher from the 4th month until the end of the study.
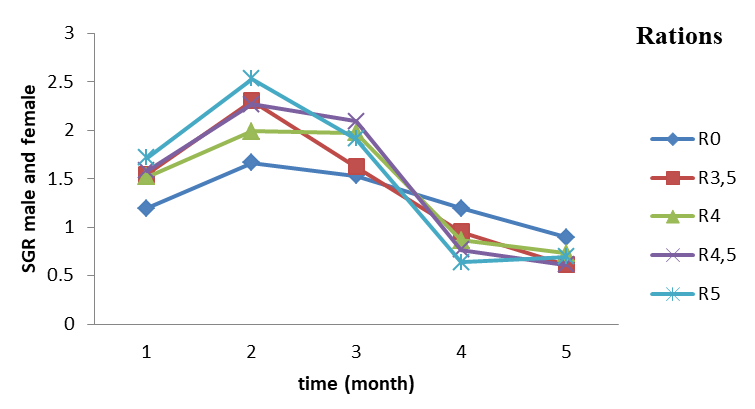
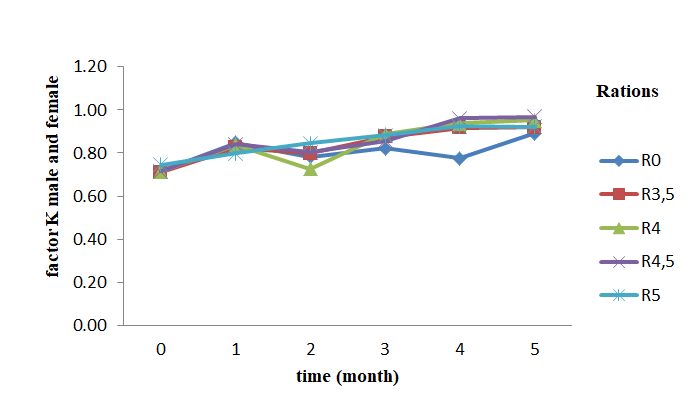
Figure 6: Evolution of the specific growth rate of C. gariepinus post juveniles fed on rations according to the level of incorporation of A. sativum. R0-R5: Rations containing respectively 0; 3.5; 4; 4.5 and 5% Allium sativum The condition factor K remained significantly comparable between the R3.5 treatments R4; R4.5 and R5 throughout the test regardless of the incorporation rate of A. sativum and the sex considered with the exception of the R0 ration. However, according to sex, the highest values (0.97) were recorded with females (rations R3.5 and R4) and males of R4. Moreover, as shown in Figure 7, the change in factor K with the different treatments as a function of time increased steadily from the start to the end of the study, with the exception of the R0 treatment, which showed a saw tooth evolution then, a slight increase during the last month.
Regarding the protein efficiency ratio, it emerges that the highest value (1.89 ± 0.11) was recorded with the ration containing 5% of A. sativum in the feed followed by that R4,5 (1.87 ± 0.13) otherwise significantly comparable, the lowest was obtained with R0 (1.65 ± 0.20). Taking sex into account, the males of the R5 (1.92 ± 0.09) and R4.5 (1.91 ± 0.12) rations recorded the highest efficacy coefficients significantly followed by the males of R3.5 (1.78 ± 0.10) and R4 (1.76 ± 0.09) and the lowest value was observed in females of R0 (1.60 ± 0.20).
Discussion
The survival rate being the ability of fish to resist death with respect to breeding conditions [19] was generally significantly affected with the phyto-additive A. sativum in the feed. This rate ranged from 72.00 ± 3.46 to 89.33 ± 3.79%. This result is very close to that obtained by Nyadjeu, et al. [20]respectively from 72.33 ± 3.2% to 83.67 ± 5.13% with feed incorporated with 0.5% and 1% garlic - ginger mixture on C. gariepinus larvae reared for 63 days. However, it was higher than the 50.77 to 72.71% results obtained by Agbebi, et al. [21] in C. gariepinus fed on food incorporated with 1 to 3% of A. sativum. This difference could be due to the cannibal nature of this species at this size because these authors used fry with an initial weight of 3.90 ± 0.02 g at the start of their study and the high level of A. sativum in our food having a very high capacity to strengthen the immune system. However, this result is lower than those (96 to 99%) obtained by Labrador, et al. (2016) [22] in Litopenaeus vannamei fed on food incorporated with the same additive (2 to 6%). This could be due to the difference in the genetic material used because. Survival rate also depends on the species because there are naturally weak species of all these studies, treatments without additives recorded a low survival rate unlike those incorporated. This is explained by the biochemical properties of garlic which improve the resistance of fish to diseases and farm stress.
The results obtained on growth characteristics indicated that food consumption, body weight, weight gain, mean daily gain, specific growth rate, consumption index and protein efficiency coefficient of fish fed with the feed containing various levels of additive Allium sativum were significantly (p <0.05) higher than those of the fish that did not receive the additive. This result indicates that the phyto-additive not only promotes appetite, but also stimulates the growth of fish that consumed it. This can be justified by the presence of allicin, antioxidants present and other substances such as sulfur compounds and flavonoids provided by A. sativum and which were well assimilated by post juveniles of C. gariepinus. These results recorded on the growth characteristics are similar to those of Nyadjeu, et al. Agbebi, et al. and Labrador, et al. [20, 21, 22]. Therefore, the animals were fed with feed containing the same phyto-additive. This means that garlic can be used as a growth inducer in aquaculture. In addition, the work of Nya and Austin [23] in rainbow trout also showed a significant increase in growth following a diet incorporated with 0.5 and 1 g of garlic for 100g of food compared to the control group. The values of the condition factor K indicate that fish overweight was comparable (p <0.05) between the treatments except for that of R0. In fact, the K factor obtained in C. gariepinus during this study was between 0.70 and 0.96. These values are similar to that reported by Rukera, et al. [24] (0.79 to 0.83) with juveniles of the same species reared at several densities and fed with a complete feed. All the same, these results are superior to those (0.06 to 0.74) reported by Ekoué [25, 26] with C. gariepinus. But this difference can be linked to the poor values of the physico- chemical characteristics of the water recorded in this farm.
Regarding the protein efficiency coefficient, it emerges that the highest value was recorded with the ration containing 5% of Allium sativum followed by R4.5 and the lowest was obtained with R0 whatever the gender and/or the incorporation rate considered. These values obtained show the best protein conversions for fish fed on rations incorporated with the additive compared to the treatment without additive R0, which would confirm the action of active bio-compounds which have the capacity to stimulate digestion but also to improve absorption and storage of nutrients. The bioactive compounds have had beneficial effects on the intestinal flora resulting in improved digestion. This therefore indicates that the use of garlic in the diet of C. gariepinus post juveniles would improve nutrient utilization. These results corroborate those reported by Abraham, Ritu, [12] following his work which shows that garlic incorporation up to 10 g / kg of feed significantly improves the feed conversion rate of fish.
Conclusion
This study investigated the effect of incorporation with Allium sativum in food on the survival rate and growth characteristics of Clarias gariepinus. It appears that the highest level of incorporation (5%) resulted in the best protein growth, survival and efficiency performance.
Recommendation
On the basis of the results obtained, for a marked improvement in production, we recommend practically that producers incorporate 5% Allium sativum powder in the feed of post juveniles of Clarias gariepinus when growing them.
Perspective
We plan to devote our future research to the determination of the effect of incorporation of Allium sativum in feed on the biochemical composition of the carcass, the organoleptic quality and on some reproductive parameters of Clarias gariepinus.
Acknowledgement
The authors would like to specially thank the management of the ‘’Massoma fish farm’’ for the facilities they received during their stay in the structure.
References
-
FAO (2015) La pisciculture assurera près des deux tiers de la production mondiale de poisson d’ici 2030, pp: 2.
-
FAO (2016) La situation mondiale des pêches et de l’aquaculture ; Département de Pêches et Aquaculture. FAO (Ed), Rome (Italie), pp : 1-227.
-
FAO (2013) Grassland Index. A searchable catalogue of grass and forage legumes.
-
FAO (2018) La situation mondiale des peches et de l’aquaculture; Atteindre les objectifs de developement durable, pp: 1-254.
-
Pruszynski T (2003) Effects of feeding on ammonium excretion and growth of the African catfish (Clarias gariepinus) fry. Czech Journal of Animal Science 48(3): 106-112.
-
Wiecaszek B, Krzykawski S, Antoszek A, Kosik J, Serwotka P (2010) Morphometric characteristics of the juvenile North African catfish Clarias gariepinus (Burchell, 1822) from the heated water aquaculture. Electronic Journal of Polish Agricultural Universities (EJPAU) 13(2).
-
Ahotondji A, (2012) Renforcement des capacités nationales des petits producteurs dans la production intensive d’alevins de Clarias. Rapport Technique Définitif.
-
Moehl J, Brummett R, Kalende BM, Coche A (2006) Guiding principles for promoting aquaculture in Africa: benchmarks for sustainable development. CIFA Occasional Paper 28: 1-133.
-
Pouomogne V (2008) Capture-based aquaculture of Clarias catfish: case study of the Santchou fishers in western Cameroon. Capture-based aquaculture. Global overview 508: 93-108.
-
Hoffman LC, Prinsloo JF, Rukan G (1997) Partial replacement of fish meal witheit her soybean meal, brewers yeast or tomato meal in the diets of African sharptooth catfish Clarias gariepinus. Water SA, 23: 181- 186.). Science Agronomique Développement 4(1): 41- 47.
-
Tacon AGJ (1996) Feeding tomorrow’s fish. World aquaculture 27(3): 20-32.
-
Abraham TJ, Ritu R (2015) Effects of dietary incorporation of garlic (Allium sativum) extract on the resistance of Clarias gariepinus against Edwardsiella tarda infection, pp: 1-79.
-
Nwabueze AA (2012) The Effect of Garlic (Allium sativum) on Growth and Haematological Parameters of Clarias gariepinus (Burchell, 1822). Sustainable Agriculture Research 1(2): 7.
-
Njueya AK, Likeng JDH, Nono A (2012) Hydrodynamics and groundwater quality in the Douala sedimentary basin (Cameroon): case of aquifers on Quaternary and Tertiary formations 6(4): 1874-1894.
-
Lacroix E (2004) Pisciculture en zone tropicale, GFA Terra Systems. Eulenkrug straße Hamburg, Allemagne 82 (22): 1-231.
-
Hecht T, Uys W, Britz P (1988) The culture of sharp tooth catfish (Clarias gariepinus) in southern Africa. South African Natural Science Progress Report No 153: 1-146.
-
Ani AO, Okpako BA, Ugwuowo LC (2013) Effect of feeding time on the performance of juvenile african catfish (Clarias gariepinus, Burchell 1822). Online Journal of Animal and Feed Research 3(3): 143-148.
-
Tomedi-Eyango M, Tchoumboue J, et Jamtade O (2008) Effet du poids de mise en charge sur la survie et la croissance des fingerlings du poisson chat africain (Clarias gariepinus _;_ Burchell, pp: 1822.
-
Cacot P (2006) Contribution à amélioration de la production d’alevins au Cameroun: Essais de reproductions et d’élevage de nurserie avec Clarias gariepinus et deux autres espèces, pp: 1-65.
-
Nyadjeu P, Ekemeni RGM, Tomedi MET (2020) Growth Performance, Feed Utilization and Survival of Clarias gariepinus Post-Larvae Fed with a Dietary Incorporation of Zingiber officinale-Allium sativum Mixture. Journal of Aquaculture & Fisheries
-
Agbebi OT, Ogunmuyiwa TG, Herbert SM (2013) Effect of Dietary Garlic Source on Feed Utilization, Growth and Histopathology of the African Catfish (Clarias gariepinus). Journal of Agricultural Science 5(5): 9.
-
Labrador J RP, Guiñares RC, Hontiveros GJS (2016) Effect of garlic powder-incorporated diets on the growth and survival of Pacific white leg shrimp (Litopenaeus vannamei). Animal Husbandry & Veterinary Science Research Article, pp: 1-9.
-
Nya EJ, Austin B (2009) Use of garlic, Allium sativum, to control Aeromonas hydrophila infection in ainbow trout, Oncorhynchus mykiss (Walbaum). J Fish Dis 32(11): 963-970.
-
Rukera TS, Micha JC, Ducarne C (2005) Essais d’adaptation de production massive de juveniles de Clarias gariepinus en conditions rurales. Tropicultura 23(4): 231-244.
-
Ekoue CA (2013) Effets de la substitution de la farine de poisson par la farine des graines de Nere (Parkia biglobosa) et de la farine du tourteau de soja (Glycine maxima) sur la croissance et la survie des juvéniles de Clarias gariepinus (Burchell, 1822), pp: 42.
-
Pouomogne V (2008) Pisciculture en milieu tropical africain : Comment produire du poisson à coût modéré (des exemples du Cameroun).CEPID/coopération française, Presses Universitaires d’Afrique: Yaoundé, Cameroun, pp: 235.
- Genetic Improvement of Nile Tilapia (Oreochromis niloticus): Advances in Selective Breeding and Genomic Approaches for Sustainable Aquaculture
- Microplastics, Contaminants, and Waste Hotspots: Divergences and Faults in Prioritizing Control Efforts
- Creating a Healthier, More Vibrant Open and Closed Aquatic Environment. A Submersible, Centrifugal Magnetically Affixed Current Changing Aquarium Pump
- An Attempt to Assess Alpha Diversity and Sample Size: Using the Ostracod Assemblages off Kumamoto Port, Japan
- Assessment of the Efficiency of Common Fishing Gears and Crafts Used at Mohananda River of Chapai Nawabganj, Bangladesh
- Fish Productivity and Biodiversity Status of Sundarban Mangrove in Bangladesh