Monitoring Strategy for Analyzing the Impacts of Coastal Finfish Aquaculture on Seafloor Sediments in Indonesia
This paper presents the development of a simple and generally applicable monitoring strategy for analyzing the environmental impacts of near shore finfish aquaculture in Indonesia. The proposed strategy has been tailored for remote aquaculture sites and primarily comprises sediment sampling, analysis of the chosen sediment indicators, and statistical analysis. The investigations were performed at a target aquaculture site in the northwest of Bali, Indonesia. On-site assessments were conducted for sediment quality underneath the largest fish farms accounting for 80% of the site´s production and at pristine reference locations. In this study, the effectiveness of several sediment indicators for monitoring benthic impacts was investigated. As total organic matter was found to be an effective indicator for the site in Indonesia which could be determined using a simple and inexpensive method, it was recommended for regular monitoring. The monitoring strategy was successfully integrated into a methodology under development at Germany to holistically estimate the carrying capacity of aquaculture sites. The effectiveness of the strategy in optimizing the relationship between the predicted carrying capacities of individual fish farms and the results of on-site assessments at the reference farms was demonstrated. From the analysis results, fish farms affecting the site in Bali were identified and recommendations made to ensure environmental sustainability. The proposed monitoring strategy has wide applicability and is currently being up scaled to several target aquaculture sites by the Indonesian government.
Introduction
Coastal finfish cage aquaculture in Southeast Asia is in the early stages, and it is yet underdeveloped compared to other forms of aquaculture; however, it is rapidly expanding. Although culture sites offer excellent conditions, many aquaculture operations are adjacent to ecologically sensitive coral reefs, bordered by mangroves, and exposed to potential hazards. The spatial planning and siting strategies currently adopted in most Southeast Asian countries are inadequate or non-existent, and do not include regular monitoring of aquaculture operations. To ensure proper planning and sustainable aquaculture operations, the Food and Agriculture Organization of the United Nations (FAO) proposed the Ecosystem Approach to Aquaculture (EAA) as a strategy for sustainable development of all forms of aquaculture [1, 2].
However, the practical implementation of EAA has been slow, particularly in the principles of the EAA were presented and discussed in field projects, workshops and meetings in 26 countries [3]. In Asia, limited spatial data and lack of cost- effective methods to support planners in the decision-making process hinder EAA implementation. To address these gaps, the authors of this paper have been working on the development of simple and widely applicable methods based on EAA to holistically evaluate the site suitability and estimate the appropriate sizes of coastal finfish aquaculture sites in Southeast Asia. These methods could potentially be applied to other island nations with limited data. In this context, a methodology for site selection (SS), production carrying capacity (PCC), ecological carrying capacity (ECC), and siting (SIT) is undergoing development at Kiel University, Germany [4, 5]. These methods are primarily based on the results of dynamic models combined with on-site measurements, and those of regularly monitored sediment and water quality to improve the reliability of predictions.
This paper summarizes the development of a generally applicable monitoring strategy for assessing the environmental impacts of coastal finfish aquaculture on seafloor sediments at remote sites. The strategy shall also deliver information for optimizing the method for estimating carrying capacities of individual fish farms developed by Mayerle, et al. [5]. The investigations were conducted at a target marine finfish aquaculture site northwest of Bali, Indonesia. Benthic impacts from the largest fish farms were also analyzed. To achieve these goals, sediment samples were collected from beneath the largest fish farms and at undisturbed locations as reference sites. Statistical analysis was applied to verify the identification of fish farms impacting seafloor sediments. The effectiveness of four sediment parameters was investigated, and the most suitable indicators for monitoring benthic impacts at remote sites were determined. Moreover, the effectiveness of the results in calibrating the proposed method for estimating the near-field carrying capacity was demonstrated. The findings of the study provide information on the current operating conditions of the site in Bali, and based on these, recommendations have been made to ensure environmentally sustainable operations.
Material and Methods
Study Area
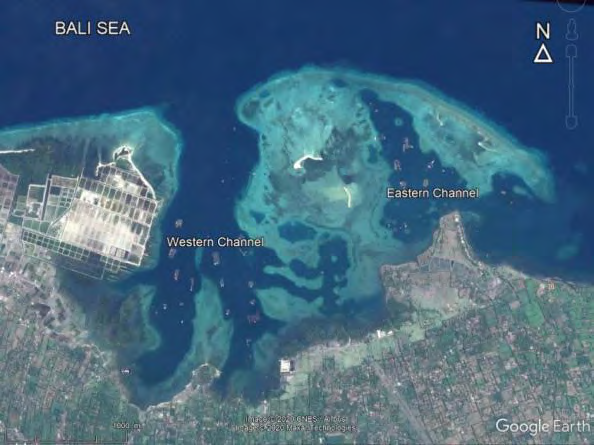
Pegametan Bay, the target site investigated in this study, is located northwest of Bali Island, Indonesia (8° 8.55’ S and 114° 35.30’ E). The bay covers approximately 8.5 km² area and belongs to a coral fringing reef system that extends to the Bali Sea [6]. Multi-branched tidal channels with water depths approximately ranging between 5 m and 25 m surround the higher flats that are covered with water even at low tide. An outer reef barrier largely shields the inner reef area from the waves (Figure 1). Hydrodynamics are primarily driven by mixed tides ranging 1-1.8 m. In general, tidal currents in the channels are weakly developed. The channel to the west is wider and shallower, and the current velocities are extremely small, as they end on the coastline. Current velocities are mostly higher in the eastern channel than those in the western channel, as the former is narrower and open to the Bali Sea at both ends.
Three main depositional environments were observed in the bay. Mud predominates in the deeper channel beds, and medium- to coarse-grained carbonate sands are common in the higher flats. The seabed consists of muddy to sandy carbonate sediments with coarser coral debris. Muds often have a plastic consistency with low permeability resulting from consolidation processes that inhibit the flux of oxygen from seawater into the seabed. As sediment pores are poorly interconnected in muddy deposits, the free oxygen bound in the pore water is rapidly biologically respirated. Low redox potentials have been observed in seafloor sediments, while tidal currents and bioturbation in the bay are too weak to provide effective aeration of the sediments and oxic respiration systems. Moreover, oxygen deficiency is reinforced when organic waste settles onto the seafloor, as the oxygen demand for bacterial degradation of matter increases.
Marine Finfish Aquaculture Facilities
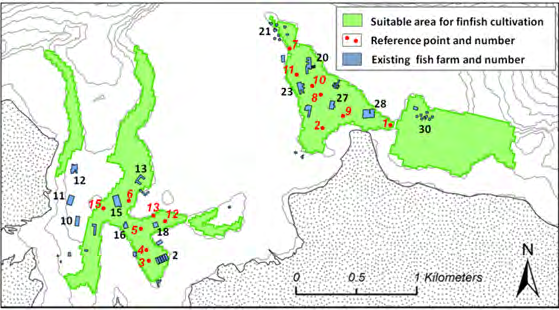
The northwest of Bali is a typical marine finfish aquaculture site for the cultivation of high-value commodities in operation in Indonesia. Most cultivated species are Asian seabass [7] and humpback grouper [8]. Finfish mariculture using floating net cages has been practiced in Pegametan Bay since 2001 and has grown to 30 farms in 2015. Figure 2 shows the locations of these fish farms. There are 28 traditional fish farms with assemblies of up to 380 rectangular net cages sized 3 m × 3 m × 3 m each. The nets are hooked in wooden rafts kept afloat by plastic drums, which ensure the buoyancy of the farming constructions. The stocking density of traditional farms used mainly for the cultivation of groupers is approximately 10–20 kg/m3. Additionally, there are two farm clusters in the eastern channel with 7–8 circular high density polyethylene (HDPE) floating units relatively close to each other used as nursery and for on-growing (see farms 21 and 30 in Figure 2). The cages are 20 m in diameter and have cage depths of approximately 6–7 m. The latter are used mainly for the cultivation of Asian seabass with stocking densities of approximately 25–30 kg/m3. Larger farms use formulated feed (pellets) as a diet, whereas small-and medium-sized farms use a mix of trash fish and pellets for feeding. Suitable areas for marine finfish farming are shown in Figure 2 (in green). Notably, most of the fish farms are well sited, reflecting the experience of fish farmers and planners [4].
Sampling Locations
Analysis of benthic impacts due to fish farming was performed in November 2015 and January 2016. The 12 largest farms in operation in 2015, which accounted for approximately 80% of the fish production, were selected for these assessments. This included farm 2, 11, 13, 15, 16, and 18 in the Western Channel and farms 20, 21, 23, 27, 28, and 30 in the Eastern Channel (Figure 2). Among the monitored fish farms, only Farm 11 was located outside areas suitable for marine finfish aquaculture activity. Table 1 provides information on sampled fish farms, sampling locations, and the number of sediment samples collected underneath the sampled fish farms. Three to five sediment samples per farm were collected from the traditional farms. Overall, 42 sediment samples were collected from underneath fish farms. The distance between sampling locations under the traditional fish farms was set to approximately 20–30 m. One sample was collected centrally below most circular cages of the farm clusters numbered 21 and 30 (see Figure 2). Peak
current velocities and water depths at sampling locations were obtained from three-dimensional model simulations covering a spring per neap tidal cycle from 6–20 Jan 2008 (two weeks) with tidal ranges varying approximately 0.7-1.8 m [9]. Water depths at farming locations are generally lower in the Eastern Channel, and the modeled current velocities exhibit significant differences. Peak current velocities in the Eastern Channel range approximately 0.09–0.22 m/s, whereas those in the Western Channel are ≤ 0.03 m/s.
| Fish Farm No. (Figure 2) | 2 | 11 | 13 | 15 | 16 | 18 | 20 | 23 | 27 | 28 | 21 | 30 | |
|---|---|---|---|---|---|---|---|---|---|---|---|---|---|
| Tidal channel | Western | Eastern | |||||||||||
| Fish farm | Cage type | Rectangular cages made of wooden rafts | Circular HDPE cages | ||||||||||
| Cage sizes | 3 m × 3 m × 3 m | 20 m diameter,6–7 m cage depth | |||||||||||
| No. of cages | 250 | 380 | 166 | 320 | 100 | 168 | 319 | 212 | 182 | 321 | 7 | 8 | |
| Stocking density | 10–20 kg/m3 | 25–30 kg/m3 | |||||||||||
| Water depth (m) | 12.4 | 22 | 20 | 21 | 19 | 18 | 16 | 14 | 14 | 16 | 9.9 | 16.1 | |
| Peak current velocity (m/s) | 0.03 | 0 | 0 | 0 | 0 | 0 | 0.2 | 0.1 | 0.1 | 0.2 | 0.18 | 0.17 | |
| Number of collected sediment samples (n) | 3 | 3 | 3 | 3 | 2 | 5 | 3 | 3 | 3 | 3 | 5 | 6 |
Table 1: Sampled fish farms and number of collected samples in Pegametan Bay.
Sediment samples were also collected at 14 reference locations (7 in each channel), as shown in Figure 2. Samples were collected to obtain representative information on undisturbed sediment conditions to assess the impacts of fish farms on the seafloor. Sampling locations were carefully selected in the open spaces between the fish farms to reflect conditions unaffected by farming. The minimum distance from a reference location to the nearest fish farm was chosen as 70 m to minimize potential farming influence [10].
Sampling Methodology and Analysis
In this study, the effectiveness of several sediment indicators was investigated for assessing the effects of fish farms on seafloor sediments. Sediment samples were analyzed for total organic matter (TOM; % of dry weight), particulate organic nitrogen (PON; mg/g), Eh (redox potential; mV), and total dissolved sulfide (TDS; mg/l). TDS, Eh, and pH in the pore water were measured on-site, whereas concentrations of TOM and PON were determined in the laboratory. The sampling methodology was as follows: At each sampling location, the divers initially documented visual evidence of benthic impacts through video recordings. The focus was on the sediment characteristics, evidence of bioturbation, and the presence of corals and algae. At the sampling locations, divers slowly pushed a PVC pipe of 8 cm diameter and 20 cm length approximately 15 cm into the seabed. The pipe was carefully closed with caps at both ends and brought vertically to the free surface. At the fish farms, the upper cap of the pipe was removed, and the overlying water slowly drained and purged. The smell and appearance of the sediment surface were recorded. Then, metrologically prepared probes recording TDS and temperature (ATM Germany H2S-sensor 15091001), pH (Meinsberg Germany EGA 142/PT1000), and Eh (WTW Germany SenTix® PtR) were introduced into the water saturated sediment core and fixed at approximately 3 cm below the sample surface until stable values were obtained. This depth was chosen to ensure that the invasive measurement in the sensitive surface layers was not disturbed by leaching of the oxidized surface water films. Then, the probes were cleaned and left for approximately 20 min to recover in a recipient with fresh seawater. Meanwhile, the upper 1 cm sediment layer was sampled at undisturbed sections of the core to determine the recent composition of the seabed sediment. Samples were then applied to a thin layer on a labeled PE film and exposed to the sun for approximately 15–20 min for drying. Next, the samples were tightly packed and shipped to Germany. In the laboratory of Kiel University, the samples were desalinated, dried, and homogenized. Each sample was split into three subsamples and the results averaged to compensate for possible homogenization errors. PON was determined by combustion/gas chromatography with a carbon nitrogen elemental analyzer (CN-Analyzer Euro EA, HekaTech Germany), whereas TOM was determined by loss of ignition (LOI) at 550°C [11] using a muffle furnace (Heraeus Germany TM M110T).
Assessment of the Fish Farming Impacts on Seafloor Sediments
Visual Observation
The primary visual inspection of fish farming impacts at the site in Bali covered all the sampling locations. The presentation of the results of the study has been restricted to the samples collected at one traditional fish farm, that is, Farm 18 and at one of the farm clusters, that is, Farm 21 (Figure 2) for conciseness. The observations made under these fish farms and at nearby reference locations reflect the conditions of the aquaculture site reasonably well. Farm 18, on the Western Channel, consisted of 168 rectangular cages with 3 m cage depths. The estimated stocking density in 2015 was approximately 10–20 kg/m³. Farm Cluster 21, on the Eastern Channel, utilizes seven large HDPE cages with cage depths of up to 7 m. It is one of the largest producing farms in the bay, with a stocking density of approximately 25–30 kg/m³. Figure 3 provides an overview of the conditions underneath the selected fish farms and nearby reference locations. Figure 3(a) shows the seabed at reference location 12 at a water depth of approximately 17 m (see Figure 2). Seafloor sediments are characterized by bioturbation. Figure 3(b) shows the sediment core from the same area, consisting of gray carbonate sand with increasing amounts of silt towards the surface. For comparison, a sediment core collected beneath Farm 18 at a water depth of approximately 18.6 m is shown in Figure 3(c). The sediments underneath this farm evidently have very similar properties in terms of grain size, consistency, and color association than those at the neighboring reference location. No farming impact, such as organic accumulation, was observed in the samples collected from underneath the farm.
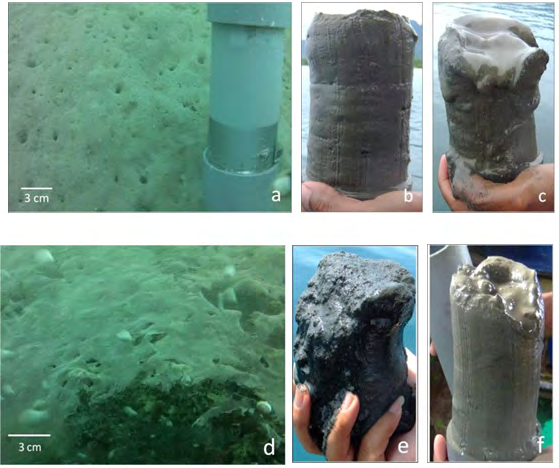
In contrast, the seabed beneath the circular cages of Farm Cluster 21 showed a smooth, undulating structure with no bioturbation features. Vast areas beneath the cages were found to be completely covered with a black mud layer overlaid with shimmering bright mats of sulfur bacteria (Figure 3d). Gas bubbles of H2S escaped from the seabed when agitated by the diver. Figure 3(e) depicts one of the sediment cores collected from beneath the farm cluster. The muddy material is black due to the presence of iron sulphites resulting from anaerobic bacterial desulfation. Similar seafloor sediment conditions were only observed in Farm Cluster 30. Figure 3(f) shows the sediment core collected at the reference location 7 approximately 150 m south of Farm Cluster 21 (Figure 2). The silty sediment was plastic and light gray. Similar to the other samples obtained at reference locations, there was no visible evidence of impacts due to fish farming.
Statistical Analysis
We then statistically evaluated the potential environmental effects of fish farms by comparing the sediment quality of the samples collected underneath fish farms with those from reference locations. The analysis was performed for the four analyzed sediment parameters, and each fish farm was tested individually. Due to varying hydrodynamics and distinct depositional environments in Pegametan Bay, the analysis was conducted separately for the western and eastern channels. The environmental sustainability of fish farm production with respect to sediment quality was considered if the sediment parameter values for the fish farm did not vary significantly with those measured at undisturbed reference locations. Non- parametric U-tests [12] were performed as follows:
1 ( 1) 1 with 2
$$ U 1 = m \times n + \frac {m (m + 1)}{2} - R m \mathrm {w i t h} R m = \sum_ {i = 1} ^ {m} R i \quad 1 $$ m
1 ( 1) 2 with 2
$$ U 2 = m \times n + \frac {n (n + 1)}{2} - R n \mathrm {w i t h} R n = \sum_ {i = 1} ^ {n} R i ^ {2} $$ n Where m is the size of the samples collected at reference locations in the respective channel, n is the number of samples collected from each fish farm, and Rm and Rn are the sum of the ranking numbers of the parameter values measured at reference locations and under each fish farm, respectively. In this study, two-sided tests were performed at the 95% confidence level. The null hypothesis was assumed to be confirmed for crit; m; n; crit; m; n; 1 or U2 U U U α α > > 3 and rejected for:
crit; m; n;
crit; m; n;
$$ U 1 \leq U _ {\mathrm {c r i t}; \mathrm {m}; \mathrm {n}; \alpha} \mathrm {o r} \mathrm {U} 2 \leq U _ {\mathrm {c r i t}; \mathrm {m}; \mathrm {n}; \alpha} \quad 4 $$ A summary of the results of the non-parametric U-tests for the sampled fish farms is presented in Table 2. Farm 16 was excluded from the analysis as only two samples were available. It was observed that the null hypotheses was rejected with respect to the four sediment parameters only for farm clusters 21 and 30. For Farm 11, the null hypothesis was rejected with respect to the physical parameters PON and TOM, whereas for Farm 23, only for PON. For all the remaining fish farms, the null hypothesis was confirmed. Therefore, based on the results of the statistical analysis, excluding farm clusters 21 and 30 and, to a certain extent, farms 11 and 23, all the remaining fish farms did not impact the seafloor sediments in Pegametan Bay.
| Farm | Cage depth (m) | Stocking density (kg/m3) | Sediment parameters | Result | |||
|---|---|---|---|---|---|---|---|
| PON | TOM | TDS | Eh | ||||
| 2 | 3 | C | C | C | C | Sustainable operation | |
| 13 | C | C | C | C | |||
| 15 | C | C | C | C | |||
| 18 | C | C | C | C | |||
| 20 | 10–20 | C | C | C | C | ||
| 27 | C | C | C | C | |||
| 28 | C | C | C | C | |||
| 11 | R | R | C | C | Critical level of fish production | ||
| 23 | R | C | C | C | |||
| 21 | 6-7 | 25–30 | R | R | R | R | Unsustainable operation |
| 30 | R | R | R | R |
Table 2: Results of non-parametric U-tests for the sampled fish farms in Pegametan Bay. Note: “C” denotes confirmation of the nul
Quantitative Assessment
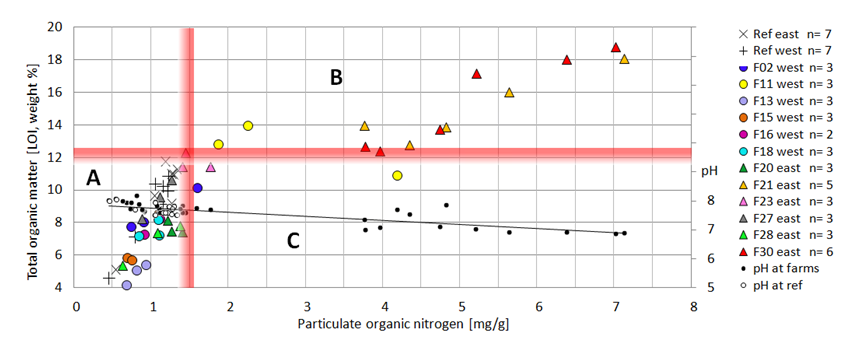
Next, we analyzed the impacts of fish farms on seafloor sediments based on the measured sediment quality indicators. Figure 4(a) shows the variation of TOM with PON in the seafloor sampled sediments. TOM concentrations ranged 4.6–11.8% at reference locations and 4.2–18.8% underneath the fish farms. The levels of organic matter in sediments gradually increased from the low values observed at the reference locations and beneath traditional nonaffected fish farms (see Section A in Figure 4a), to the highest values at the farm clusters 21 and 30 (see Section B in Figure 4a). Notably, TOM concentrations under most of the traditional fish farms are comparable to those determined at reference locations. Based on the statistical analysis results and considering the values observed at those farms exhibiting deterioration, a threshold value was defined for TOM of approximately 12%. Details of the estimation of this critical value are provided in Section 4.2. The dashed red line in Figure 4(a) indicates the limiting value to distinguish between contaminated and uncontaminated sediment conditions. PON concentrations in sediments ranged 0.4–1.3 mg/g in pristine areas and 0.6– 7.1 mg/g below fish farms (Figure 4a). PON concentrations up to approximately 1.5mg/g at traditional fish farms are not different from pristine reference areas. At most fish farms, the PON concentrations were slightly higher compared to those at reference locations (see section A in Figure 4a). Although biodegradation of waste was occurring at the seafloor underneath these farms, the PON levels had not yet reached levels measured in the pristine areas. For the sediment conditions underneath the circular cages (farm clusters 21 and 30), the null hypothesis was rejected in the U-tests (Table 2). Notably, PON concentrations at both farm clusters significantly deviated from those characterizing pristine conditions. The threshold value in terms of PON for the site in Bali was defined in the order of 1.5 mg/g (see dashed red line in Figure 4a, and Section 4.2). An analysis of the variation of pH with PON in all the sediment samples was also conducted (see sections A and C of Figure 4a). The pH values measured in the sediments varied between 7.5 and 8.1 at reference locations and from 6.9-8.2 underneath fish farms. A strong correlation existed between pH and PON, as shown in Figure 4(a). Decreasing pH levels in organic muds underneath the severely affecting farm clusters 21 and 30 indicated the increasing acidity in the seafloor sediment due to increasing levels of H2S.
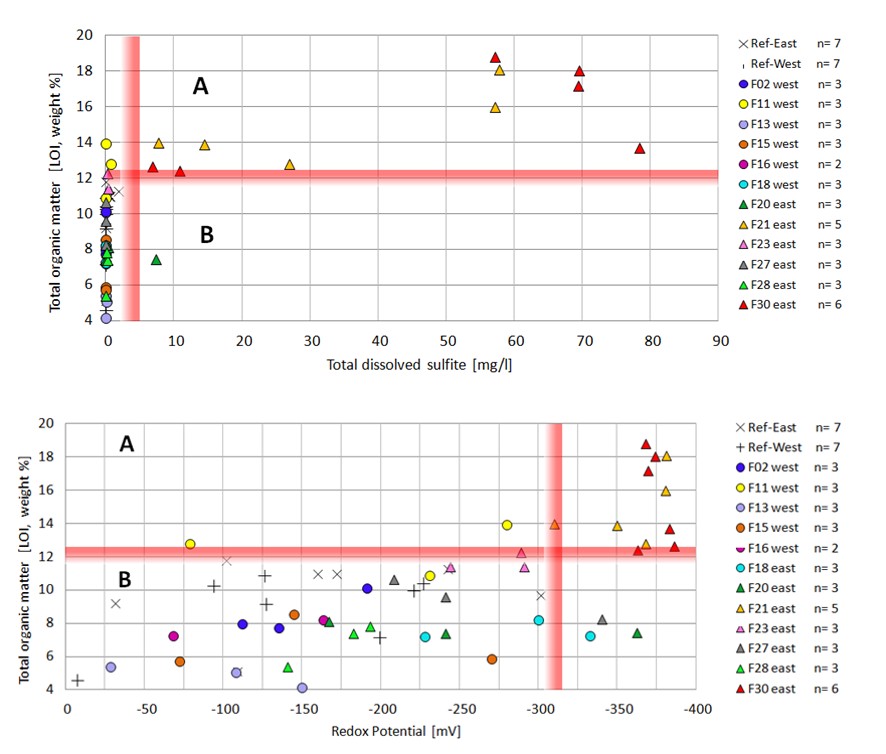
Figure 4(b) shows the variation of TOM with TDS in the sediment samples. The data array of measured TDS values ranged 0.0–1.9 mg/l at undisturbed locations and 0.0–78.4 mg/l at fish farms. In general, TDS values at reference locations and beneath traditional fish farms were very low (section B in Figure 4b). In contrast, below farm clusters 21 and 30, the TDS values were significantly high. The high variance of the sulfite contents in the highly impacted seabed sediments were attributed to the non-homogeneous geochemical conditions. High TDS values obtained for these farms were related to increased TOM levels (see section A in Figure 4b). However, the opposite did not always hold true. Notably, although the TOM values in the sediments at Farm 11 were also elevated, TDS concentrations at this fish farm were only slightly increased. Based on the measured values, the transition from undisturbed to impacted seafloor sediment conditions occurred from approximately 2 to 5 mg/l, as shown in Figure 4(b).
Figure 4(c) shows the variation in TOM with Eh for the sampled sediments. The Eh values at the reference locations ranged from -7 mV to -302 mV and at the sampled fish farms from -28 mV to -386 mV. The measured values of these two populations overlapped over wide ranges. In general, values were highly non-homogeneous across channels, and the correlation of TOM with Eh was extremely weak. Nevertheless, the highest TOM values coincided reasonably well with the lowest measured Eh values at the most impacted farm clusters 21 and 30. The limiting value that characterized undisturbed conditions was considered as -302 mV, as it was the lowest redox value measured at reference locations (see dashed red line in Figure 4c). Notably, the Eh values measured in some of the samples collected underneath farms 18, 20, and 27 were below this limit. Similar to the observations for TDS, it was difficult to detect sediment degradation in the early stages through Eh measurements.
(a)
(b)
(c) Figure 4: Measured sediment parameters at fish farms and reference locations in Pegametan Bay. (a) TOM versus PON and pH versus PON; (b) TOM versus TDS; and (c) TOM versus Eh. Note: n is the size of each random sample; emphasized red lines indicate the defined/chosen threshold values.
Analysis and Discussions
Best Suited Sediment Quality Indicator(s) for Remote Sites in Southeast Asia
Among the four analyzed sediment indicators, TOM and PON were found to be the best suited for monitoring benthic impacts at monitoring benthic impacts at the site studied. Both parameters showed a gradual increase from low concentrations at pristine locations to high values at the most impacted fish farms in the selected site in Bali (Figure 4a). Sediment sampling can be easily accomplished with grab samples from boats or directly from fish farms. Determination of TOM can be performed in muffle furnaces by loss of ignition, which is inexpensive and less error- prone in terms of preparation. Similar to TOM, elevated PON concentrations in seabed sediments provided reliable evidence of incomplete bacterial degradation of waste matter. Nitrogen is deficient in oligotrophic systems and is an essential component of organic wastes released from fish farms. However, carbonate sediment preparation for the CN analysis of PON requires caution and skill.
The geochemical parameters, TDS and Eh, also proved to be effective indicators of organic enrichment due to fish farming. However, these could not resolve the transition from undisturbed to impacted sediment conditions. Analysis of measurements in some fish farms had shown that organic enrichment occurred soon after minor traces of TDS were detected in sediments. Therefore, TDS could not detect sediment deterioration in the early stages. Similarly, Eh was found to provide meaningful information on the oxygen status in sediments beneath fish farms, but the values highly varied and were usually negative in muddy depositional environments. In addition, the variation of Eh values in pristine areas, as observed in this study, hindered the identification of emerging impacts due to fish farming through U-tests. Moreover, attention should be given to the measurements and analyses of the TDS and Eh. As direct measurements on the seafloor are impractical, samples brought to the free surface would partially exhibit gas losses. Outgas flow and unnoticed leaching of oxygenated surface water into the sediment subsurface can lead to biases, such as increases in Eh and decreases in TDS.
Site-specific Threshold Values for PON and TOM
The estimation of threshold values using PON and TOM data has been investigated in many studies. The majority of these have primarily covered aquaculture sites in subtropical to subpolar climate zones [8, 13, 14, 15, 16, 17, 18]. Various values have been reported in these literatures, reflecting the different environments and cultivated species. However, information on the critical values of sediment parameters applicable to tropical environments is limited. In this study, we attempted to estimate the threshold values of TOM and PON at the site in Bali. This was achieved by combining the results of the non-parametric U-tests with the analysis of the measured values at the fish farms experiencing initial signs of sediment deterioration (Figure 4a). Focus was laid on the conditions observed at fish farms 11 and 23. As shown in Table 2, the null hypothesis was confirmed for TDS and Eh, but rejected for TOM and PON at Farm 11. For Farm 23, the null hypothesis was rejected only for the TOM. By analyzing the range of values observed at these fish farms, threshold values were defined for TOM of approximately 12% and PON of approximately 1.5 mg/g (Figure 4a). Although these values have been applied to provide a preliminary assessment of the seafloor sediment conditions, they should be considered as site-specific.
Assessment of the Operating Conditions of the Selected Site in Bali
From the analysis results, three groups of farms were identified based on their impact on the seafloor sediments in Pegametan Bay, that is, fish farms operating well within carrying capacity, farm clusters drastically impacting the seafloor sediments, and farms exhibiting initial signs of sediment quality deterioration. It was observed that underneath most of the traditional fish farms with cage depths ≤ 3 m and operating with stocking densities ≤ 20 kg/m3, the measured values of all sediment indicators were comparable to those observed at pristine locations. This included farms 2, 13, 15, 16, and 18 in the Western Channel and farms 20, 27, and 28 in the Eastern Channel (Figure 2). Although current velocities at these fish farms were too low to displace settled wasted particles, there were no signs of accumulation of organic matter. Thus, settled organic waste was evidently completely biodegraded, and production was below the carrying capacity of fish farms.
The second group of farms comprised farm clusters 21 and 30, which had caused major damage to the seafloor. Both farm clusters consisted of several circular cages with approximately 6–7 m cage depths and operated at stocking densities of approximately 25–30 kg/m3. The levels of TOM, PON, and TDS measured underneath the circular cages were significantly enhanced, and the redox potential was significantly lower than that at the pristine locations. Denitrification and desulfation were the predominant bacterial respiration systems, and the pH in sediments was lower than that in undisturbed locations. While nitrate reduction ranks just behind oxygen respiration in terms of its energy yield [19], bacterial sulfate reduction was significantly less efficient. Hence, the degradation slowed down and waste accumulated. Organic enrichment was observed beneath both farm clusters (Figure 3e), which revealed an exceeded carrying capacity.
The third group of farms comprised traditional fish farms 11 and 23. Both farms employed rectangular cages with 3 m cage depths and operated at stocking densities of 10–20 kg/ m3. At Farm 11, the null hypothesis was rejected for TOM and PON, but not for TDS and Eh (Table 2). At Farm 23, the null hypothesis was confirmed for all sediment parameters except PON. The statistical analysis results indicated a poor ecological balance between the deposition of organic waste and its bacterial degradation beneath these farms. This may be because both farms had been operating just at or beyond the limits of carrying capacity. At first, the deteriorating seafloor conditions under the farms was unexpected, as cage depths and stocking densities were similar to the remaining traditional farms at the site in Bali. However, besides being the third largest farm in the site, Farm 11 is located outside suitable areas and relatively close to the shore [4]. Although flushing rates were comparable to those of other farms in the Western Channel, parts of Farm 11 might be exposed to even less flushing. Moreover, Farm 23 was characterized by the lowest flow Reynolds number (Re) among all fish farms in the Eastern Channel [5]. The near-field carrying capacity is directly related to Re, which could explain the deterioration tendencies observed in this case. Furthermore, Farm 23 is very close to the central coral reef platform separating the tidal channels, and just at the border of the suitable areas (Figure 2). Hence, like Farm 11, parts of this farm might be subjected to very small flushing rates.
Adoption of the Results for Estimating Carrying Capacity at Farm Level
The results of the monitoring strategy proved to be well suited for optimizing the PCC method developed by Mayerle, et al. [5]. This method predicts the maximum allowable fish production of individual fish farms. A non-dimensional relationship was derived between the ratio of deposited to emitted organic matter, the hydrodynamic character of the fish farm location, and the characteristic settling velocity of the particulates. The maximum fish production and allowable cage depths could be determined by limiting the carbon deposition beneath the farms to ensure environmental sustainability. To account for the simplifications and assumptions made in the derivation of the relationship and the uncertainties in the selection of the input data used in the predictions, a site-specific correction coefficient was introduced. This coefficient was determined from on-site analysis of sediment quality underneath fish farms exhibiting initial signs of deterioration. This is typically the case for farms 11 and 23 in Pegametan Bay, as shown in Section 4.3. The correction coefficient could be determined by comparing the PCC predictions with the threshold value of the carbon load on the seafloor at these farming locations. Thus, the accuracy of predicting near-field carrying capacity could be improved. Details on the PCC method and estimation of the correction coefficient are available in Mayerle, et al. [5].
Conclusion
A simple and generally applicable strategy was proposed to monitor the impacts of marine finfish farms on seafloor sediments in a site in Bali, Indonesia. The strategy has the potential to be applied to aquaculture sites in other regions in Indonesia. Because TOM can be easily analyzed, has few errors, and is inexpensive, this study proposed the adoption of TOM for regular monitoring. In places with high TOM levels, the results should be confirmed by additionally analyzing samples for PON. Evaluation of monitoring is based on the statistical comparison of sediment parameters in reference undisturbed location and under fish farms. The selection of sampling locations should consider fish farming sizes and flushing rates. Attention should also be given to the sample size and selected statistical populations based on environmental settings to meet the requirements for the application of the statistical tests and to achieve significant results at the selected level of significance. The strategy has been successfully integrated into a methodology under development at Kiel University to holistically estimate the carrying capacity of marine finfish aquaculture at the farm level in sites in Southeast Asia. More specifically, the results of the monitoring were effective in calibrating the empirical relationship to determine the physical carrying capacity of individual fish farms proposed by Mayerle, et al. [5].
Assessment of the aquaculture site in Bali following the steps of the strategy led to the identification of fish farms impacting seafloor sediments. The results were in good agreement with the predictions of the near-field carrying capacity by Mayerle, et al. [5]. It was found that sediment quality under most of the traditional fish farms with cage depths ≤ approximately 3 m and operating with stocking densities ≤ 20 kg/m3 were widely comparable to those measured at reference undisturbed locations. In contrast, surplus fish production in the two farm clusters with cage depths of approximately 6-7 m and stocking densities of approximately 25-30 kg/m3 caused significant waste accumulation. From the assessment results, the authors recommend that the responsible authorities significantly reduce fish production in farm clusters 21 and 30 and establish a regular monitoring program using the strategy proposed in this study.
The authors acknowledge that sediment quality under fish farms represents only one criterion among various indicators, which are essential for an accurate assessment of the environmental impacts of fish production in aquaculture sites. The effectiveness of sediment analysis for initial assessments of benthic impacts of fish farming was based on the consideration that basic physical and geochemical parameters could be reliable indicators of initial and advanced accumulation of particulate waste and deterioration of oxygen conditions. The parameters adopted in this study can be easily measured on-site with adequate accuracy by applying the general methods of sediment sampling. If deterioration of sediment quality is detected on a fish farm, a reduction in fish production is mandatory. In this case, reallocating the mispositioned farms to suitable places within the aquaculture site should be considered to facilitate the natural recovery of the impacted benthic environment.
References
-
Soto D, Manjarrez AJ, Hishamunda N (2008) Building an ecosystem approach to aquaculture. food and agriculture organization of the united nations Rome, pp: 1-221.
-
FAO (2010) Aquaculture development 4. Ecosystem approach to aquaculture. FAO Technical Guidelines for Responsible Fisheries 5(4): 53.
-
Brugere C, Manjarrez AJ, Beveridge MC, Soto D (2019) The ecosystem approach to aquaculture 10 years on-a critical review and consideration of its future role in blue growth. Reviews in Aquaculture 11(3): 493-514.
-
Mayerle R, Sugama K, Runte KH, Radiarta N, Vallejo SM (2017) Spatial planning of marine finfish aquaculture facilities in Indonesia. In Aguilar-Manjarrez J, et al. (Eds.), Aquaculture zoning, site selection and area management under the ecosystem approach to aquaculture. Full document, pp: 222-252.
-
Mayerle R, Niederndorfer KR, Jaramillo JMF, Runte KH (2020) Hydrodynamic method for estimating production carrying capacity of coastal finfish cage aquaculture in Southeast Asia. Aquacultural Engineering, pp: 88.
-
Whitten T, Soeriaatmadja RE, Afiff SA (1997) The Ecology of Java and Bali, pp: 969.
-
Kungvankij P, Tiro LB, Pudadera BJ, Potestas IO (1986) Biology and culture of sea bass (Lates calcarifer). Network of Aquaculture Centres in Asia.
-
Afero F, Miao S, Perez AA (2010) Economic analysis of tiger grouper Epinephelus fuscoguttatus and humpback grouper Cromileptes altivelis commercial cage culture in Indonesia. Aquaculture international 18(5): 725-739.
-
Niederndorfer KR (2017) Proposal of a practical method to estimate the ecological carrying capacity for finfish mariculture with respect to particulate carbon deposition to the sea floor, pp: 1-108.
-
Giles H (2008) Using Baysian networks to examine consistent trends in fish farm benthic impact studies. Aquaculture 274(2-4): 181-195.
-
Dean WE (1974) Determination of carbonate and organic matter in calcareous sediments and sedimentary rocks by loss on ignition: comparison with other methods. Journal of Sedimentary Research 44(1): 242-248.
-
Mann HB, Whitney DR (1947) On a test of whether one of two random variables is stochastically larger than the other. The annals of mathematical statistics 18(1): 50- 60.
-
Duplisea DE, Hargrave BT (1996) Response of meiobenthic size-structure, biomass and respiration to sediment organic enrichment. Hydrobiologia 339: 161- 170.
-
Karakassis I, Tsapakis M, Hatziyanni E (1998) Seasonal variability in sediment profiles beneath fish farm cages in the Mediterranean. Mar Ecol Prog Ser 162: 243-252.
-
Hansen KP, Pittman K, Ervlk A (1991) Organic waste from marine fish farms-effects on the seabed. In: Makinen T (Ed), Marine aquaculture and environment. Nordic Council of Ministers. Copenhagen, pp: 105-111.
-
Holmer M, Kristensen E (1992) Impact of marine fish cage farming on metabolism and sulfate reduction of underlying sediments. Mar Ecol Prog Ser 80: 191-201.
-
Hall POJ, Holby O, Kollberg S, Samuelson MO (1992) Chemical flux and mass balances in a marine fish cage farm 4 Nitrogen. Mar EcoL Prog Set 89: 81-91.
-
McGhie TK, Crawford CM, Mitchell IM, OBrien D (2000) The degradation of fish-cage waste in sediments during fallowing. Aquaculture 187(3-4): 351-366.
-
Fenchel T, Blackburn H, King GM, Blackburn TH (2012) Bacterial biogeochemistry: The ecophysiology of mineral cycling: 1. Bacterial Metabolism. Academic press, pp: 312.
- Genetic Improvement of Nile Tilapia (Oreochromis niloticus): Advances in Selective Breeding and Genomic Approaches for Sustainable Aquaculture
- Microplastics, Contaminants, and Waste Hotspots: Divergences and Faults in Prioritizing Control Efforts
- Creating a Healthier, More Vibrant Open and Closed Aquatic Environment. A Submersible, Centrifugal Magnetically Affixed Current Changing Aquarium Pump
- An Attempt to Assess Alpha Diversity and Sample Size: Using the Ostracod Assemblages off Kumamoto Port, Japan
- Assessment of the Efficiency of Common Fishing Gears and Crafts Used at Mohananda River of Chapai Nawabganj, Bangladesh
- Fish Productivity and Biodiversity Status of Sundarban Mangrove in Bangladesh