Seasonal Temperature-Salinity Variability at Khanh Hoa - Ca Mau Sea Region
Temperature-Salinity (T-S) data was analyzed from many investigations in northeast and southwest monsoon by lots of projects, which were surveyed at Khanh Hoa-Ca Mau sea region. The results showed that the variation of average temperature all domains in southwest monsoon is greater than in northeast monsoon at surface layer about 2.3°C, middle layer 1.2°C, and bottom layer 1.6°C. In addition, there are the same with variation of average salinity. Salinity in southwest monsoon is greater than in northeast monsoon at surface layer about 0.7‰, middle layer 0.3‰, and bottom layer 0.1‰. The seasonal variation of the two seasons has some common points, as temperature decrease steadily from south to north, salinity increase significant at bottom layer and maximum at 34.54‰. T-S variability in temporal and special scale is showed at three layers: T-S variability is small at the first layer (from surface to 10 m), is strong at the second layer (from 10m to 40m), and is quite stable at the third layer (from 40m to bottom).
Introduction
South Vietnamese seabed topography to form areas of different characteristics. Due to that feature, the South Vietnamese waters which under the impact of Marine physics - Atmosphere, Sea - River with bottom and shore topography had formed complex hydrodynamics., especially with strong upwelling [1, 2] off the coast of Khanh Hoa-Binh Thuan. Their fluctuations alter the dynamics and marine maritime conditions. Research on Temperature-Salinity (T-S) characteristics in coastal areas of Vietnam has been mentioned in many works, but its fluctuations have not been studied in detail [3]. The issues of seasonal fluctuation of Temperature-Salinity have only been considered for a limited number of coastal areas and have not been studied much. Some authors take data in cells 6-11oN, 109-114oE to study Temperature-Salinity characteristics in the South of Vietnam [4], the results show some changes of Temperature- Salinity in Southern Central Vietnam upturn. Some other authors use Temperature-Salinity data of three cells (19- 20°N, 113-114°E), (14-15°N, 115-116°E), (7-8°N, 108 -109°E) to generalize the change of Temperature-Salinity for the entire East Sea. Other researchers have reported the temperature anomalies [5], and the mechanism of water uptake [6] which was related to the effect of ENSO. Nguyen Ba Xuan [7, 8], based on the collection of large data on temperature and salinity and TS curve analysis determined the relations between the surface water mass and seasonal air temperature in the Southeast sea of Vietnam. In the years affected by ENSO, Chung, et al. [5] observed, the abnormal increases of temperature and the abnormal decreases of wind speed, which cause the weakness of upwelling in the South Central Region. Vo Van Lanh and La Van Bai, et al. [9, 10] found anomalous surface water temperature of -4oC and salinity of +1.2 ‰ during the period of ENSO. Duong, et al. [11] analysed and standardized results from multiple survey data sources over a long period showed new findings for seawater temperature, salinity and environmental factors. The highest salinity in this area is 35.4‰. However, it just partly reflects some fluctuations in the average day and night cycle and annual average cycle in the South East Sea. Based on collected data of topics, the project has been implemented in the South Vietnam Sea area such as: In 2016 (July), “The variation of wind characteristics, air temperature and structure Hydrological structure in Ninh Thuan-Binh Thuan sea area in ENSO years”. Year 2013 (October-December), 2015 (May-June) “Changes according to seasonal cycle, annual cycle, multi-year cycle in the physical and biochemical processes of the East Sea, Vietnam South, including changes from the NAGA program survey period to the present. In 2009 (September-October), 2010 (May-June) “Evaluating a number of seasonal changes in heat and salt in the waters of South Vietnam”. The paper uses this data source to study the seasonal fluctuations of temperature - salinity in the South Vietnam Sea in detail.
Materials and Methods
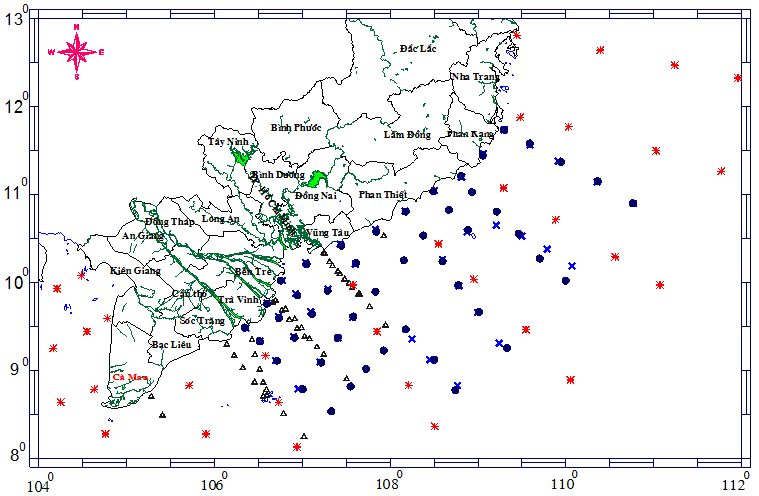
Data source used to analyze and study cyclical changes in Temperature-Salinity is the source of data from the Vietnam-US Protocol Mission 2014-2015 (Figure 1). Tasks of the Vietnam-Federal Convention. Germany 2009-2010, data of NAGA program 1959-1961, 2016 baseline project and recent updated data of the 2017 basic project “Research on Hydrological structures (heat-salt) in upturned waters of Vietnam under dynamic of the ENSO phenomenon” and the subject of the Vietnam-Germany Protocol “Research on the Mekong estuary and the interaction processes between them and the South-Central upturn area”. Data processing method; Prepare data then check to assess the completeness and suitability of the data. Check the suitability of the measuring unit (Temperature-_°_C, Salinity-‰), check the compatibility of the data against the limit of the detection of the measurement method. Comparing the result value with the threshold value of the parameters, detecting abnormal values (the highest temperature for days in the air is 30°C, the surface temperature is <= 30°C, the Salinity level in the region. not more than 35.5‰), complete evaluation of data series.
Statistical analysis method; In each area (there are a number of stations), separate data for each floor (top, middle, bottom or 1m, 2m, 3m, 5m, 10m, 20m ...) in each season and take the average data of each floor according to the formula 1a. For each floor, determine whether the dispersion or stability of the salt heat change uses the standard deviation determined by Equation 1b.
(1a) (1b) In which: xi is the series of data; n is the average value of the series.
Research Results
Width distribution of Temperature-Salinity
Temperature Distribution • In the Northeast Monsoon Period: Highlights of the variation in seawater temperature in the deep layers shown in the temperature distribution shows that cold water masses in the north go down to Binh Thuan
Province.
• Surface Layer: The survey area is very wide, which takes a lot of time, so the temperature distribution in the surface layer in this period can only reflect the temperature of the surface layer according to the seasonal cycle. In general, the temperature of the surface layer, the coastal estuarine area usually has a lower temperature than the offshore area. The results show that the highest temperature is 32.2°C, the lowest is 27.2°C, and the average is about 28°C.
• Middle Layer: This layer is less directly affected by the changes in the temperature of the internal air. Therefore, the trend of increasing the temperature from
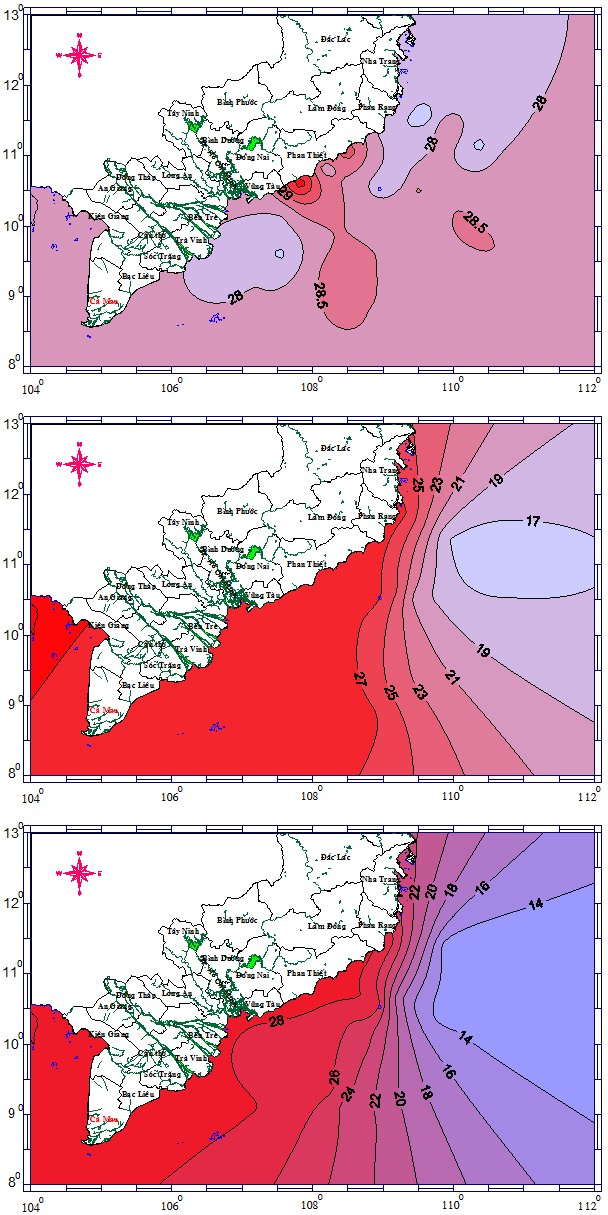
north to south is more pronounced in the surface layer. The middle layer has an average temperature of about 27.7°C, the highest is 28.6°C and the lowest is 15.6°C.
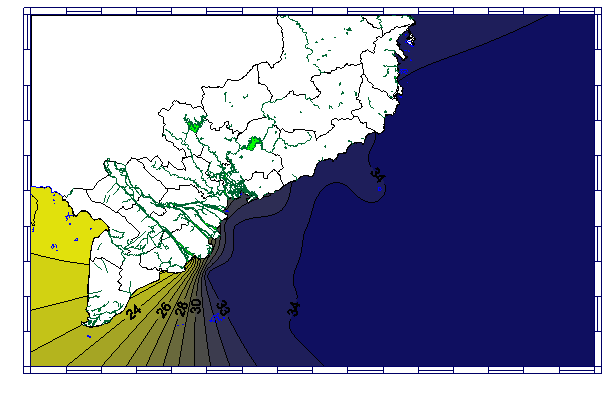
• Bottom Layer: Because it is not affected much by the air temperature during the day, heat degrees at the bottom layer well reflect the cyclical temperature in the studied sea area during the strongly active northeast monsoon season. Spatial thermal contours from north to south are arranged in order of contours 14, 16, 18.., 28°C and temperature distribution increases gradually from offshore to near shore (Figure 2). The bottom layer has an average temperature of 22.9°C, the highest of 28.5°C and the lowest of 12.5°C.
(a) (b)
(c) Figure 2: temperature distribution of surface layer (a), middle layer (b) and bottom layer (c) in northeast monsoon season.
- In the Southwest Monsoon
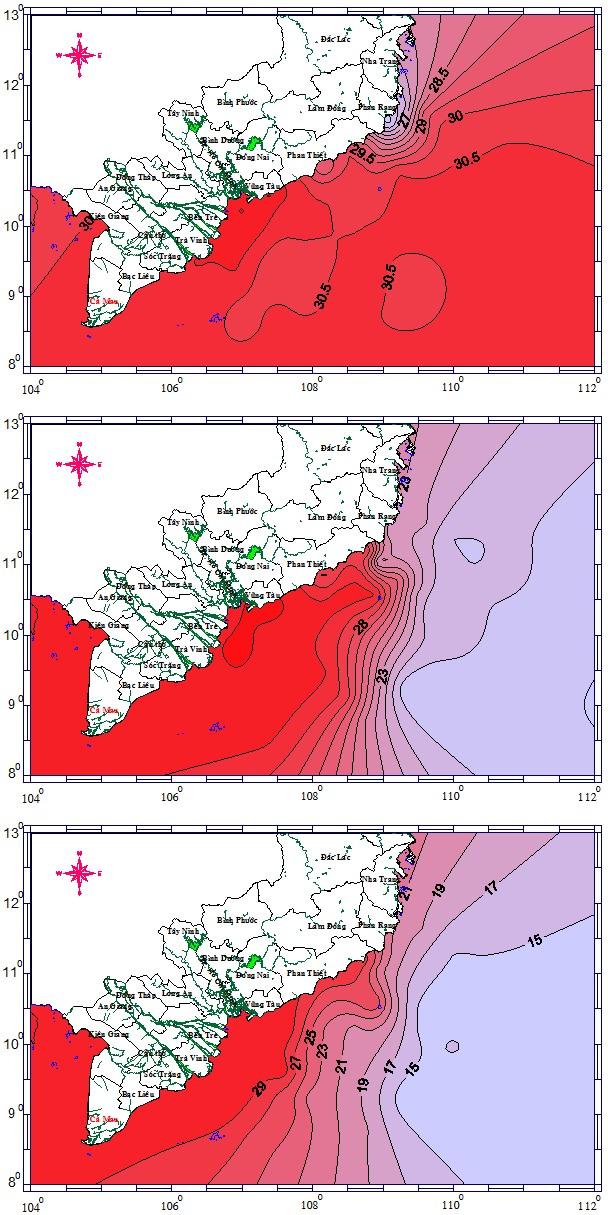
- Surface Layer: temperature in southwest monsoon season is about 2°C higher than surface layer temperature in northeast monsoon season. Water temperature tends to decrease gradually from south to north and from offshore to shore. In the offshore and southern regions, the temperature contours are usually higher. In this season, the average surface temperature is 30.3°C, the highest is 31.5°C, the lowest is 25.2°C (measured in the time of thunderstorms).
• Middle Layer: On the diagram of the temperature level, we also see the rule that the temperature increases gradually from the offshore to the shore. The statistical results show that the average temperature is 27.7°C, the highest is 31.7°C and the lowest temperature is 19.1°C. Comparing the temperature of the middle layer and the surface layer shows: the surface layer (31.5°C) has a maximum temperature lower than the middle layer (31.7°C) and the average temperature in the surface layer (30.3°C) is higher than the middle layer (27.7°C), because It can be concluded that the temperature of the surface layer is higher than the middle layer of 2.6°C.
that the temperature tends to increase gradually. From north to south and the overall heat of the bottom layer was at 24.5°C (Figure 3). The temperature distribution increases gradually from offshore to near shore pressure. The analysis shows that in the bottom layer, the average temperature is 24.5°C, the highest is 31.6°C (the shallow water in the south) and the lowest 12.9°C (the deep north offshore area).
• Bottom Layer: The bottom layer temperature is similar to that of the middle layer, they have a general rule
(a) (b)
(c) Figure 3: temperature distribution of surface layer (a), middle layer (b) and bottom layer (c) in southwest monsoon season.
Salinity Distribution • In the Northeast Monsoon: Because monsoon circulation plays an important role in controlling seawater salinity according to each season, the average annual salt level ranges from 30-34.5 ‰.
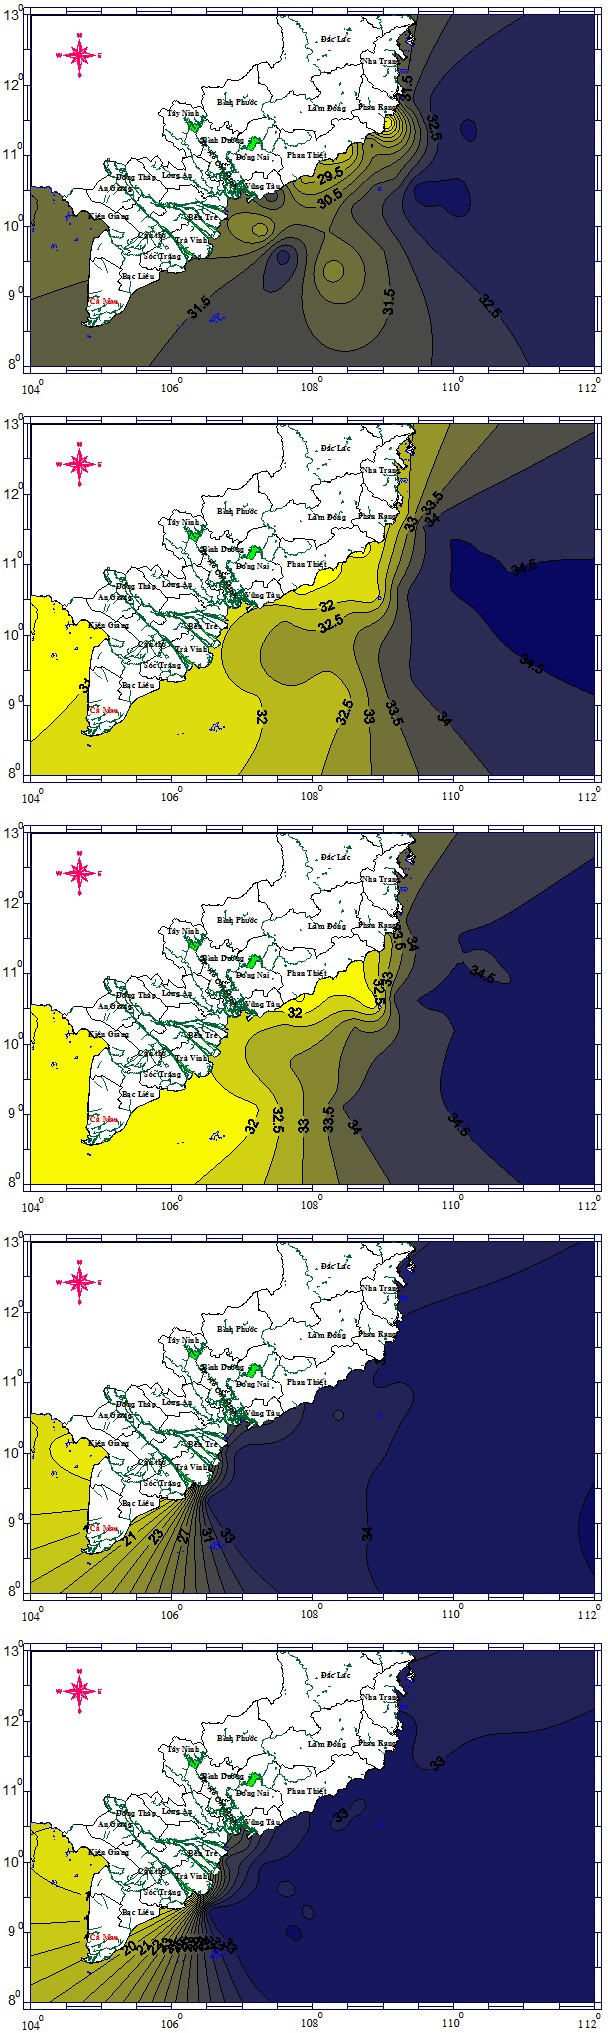
• Surface Layer: There is a great influence of rivers affecting the salinity; evident through the curved contour lines, the closer the water is to the shore and the shallower the water, the more the salt level decreases. The large surface distribution of salt differs from that of the temperate zone. If the temperature increases from north to south, the salt level increases from shore to sea. Topping the northeast monsoon with average salinity of 24.5 ‰ the highest 34 ‰ and the lowest was 12.5 ‰.
• Middle Layer: The common point of distribution of salinity decreases gradually from the offshore area to the shore in the direction of southeast to northwest. On the other hand, there is a great influence of seawater on the estuary of the Mekong, the very tight isometric lines in the estuary; it is clearly shown through contour lines that curl greatly towards the river, giving see seawater accessible inland along the river.
• Bottom Layer: salinity levels decreasing from the high seas or in coastal areas and estuaries (Figure 4). The distribution of salinity in the bottom layer does not immediately depend much on thunderstorms on the sea surface, so the distribution of salinity is somewhat simpler than that in the layers above. The analysis shows that the average salinity of 31.7‰, the highest 31.7‰ and the lowest 23.6‰.
(a) (b)
(c) Figure 4: Salinity distribution of top layer (a), middle layer (b) and bottom layer (c) in northeast monsoon season.
- In the Southwest Monsoon Season
- Surface Layer: In the southwest monsoon season, the salt levels tend to gradually encroach on the Mekong estuary. This proves that the southwest monsoon season gradually penetrates inland. From the offshore to the shore, the contour lines are distributed sequential contour salinity 33.00 ‰, 32.00‰, 31.00‰, 30.00 etc., when coming near the shore is 20.00‰ (Mekong estuary area). The average salinity surface layer 31.34‰, the highest 34.43‰ and the lowest 11.6‰ (Mekong estuaries).
- Middle Layer: class average salinity between 32.4‰, in the Mekong River estuary salinity contour very swift. This proves that in the southwest monsoon season in the
middle layer, seawater with high salinity is close to the estuary. Salinity 33‰ was present in estuaries and that salinity can penetrate deep into the continent through the estuary. The analysis results show, the highest salinity 34.6‰ and the lowest 13.95‰ (Mekong estuaries). • Bottom Layer: salinity decreases from the coast goes to Coastal Estuary according to south and tend increasingly encroaching on areas of the Mekong River, contour 33.00‰ has near access to the estuary and when approaching the shore is 24.00‰ (Figure 5). The results volume: the average salinity of 32.9‰, the highest 34.54‰ and the lowest 18.7 ‰ with a standard deviation of spatial salinity was 3.4‰.
(a) (b)
(c) Figure 5: Salinity distribution of surface layer (a), middle layer (b) and bottom layer (c) in the southwest monsoon season.
Temperature-Salinity Distribution Over Time
Temperature Fluctuations: From the data at the continuous station in the study area, through the analysis, it can be seen that the variation of Temperature-salinity can divide the dependence of Temperature-salinity on depth into three different layers (Figure 6). The first layer has a thickness of 0 to 10 m, the feature of this layer is that the Temperature- salinity fluctuations with depth are not large and over time is not much. The second layer has a thickness of 10 m to 40 m, the characteristics of this layer are Temperature-salinity fluctuations with depth and time taking place strongest in the layers. The third layer has a thickness of 40 to the bottom, with low Temperature-salinity fluctuations with depth.
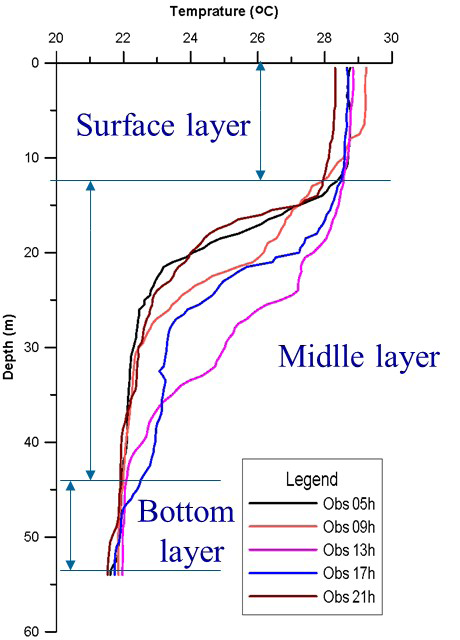
• Surface layer: temperature variation over time is not obvious (temperature with depth is almost a straight line and over time is close to each other). In the surface layer at Obs 5h, the average temperature is 28.72oC to Obs 9h then the temperature increases to 29.06oC to Obs 13h decreases slightly (28.86oC) Obs after decreases to 28.65oC. Thus, the temperature in the first layer does not vary much over time (the standard deviation over time is only 0.16oC).
• Middle Layer: The temperature fluctuations of the second layer occur significantly more strongly than the fluctuations in depth and time of the first layer. Average temperature at Obs 5h is 23.91°C, Obs 9h temperature increases to 24.41°C to Obs 13h increases to 26.08°C followed by Obs decrease to 25.21° C. two temperatures over time relatively much from vary 23.91°C up to 26.08°C (more than 2°C). According to the depth of temperature variation is also large, if in the top layer of the layer the temperature is 28.7°C, then down to the end of the layer, the temperature has decreased to about 22.1°C, reduced by about 6.5°C. Calculation results show that the average temperature variation over time is 24.9°C, the highest is 28.7°C and the lowest is 22.07°C with a standard deviation of temperature in space of 2.34°C. Thus, the temperature in the second layer varies with depth and time relative to that of the surface layer (first layer).
• Bottom Layer: The temperature variation of the third layer is not significant compared to the variation with depth and time of the second layer. Looking at Figure 6 we can clearly see this, the temperature variation with the depth of the sea and the temperature variation over time is almost a straight line. That variation is not obvious, if at Obs 5h the average temperature is 21.89°C to Obs 9h then the temperature increases to 21.95°C to Obs 13h increases slightly to 22.06°C, Obs 17h is 21.16°C. Thus, the average temperature difference layer of the highest third layer is only 0.27°C.
Salinity Volatility: The depth distribution rules of all salinity Obs have the same graph as the temperature variation graph (Figure 7).
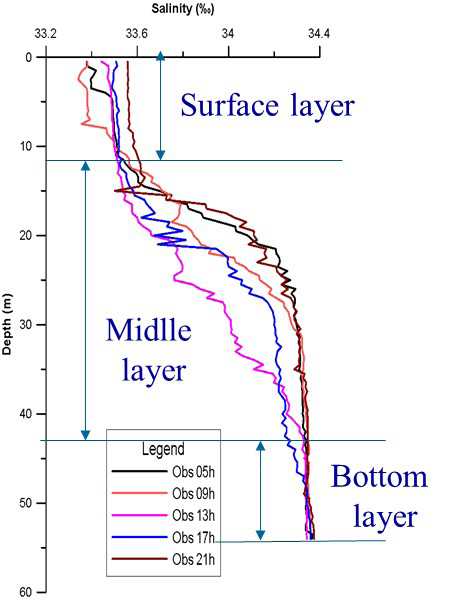
• Surface layer: Salinity ranged from 33.3‰ to 33.55‰ i.e., the time oscillation is only about 0.25‰. In this layer, from 0 m to 8 m deep, there is a variation in salinity, in the rest; the variation in salinity is almost negligible over time. Calculations vary in depth and over time inform that the average salinity of 33.46‰, the highest 33.52‰ and the lowest 33.34‰ with a standard deviation of salinity in space is 0.05‰.
• Middle layer: Variation of salinity ranges from 33.5‰ to 34.4‰ i.e., the fluctuation with depth and day time in the second layer is 0.9‰. It shows that at depths from 20 m to 30 m, the salinity changes over time most strongly. According to the depth, the salinity varies greatly, if in the top layer of the layer the salinity is 33.5‰, down to the bottom of the layer, the salinity has increased to 34.34‰, increasing about 0.85‰. The calculations show, the average salinity 33.99‰, the highest 34.34‰ and the lowest 33.50‰ with a standard deviation of salinity with depth and time is 0, 29‰.
• Bottom layer: Variation of salinity with depth and over time ranges from 34.23‰ to 34.37‰ i.e., the fluctuation over time is only about 0.14‰. The difference in salinity with depth and over time is so small that the salinity of the third layer can be considered to be uniform (Figure 7). Statistical analysis showed that the average salinity of 34.33‰, the highest 34.37‰ and the lowest was
34.23‰ with a standard deviation of spatial salinity 0.03‰.
Conclusion
The trend of temperature variation in both seasons is decreasing from the south to the north and from the sea to the shore. In terms of salinity, the value decreases gradually from the open sea to the estuary coastal area from the southeast to the northwest. Salinity increases significantly when reaching the bottom layer, rarely with salinity 34.6‰ or higher and temperature-salt fluctuations with depth forming three different layers. The second layer has the strongest temperature and salinity fluctuations in depth and over time. The salinity value decreases gradually from the open sea to the coastal area of the river mouth from the southeast to the northwest. Salinity increases significantly when reaching the bottom layer, rarely has a salinity of 34.6‰ or higher, the highest salinity of the bottom layer is 34.54‰. The third layer is homogeneous. Statistical analysis showed that the average salinity of 34.33‰, the highest 34.37‰ and the lowest was 34.23‰ with a standard deviation of spatial salinity 0.03‰. The average temperature in the southwest monsoon season is higher than the average temperature in the northeast monsoon season, about 2.3 degree in the surface layer, about 1.20C in the middle layer and about 1.6C in the bottom layer0. The salinity in the southwest monsoon season is also greater than the salinity in the northeast monsoon season, the surface layer is 0.7, the middle layer is 0.3‰, and the bottom layer is 0.1‰. Through the sea water temperature in the deep layers shown in the temperature distribution, there is a cold-water mass in the north going down to Binh Thuan.
References
-
Bai LV, Lanh VV (1997) Characteristics of distribution and structure of saline water in strongly rising waters. Proceedings of the study on the highly developed South Central waters, pp: 39-48.
-
Xuan NB (1997) Quantitative relationship between the vertical structural deformation of temperature and the intensity of upwelling activity in the South-Central Sea. Research projects strong upwelling region South Central, pp: 58-67.
-
Vinh NK, Lanh VV (2004) On seasonal changes in the thermo-salt structure of the southern coast of Vietnam. Collection of marine research works 14: 52-60.
-
Lanh VV, Tuan NV (2004) Fluctuations in the medium and long cycle of temperature and salinity of sea water South East Sea. Collection of marine research works 14: 7-14.
-
Chung TV, Long BH (2016) Influence of temperature field and abnormal changes of water level in the South China Sea related to climate change. Journal of Marine Science and Technology Hanoi, pp: 44-52.
-
Long BH, Chung TV (2015) Initially studying the effects of climate change on the rise of Southern Central Vietnam in the summer. Scientific Seminar celebrating 40 years of the Vietnam Academy of Science and Technology (1975 - 2015).
-
Xuan NB (1992) Partitioning surface water types in the South-East Vietnam Sea according to salt heat characteristics. Marine Study Series 4: 57-65.
-
Xuan NB (2013) Study on the formation and distribution of surface water bodies in the East Sea. Proceedings of the International Conference, pp: 183-190.
-
Lanh VV, Bai LV (1997) Distribution characteristics and structure thermal-salt in strong upwelling waters. Research projects strong upwelling region South Central, pp: 39-57.
-
Van Lanh V (1995) Thermohaline structure and water masses of South China Sea. Collection of marine research works 6: 25-35.
-
Duong PH, Trung Du H, Linh VTT, Thai TD, Thu M (2020) The effect of ENSO on hydrological structure and environment in the South Central Coast-Vietnam**.** Journal of Marine Science 2(1): 1-7.
- Genetic Improvement of Nile Tilapia (Oreochromis niloticus): Advances in Selective Breeding and Genomic Approaches for Sustainable Aquaculture
- Microplastics, Contaminants, and Waste Hotspots: Divergences and Faults in Prioritizing Control Efforts
- Creating a Healthier, More Vibrant Open and Closed Aquatic Environment. A Submersible, Centrifugal Magnetically Affixed Current Changing Aquarium Pump
- An Attempt to Assess Alpha Diversity and Sample Size: Using the Ostracod Assemblages off Kumamoto Port, Japan
- Assessment of the Efficiency of Common Fishing Gears and Crafts Used at Mohananda River of Chapai Nawabganj, Bangladesh
- Fish Productivity and Biodiversity Status of Sundarban Mangrove in Bangladesh