Assessment of Some Aspects of the Physicochemical Parameters of Surface Water in Kurudu Reservoir, Federal Capital Territory, Abuja Nigeria
Assessment of some aspects of the physicochemical parameters of surface water in Kurudu Reservoir in Federal Capital Territory, Abuja, Nigeria was assessed from January 2018 to December 2019. The aim of this study was to determine some aspect of physicochemical parameter to determine water quality condition of the reservoirs for conservation, management and sustainable use of the reservoirs. Water Samples were collected from three sampling stations and analyzed using standard methods, procedures and instruments. The results of physico-chemical parameters in Kurudu reservoir had a range as shown; The temperature ranged from 23.8-32.3°C with a mean value of 26.0±1.9°C, the pH ranged from 6.3-7.9 with a mean value of 7.1±0.3, and the Secchi depth (transparency) ranged from 0.4-1.8m with a mean value of 1.2±0.4m. Turbidity ranged from 10.5-85.0 NTU with a mean value of 26.0±13.4 NTU. The electrical conductivity (EC) ranged from 59.8-257.0 S/cm with a mean of 105.4±31.9 S/cm, the dissolved oxygen ranged from 4.9-7.1 mg/l with a mean of 6.2±0.4 mg/l, and the biochemical oxygen demand (BOD) ranged from 5.0-8.0 mg/l with a mean of 5.7±0.6 mg/l. Nitrate levels ranged from 3.9-8.5 mg/l with a mean of 6.7±0.9 mg/l, Phosphate levels ranged from 0.0-0.2 mg/l with a mean of 0.1±0.0 mg/l, iron levels ranged from 0.0-1.6 mg/l with a mean of 0.1±0.0 mg/l, and lead (0.0-bdl). Mean values of physicochemical parameters were within the recommended WHO limits except for Turbidity and Nitrate. Analysis of variance (ANOVA) of mean physicochemical parameters between stations and months were not significantly different (P>0.05) as shown by the p-value in Table 2. However, ANOVA of seasonal mean values of turbidity, transparency, EC, Phosphate and Iron values were significantly different (P>0.05). Pearson’s correlation analysis is shown in Table 5. Temperature-transparency (r = 0.592), temperature-EC (r = 0.652), transparencyEC (r = 0.789), turbidity-BOD (r = 0.835) and turbidity- Fe2+ (r = 0.665) had a positive significant relationship whereas temperature-turbidity (r = -0.659), temperature-Fe2+(r = -0.758), temperature-PO4 (r = -0.537) transparency-turbidity (r = -0.938), transparency-BOD (r = -0.880), turbidity- Fe2+ (r = -0.513), turbidity-EC (r = -0.728), EC-Fe2+ (r = -0.547), DO-BOD (r = -0.547) and nitrate-phosphate (r = -0.804) had a negative significant relationship. Calculated water quality index using Horton’s method was 62.35, this study has shown that the reservoirs falls within “good/average” water quality, with class II level of pollution which is indicative of moderate pollution especially during the rainy season. Effective monitoring of reservoir and regulation of activities in and around the reservoir are recommended, also water from the reservoir should be treatment before consumption.
Introduction
Reservoirs are important and valuable water resources with specialized ecosystems that perform important ecological and socio-economic functions. They are formed or modified by human activities for specific purposes of water storage for irrigation purposes, hydroelectric generation, recreational activities such as boating and fishing, flood protection etc., to provide a reliable and controllable water resource [1]. Many reservoirs have recently been created in most urban areas and developing countries because of human activities such as hydroelectric dams, agricultural projects, stone quarrying and soil excavation, constructed and unintended ponds resulting from sand-dragging and excavation activities and so on [2]. In comparison to many natural lakes, reservoirs are heavily influenced by inflows, and their water quality conditions reflect geographic, climatic, and watershed characteristics. They tend to have very large watershed-to- lake area ratios, a higher level of algal productivity and higher rates of sedimentation, distorted biological diversity, and poor water quality. Reservoirs have been found to exacerbate climate change by releasing greenhouse gases [3], function as disease receptors, and cause public health concerns, among other things [4]. Reservoirs require special attention since they have a cumulative influence on the watershed of a certain area [5] and contribute to regional biodiversity [6], again the usability of reservoirs is threatened by increased eutrophication and the resultant water pollution poses a major threat to the well-being of both humans and animals as the reservoir fills with sediments [7]. Therefore, assessment of physicochemical parameter and Water Quality Status of reservoirs is important to provide data that describes water quality condition of the reservoir for proper monitoring of the reservoir.
Kurudu reservoir which is the selected water resource for this study was developed by government to augment water resources and demand in Federal Capital Territory, Kurudu reservoir reservoirs have versatile and extended for irrigation, drinking, washing etc., yet, there are no published data on the physicochemical parameter and water Quality status of the reservoir. Furthermore, in the Federal Capital Territory, studies have previously and currently been carried out in prominent and large reservoirs such as Usuma reservoir and Jabi compared to other reservoirs. Considering the importance and lacunae in knowledge that exist for the selected reservoirs, this study was initiated to provide a baseline data that describes the physicochemical parameters water quality conditions and even the pollution the reservoir, hence this study was understudied.
Materials and Methods
Study Area
Kurudu reservoir lies between latitude 8056´4´´N to 8056´4´´N and between Longitudes 7031´22´´E to 7031´22´´E. It is located behind Army Post Service Estate, Kurudu. The reservoir is a project of Upper Niger River basin Authority (UNRBDA) but supervised by Ministry of water resources. The water project was mainly for irrigation purposes to boost agricultural production for Kurudu farmers and environs. The reservoir is fed from the hill about 2km from the project area, the water flows from more than one point through natural surroundings and agricultural areas to the reservoir. The Reservoir is Y-shaped, not static and water supply is perennial. The dam area is estimated to have an area of approximately 648,608m2 and capacity of about 8,000,000 L3 (www.unrbda.gov.ng).
Sampling Stations
Three (3) sampling stations were chosen after preliminary survey based on factors such as accessibility, depth, volume of water and the various activities taking place in and around the reservoir.
• Station I It is the inlet point where water flow into the reservoir, it is the highest point of human and animal contact and area that receives run-offs from farm lands. Station 1 is about 1 kilometer away from station II, it the shallowest part of the reservoir and has thus attracted more human activities around it due to ease of accessibility. Domestic activities like bathing, fetching of water, animal feedings, washing of cloths etc., were noticeably ongoing.
• Station II It is mid-section of the reservoirs which represented the area of lentic water between the inlet and outlet, Sampling station II is surrounded by hilly terrain with agricultural activities ongoing on top of the hill. Station II is about 1 kilometer away from station III. Apart from the agricultural activities taking place uphill, there are noticeable no domestic activities at this point because of ease of accessibility.
• Station III It is the outlet i.e the receiving end/outflow of water in the reservoir that is toward the embankment of the reservoir. Station 3 is the deepest point of the reservoir close to the dam embarkment.
Determination of Physicochemical Parameters
Water Samples were collected monthly for a period of twenty-four months (January 2018 - December, 2019). Water samples were collected between the hours of 6:00am - 10:00amrandomly at intervals then a composite sample was made at each station. Samples were labelled accordingly while water samples for plankton studies were fixed immediately. Water Samples was transported and analyzed in Biology laboratory, University of Abuja and Labchemjan. Laboratory, Abuja. Temperature, pH, Electrical Conductivity and Dissolved Oxygen were measured insitu using a portable Hanna instrument Model Hi9198 multi parameter meter. The probe was inserted directly into the water for about
2-3 minutes while the readings in the meter was recorded Transparency was measured using a secchi disc while BOD5, Turbidity, Nitrate-Nitrogen, Phosphate-phosphorus, Iron and Lead was determined using described by [8].
Calculation of WQI This was carried out using the Horton’s method. This is expressed as:
$$ W Q I = \Sigma q n W n / \Sigma W n $$
(1) Where, qn = Quality rating of nth water quality parameter. Wn= Unit weight of nth water quality parameter. Quality rating (qn) = [(Vn - Vid) x 100 (Sn- Vid)] (2) Where, Vn = Estimated value of nth water quality parameter at a given sample location. Vid = ideal value for n th parameter in pure water.(Vid for pH = 7 and 0 for all other parameters) Sn = Standard permissible value of nth water quality parameter. Unit weight The unit weight (Wn) is expressed as:
Wn = K /Sn (3) Where, Sn = Standard permissible value of n th water quality parameter. k = Constant of proportionality and is given as:
$$ k = \left[ 1 / \left(\Sigma 1 / S n = 1, 2, \dots n\right) \right] $$
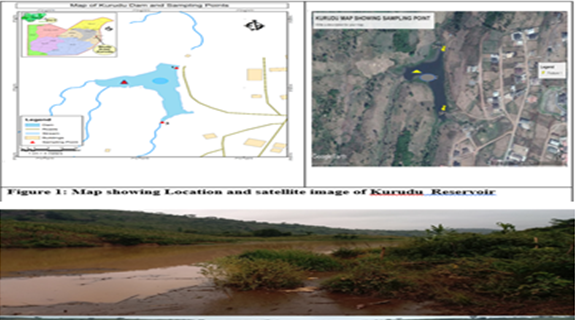
Plate: Fieldwork, 2019 Figure 1: Map showing location and satellite image of kurudu reservoir.
Results
The results of physico-chemical parameters of surface water in Kurudu Reservoir are summarized in (Tables 1 & 4).
Temperature values ranged from 22.1-29.0ºC with a mean value of 23.8±0.18ºC (Table 1), in the sampling stations, station 2 recorded the lowest value (25.0±0.1ºC) while the highest value (25.2±0.2ºC) was recorded in Station 1 (Table 2). Monthly mean temperature values in the months of January, February, July-September, November- December (22.3±0.0 - 23.7±0.1) and in the month of March- June (25.0±0.0 - 28.1±0.0) were not significantly different but where significantly different from other months. The highest monthly mean temperature was recorded in the month of March (28.1±0.0ºC) while the lowest monthly mean temperature was recorded in the month of January (22.3±0.2ºC) as shown (Table 4). pH values ranged from 6.1-
7.1 with a mean value of 6.9±0.3 (Table 1), in the sampling stations, pH values were steady in all stations (6.8±0.1) except in Station 3 where pH values varied slightly to 6.9±0.1 (Table 2). Monthly mean pH values in Kurudu reservoir progressed steadily with slightly acidic values (6.7±0.2 - 6.9±0.2) except in the month of April and May when pH varied towards slightly alkaline values (7.3±0.1 ¬- 7.4±0.1). The highest monthly mean pH was recorded in the month of May (7.4±0.1) while the lowest monthly mean pH was recorded in the month of March and August (6.7±0.1) as shown (Table 4).
Secchi Depth (transparency) recorded a range of 0.3- 1.2m with a mean value of 0.9±0.2m (Table 1), in the sampling stations, secchi depth values was steady (0.9±0.1m) in all stations (Table 2). Monthly mean secchi depth in the month of April, July- December (0.4±0.0 -1.1±0.0) and in the month of January-March, May and December (1.2±0.1 - 1.5±0.1) progressed steadily and were not significantly different but were significantly different compared to other months. Monthly mean secchi depth was highest in the month of January and March (1.5±0.0) while lowest monthly mean secchi depth was recorded in the month of August (0.4±0.0) as shown in Table 4.
Turbidity values fluctuated between 8.8-99.0 NTU with a mean value of 40.1±13.4NTU (Table 1), in the sampling stations, turbidity values in station 1 and 2 progressed steadily (24.2±1.3NTU) in station 3, turbidity increased slightly to 24.3±1.1NTU (Table 2). Monthly mean turbidity values in the months of January-May November and December (9.6±0.9 -12.0±1.0) and in the month of June, July and October (21.1±4.6-40.1±5.0) was not significantly different, but where different from other months. Also, turbidity values in the months of August and September (71.1±16-95.0±3.6) was elevated and significantly different from other months. Monthly mean turbidity values were highest (95.0±3.6) in the month of August while the lowest values (9.6±0.9) were recorded in the month of February.
Electrical Conductivity values indicated a range of 97.6- 238.8µS/cm with a mean value of 166.0±17.2µS/cm (Table 1), in the sampling stations, electrical conductivity was lowest in Station 2 (161.1 ±3.0µS/cm) and highest in station 1 (172.2±4.2µS/cm) as shown in Table 2. Monthly mean EC fluctuated throughout the months, in the months of May- October (116.8±16.7- 138.9±2.10) and January, November- December (166.6±4.1- 172.5±7.2) were not significantly different but where significantly different from other months, increased EC values recorded in the month of February-April (184.8±13.4-190.2±6.5) were not significantly different but where significantly different from other months. The highest (190.2±6.5) monthly mean EC was recorded in the month of March while the lowest monthly mean EC was recorded in the month of August (116.8±16.7) as shown in Table 4.
Dissolved Oxygen values ranged from 4.0-7.9mg/l with a mean value of 6.0±0.3mg/l (Table 1), in the sampling stations, dissolved Oxygen recorded the lowest value of 5.9±0.1mg/l while the highest value was recorded in Station 3 (6.1±0.1mg/l) as shown in Table 2. Monthly mean DO in the month of July-September (4.3±0.3-5.3±0.2) and January, October-December (5.7±0.2 - 6.9±0.2) were not significantly different but was significantly different from other months. Also, in the month of February-June (7.0±0.1- 7.6±0.6) increased DO values was recorded but were not significantly different but was significantly different from other months. Monthly mean DO values was in the month of June (190.2±6.5) while the lowest DO values was recorded in the month of August (4.3 ±0.3).
Biochemical Oxygen Demand (BOD) fluctuated between 2.0-8.0mg/l with a mean value of 3.2±0.3 mg/l (Table 1), in the sampling stations, Biochemical Oxygen Demand did not vary in all stations (3.2±0.1mg/l) except in Station 3 where BOD values varied slightly to 3.4±0.1mg/l (Table 2). Monthly mean BOD values was not significantly different in the months of January-March, November-December (2.0±0.0) and in the months of April, May, July, August (3.1±0.1-4.4 ±0.4) but where significantly different from other months. Also, in the months of January and October were not significantly different but was significantly different from other months (4.4 ±0.4- 5.0 ±0.0). Also, in the month of September-October (5.0±0.0-7.6±0.6) increased DO values was recorded but were not significantly different but was significantly different from other months. The highest monthly mean BOD values were recorded in the month of September (7.6 ±0.6) while the lowest BOD value was recorded in the months of January- march, November and December (2.0 ±0.0).
Nitrate values ranged from 1.8-12.0 mg/l with a mean value of 6.1±0.4mg/l (Table 1), in the sampling stations, Nitrate values in was steady in all stations (6.2 ±0.0mg/l) except in Station 3 where nitrate values varied slightly to 6.0±0.0 mg/l (Table 2). Monthly mean Nitrate values fluctuated steadily throughout the months except in the month of July when monthly mean nitrate values were lowest (3.9±0.9 mg/l) and in the month of September (10.8±1.1mg/l).) when the highest monthly mean Nitrate was recorded (Table 4).
Phosphate values ranged from 0.1-12.0 mg/l with a mean value of 0.2±0.0 mg/l (Table 1), Phosphate values was steady in all stations (0.2±0.0 mg/l) except in Station 1 (0.3±0.0 mg/l) as shown in Table 2. Phosphate values were not significantly different throughout the months (0.1±0.0mg/l) except in the month of June-August (0.5±0.0- 0.8±0.2). Monthly mean Phosphate values was highest in the month of July (0.8±0.2 mg/l) as shown in Table 4.
Iron concentration ranged from 0.0-0.6mg/l with a with a mean value of 0.1±0.0mg/l (Table 1), in the sampling stations, iron concentration was also steady in all stations (0.2±0.0m) as shown in Table 2. Iron values were not significantly different throughout the months (0.1±0.0mg/l) except in the month of August (0.4±0.2). When monthly mean Iron values was highest (Table 4). Lead concentration was below the detection limit.
Pearson’s correlation analysis is shown in Table 5. Temperature-transparency (r = 0.592), temperature-EC (r = 0.652), transparency-EC (r = 0.789), turbidity-BOD (r = 0.835) and turbidity- Fe2+ (r = 0.665) had a positive significant relationship whereas temperature-turbidity (r = -0.659), temperature-Fe2+(r = -0.758), temperature-PO4 (r = -0.537) transparency-turbidity (r = -0.938), transparency- BOD (r = -0.880), turbidity- Fe2+ (r = -0.513), turbidity-EC (r = -0.728), EC-Fe2+ (r = -0.547), DO-BOD (r = -0.547) and nitrate- phosphate (r = -0.804) had a negative significant relationship. pH and dissolved oxygen values had no significant positive or negative correlation with other physicochemical parameters Seasonal mean values of physicochemical parameters as shown in Table 4 indicated that during the wet season, pH, turbidity, BOD, phosphate and Iron values were higher during the wet season while temperature, transparency, EC, DO and Nitrate levels were higher in dry season.
Analysis of variance (ANOVA) of mean physicochemical parameters between stations and months were not significantly different (P>0.05) as shown by the p-value in Table 2. However, ANOVA of seasonal mean values of turbidity, transparency, EC, Phosphate and Iron values were significantly different (P>0.05).
| Parameters | Range | Mean ±S. E | p-value (stations) | p-value (months) | p-value (season) | WHO LIMITS |
|---|---|---|---|---|---|---|
| Temperature (ºC) | 22.1-29.0 | 23.8±0.18 | 0.88 | 0.681 | 0.888 | < 40ºC |
| pH | 6.1-7.1 | 6.9 ± 0.3 | 0.96 | 0.88 | 0.802 | 6.0-9.0 |
| Secchi depth (m) | 0.3-1.2 | 0.9± 0.2 | 0.97 | 0.66 | <0.001* | |
| Turbidity (NTU) | 8.8-99.0 | 40.1±15.5 | 0.99 | 0.67 | <0.001* | <25 NTU |
| EC (µS/cm) | 97.6-238.8 | 166.0±17.2 | 0.59 | 0.78 | 0.0863 | <1000 µS/cm) |
| DO (mg/l) | 4.0-7.9 | 6.0±0.2 | 0.96 | 0.53 | 0.00482* | 5.0-9.0mg/L |
| BOD (mg/l) | 2.0-8.0 | 3.2 ± 0.3 | 0.99 | 0.17 | 0.015 | 3.0-6.0mg/L |
| Nitrate (mg/l) | 1.8-12.0 | 6.1 ± 0.4 | 0.91 | 0.6 | 0.37393 | 5mg/L |
| Phosphate (mg/l) | 0.1 ± 1.0 | 0.2 ± 0.0 | 0.96 | 0.39 | <0.001* | 0.1mg/L |
| Iron (mg/l) | 0.0 ± 0.6 | 0.1 ± 0.0 | 0.99 | 0.99 | 0.11582 | 0.3mg/L |
| Lead (mg/l) | 0.0-bdl | 0.0-bdl | - | - | 0.1mg/L |
Table 1: Range, Mean, P-value of physicochemical Parameters of Surface water in Kurudu reservoir.
| STATION 1 | STATION 2 | STATION 3 | |
|---|---|---|---|
| Temperature (°C) | 25.2 ± 0.2 | 25.0 ± 0.1 | 25.1 ± 0.2 |
| pH | 6.8 ± 0.1 | 6.8 ± 0.1 | 6.9 ± 0.1 |
| Secchi depth (m) | 0.9 ± 0.1 | 0.9 ± 0.1 | 0.9 ± 0.1 |
| Turbidity (NTU) | 20.0 ± 1.2 | 18.7 ± 1.0 | 20.6 ± 1.3 |
| EC (μS/cm) | 172.2±4.2 | 161.1±3.2 | 164.6±4.0 |
| DO (mg/l) | 6.1 ± 0.1 | 6. ± 0.1 | 5.9 ± 0.1 |
| BOD (mg/l) | 3.2 ± 0.1 | 3.2 ± 0.1 | 3.4 ± 0.1 |
| Nitrate (mg/l) | 6.2 ± 0.0 | 6.2 ± 0.1 | 6.0 ± 0.0 |
| Phosphate (mg/l) | 0.3 ± 0.0 | 0.2 ± 0.0 | 0.2 ± 0.0 |
| Iron (mg/l) | 0.2 ± 0.0 | 0.2 ± 0.0 | 0.2 ± 0.1 |
Table 2: Mean ± SD Variation of physicochemical Parameters in all stations sampled in Kurudu and Karshi Reservoir.
| pH | Temp | Transparency | Turbidity | EC | DO | BOD | NO - 3 | PO - 4 | Fe2+ | |
|---|---|---|---|---|---|---|---|---|---|---|
| pH | 1 | |||||||||
| Temp (0C) | 0.241 | 1 | ||||||||
| Transparency (m) | 0.071 | 0.592* | 1 | |||||||
| Turbidity (NTU) | -0.171 | -0.659* | -0.938* | 1 | ||||||
| EC (µS/cm) | -0.156 | 0.652* | 0.789* | -0.728* | 1 | |||||
| DO(mg/l) | -0.164 | -0.07 | 0.264 | -0.177 | 0.217 | 1 | ||||
| BOD (mg/l) | 0.027 | -0.399 | -0.880* | 0.835* | 0.793* | -0.500* | 1 | |||
| NO - (mg/l) 3 | -0.004 | 0.366 | 0.085 | 0.04 | -0.028 | 0.278 | 0.118 | 1 | ||
| PO - (mg/l) 4 | -0.299 | -0.537 | -0.425 | 0.324 | -0.174 | -0.447 | 0.267 | -0.804* | 1 | |
| Fe2+ (mg/l) | 0.007 | -0.758* | -0.513 | 0.665* | -0.547 | 0.045 | 0.371 | -0.09 | 0.171 | 1 |
Table 3: Pearson’s correlation coefficient between various physicochemical parameters.
| Months | Temperature (ºC) | pH | Secchi depth (m) | Turbidity (NTU) | EC | DO (mg/l) | BOD (mg/l) | Nitrate (mg/l) | Phosphate (mg/l) | Iron (mg/l) |
|---|---|---|---|---|---|---|---|---|---|---|
| JAN | 22.3±0.2a | 6.8±0.1a | 1.5±0.0b | 11.0±0.0a | 166.6±4.1b | 6.1 ±0.1b | 2.0 ±0.0 a | 6.3 ±0.1b | 0.1 ±0.0 a | 0.1 ±0.0 a |
| FEB | 23.6±0.0a | 6.8±0.1a | 1.2±0.0b | 09.6±0.9a | 184.8±13.4ab | 7.1 ±0.1ab | 2.0 ±0.0a | 6.3 ±0.2 b | 0.1 ±0.0 a | 0.1 ±0.0 a |
| MAR | 28.1±0.0b | 6.7±0.2a | 1.5±0.0b | 10.5±0.5a | 190.2±6.5 ab | 7.0 ±0.1ab | 2.0 ±0.1a | 6.7 ±0.1 b | 0.1 ±0.0 a | 0.1 ±0.0 a |
| APR | 27.2±0.2b | 7.3±0.1b | 1.4±0.0a | 11.0±0.0a | 184.9±9.7 ab | 7.0 ±0.1ab | 3.1 ±0.1b | 6.3 ±0.2 b | 0.1 ±0.0 a | 0.1 ±0.0 a |
| MAY | 26.6±0.2b | 7.4±0.1b | 1.2±0.1b | 12.0±1.0a | 137.5±12.1a | 7.4 ±0.5ab | 3.9 ±0.1b | 6.6 ±0.2 b | 0.1 ±0.0 a | 0.1 ±0.0 a |
| JUN | 25.0±0.0b | 6.9±0.0a | 0.6±0.0a | 32.8±2.0b | 135.9±8.60a | 7.6 ±0.6ab | 4.4 ±0.4b | 5.1 ±0.3 b | 0.8 ±0.2ab | 0.1 ±0.0 a |
| JUL | 23.6±0.3a | 6.9±0.0a | 0.5±0.0a | 21.1±4.6b | 130.9±16.7a | 5.0 ±0.0a | 3.7 ±0.3b | 3.9 ±0.9 a | 0.6 ±0.2 b | 0.1 ±0.0 a |
| AUG | 23.0±0.0a | 6.7±0.2a | 0.4±0.0a | 95.0±3.6ab | 116.8±16.7a | 4.3 ±0.3a | 3.7 ±1.2b | 5.1 ±0.2 b | 0.5 ±0.0 b | 0.4 ±0.2b |
| SEPT | 23.4±0.2a | 6.9±0.0a | 0.5±0.0a | 71.1±16.ºC | 138.9±2.10a | 5.3 ±0.2a | 7.6 ±0.6ab | 10.8 ±1.1ab | 0.1 ±0.0 a | 0.1 ±0.0 a |
| OCT | 24.8±0.0b | 6.8±0.1a | 0.6±0.0a | 40.1±5.0b | 144.9±11.5a | 5.7 ±0.2b | 5.0 ±0.0ab | 5.4 ±0.5 b | 0.1 ±0.0 a | 0.1 ±0.0 a |
| NOV | 23.5±0.2a | 6.8±0.1a | 1.1±0.0a | 11.8±0.3a | 172.5±7.2b | 6.9 ±0.2b | 2.0 ±0.0a | 6.6 ±0.6 b | 0.1 ±0.0 a | 0.1 ±0.0 a |
| DEC | 23.7±0.1a | 6.9±0.2a | 1.2±0.1a | 12.0±1.0a | 162.2±7.2b | 5.7 ±0.2b | 2.0 ±0.1a | 6.3 ±0.2 b | 0.1 ±0.0 a | 0.1 ±0.0 a |
| WET SEASON | 24.9 ± 0.5 | 6.9 ±0.0 | 0.8 ± 0.3 | 28.1±17.3 | 161.5±27.4 | 5.7 ± 0.2 | 3.9± 0.8 | 5.7 ± 0.3 | 0.4±0.0 | 0.2 ±0.0 |
| DRY SEASON | 26.1 ± 1.4 | 6.7 ±0.2 | 1.0 ± 0.1 | 11.0±0.0 | 192.7±15.8 | 6.6 ± 0.1 | 2.1± 0.1 | 6.5± 0.0 | 0.1±0.0 | 0.1 ±0.0 |
Table 4: Monthly and Seasonal Mean ± (SE) of Physicochemical Parameters in Kurudu Reservoir.
| Parameters | Estimated value of parameter (Vn) | Parameters of Std values (Sn) | Ideal value of parameter (Vid) | k value | Unit Weight | ||
|---|---|---|---|---|---|---|---|
| (Wn) | qn | qnWn | |||||
| pH | 6.9 | 7.5 | 7 | 0.04 | 0.01 | -500 | -2.76 |
| Temp (oC) | 23.8 | 40 | 0 | 0.04 | 0 | 168 | 0.17 |
| Transparency(m) | 1.2 | 0 | 0 | 0.04 | 0 | 0 | 0 |
| Turbidity (NTU) | 40.1 | 25 | 0 | 0.04 | 0 | 62.3 | 0.1 |
| EC (µS/cm) | 166 | 1000 | 0 | 0.04 | 0 | 602 | 0.02 |
| DO (mg/l) | 6 | 4.5 | 14.6 | 0.04 | 0.01 | 117 | 1.08 |
| BOD (mg/l) | 3.2 | 3 | 0 | 0.04 | 0.01 | 93.8 | 1.3 |
| N-N03 (mg/l) | 6.1 | 5 | 0 | 0.04 | 0.01 | 82 | 0.68 |
| P-P04(mg/l) | 0.2 | 0.1 | 0 | 0.04 | 0.41 | 50 | 20.72 |
| Fe2+ (mg/l) | 0.1 | 0.3 | 0 | 0.04 | 0.14 | 300 | 41.44 |
| Pb2+ (mg/l) | 0 | 0.1 | 0 | 0.04 | 0.41 | 0 | 0 |
Table 5: Computed water quality Index (Horton’s method) of Kurudu Reservoir.
WQI for Kurudu Reservoir = 62.35, Status= Average quality. Table 5: Computed water quality Index (Horton’s method) of Kurudu Reservoir.
| water quality status | Indications | |
|---|---|---|
| 91-100 | Excellent | Support high diversity of aquatic life, suitable for all forms of recreation |
| 71-90 | Good Water | Support high diversity of aquatic life, suitable for all forms of recreation |
| 51-70 | Average | Less diversity of aquatic organisms, probability of frequent increase in algal growth, Conventional treatment required |
| 26-50 | Fair | Low diversity of aquatic life, probably experiencing problems with pollution |
| 0-25 | Poor | Support limited number of aquatic life, significant quality issues |
Table 6: WQI table of interpretation.
Discussion
In Kurudu reservoir, water temperature was lower throughout the wet seasons and during the harmattan period, Low water temperatures recorded during this period could be attributed to seasonal changes in temperatures caused by the harmattan winds as well as the rainy season; seasonal mean temperatures were higher during the dry season. These observations were lower than those recorded by Echoke, et al. [9] in Usuma reservoir, Solomon RJ, et al. [10] in Jabi lake, Banyigyi [11] in Doma reservoir, Yusuf, et al. [12] in Nassarawa reservoir, Kastina. The temperature in the reservoir was within the WHO’s recommended range for aquatic life growth.
pH is a very important water quality parameter because of the integral role it plays in biochemical reactions. A low pH values can occur in dilute waters with larger concentrations of dissolved organic compounds meanwhile a higher value can also occur in eutrophic waters, however, pH values in Kurudu reservoir are compatible with pH values in natural waters (6.5 to 8.5). Although the pH was somewhat acidic, the reservoir’s mean pH readings were close to neutral. Similar findings were observed in certain Nigerian water bodies by Abdulazeez, et al. [13] and Anago, et al. [14]. pH Values was likewise within WHO limit thus were good for the growth of aquatic living.
Although turbidity and transparency are measured differently, they both measure the clarity of a water body. The lesser the transparency (secchi depth), the higher the observed turbidity. The washing silt, sediments, debris, organic and inorganic suspended particles rushed into the reservoir by flood and surface run-off, especially during the rainy season, may be linked to the high turbidity values reported during the rainy season.
Increased water temperatures, reduced dissolved oxygen, reduced light penetration, which reduces photosynthesis and thus primary productivity, and the many problems associated with erosion, storm water/runoff pollution, and excessive algal growth are all caused by high turbidity values.
This result is similar with the findings of by Echoke, et al. [9] in Usuma reservoir, Dan kishiya, et al. [15] Banyigyi [11] in doma reservoir, Yusuf, et al. [12] in Nassarawa reservoir, Kastina.
According to Anago, et al. [14], conductivity levels below 50 mhos/cm are considered low, those between 50 and 600 mhos/cm are considered medium, and those above 600 mhos/cm are considered high conductivity. However, according to Boyd [16], natural water normally has conductivity ranges between 20 and 1500 S/cm. Kurudu’s electrical conductivity indicates a medium level of conductivity. The presence of organic matter pollution, other effluents, run-off with high suspended particles, and heavy rainfall increased electrical conductivity values sharply during the wet season, which could be attributed to the presence of organic matter pollution, other effluents, run-off with high suspended particles, and heavy rainfall. However, seasonal mean Electrical conductivity values was greater in dry season.
Dissolved oxygen is critical for aquatic life’s existence, particularly for the larger creatures in the aquatic food web. The quality of the dissolved oxygen showed that it will support aquaculture output. The high oxygen value for the dry season coincides with periods of lowest turbidity, and the cool harmattan wind, which increases wave action and lowers surface water temperature, may have contributed to the increased oxygen concentration during the dry season, whereas the torrential rains created increased turbidity and decreased oxygen concentration during the rainy season. The findings of this study were comparable to those of Jabi lake [17], Kishiya D, et al. [18] and Doma reservoir Banyigyi [11] kishiya D, et al. [18]. Solomon, et al. [10] in Jabi lake and Echoke, et al. [9] in Usuma reservoir reported a higher DO. All of the stations studied in Kurudu reservoir had biochemical oxygen demand values ranging from 2.0mg/l to 8.0mg/l. increased sedimentation, a substantial input of organic materials, and subsequent biodegradation of organic materials raise BOD by exerting oxygen tension in the water. BOD levels were higher in both reservoirs during the wet season, owing to a large amount of water flowing into the reservoir during the rainy season, causing oxygen to be utilized more quickly by the microbial community. In both reservoirs, the seasonal mean BOD was greater during the rainy season.
Nutrients concentration includes mainly Nitrate and phosphate, nitrates levels in the reservoir was over WHO Limit. The relatively high values of Nitrate recorded in this study could be attributed to runoff water which contain fertilizers and manure from agricultural land, industrial effluents, sewage and wastewater especially in in station 1. This finding exceeded those of Echoke, et al. [9] in the Usuma reservoir and Abdulazeez, et al. [13] in the Nasarawa Karidna reservoir in Kaduna. Mean values of Phosphate and Iron levels was within WHO limits, however during the wet season, elevated levels were recorded.
Table 5 shows that the computed water quality index for Kurudu Reservoir was 62.35, indicating that the reservoirs have “average” water quality, with class II contamination, which indicates moderate pollution, particularly during the rainy season. Average water quality supports a limited diversity of aquatic life (in comparison to what may be found in good and excellent water quality, see Table 5), indicating that pollution is a concern. If the water is to be recommended for drinking or other home purposes, it must undergo conventional treatment.
Conclusion
Limnological assessment of surface water in Kurudu reservoir was conducted with the view to contribute some knowledge on some aspect physico-chemical parameter. For a better understanding of abiotic interaction, this study investigated stations, monthly and seasonal variations of each limnological parameter, as well as the link between the physicochemical parameters. Physico-chemical parameters are influenced by lithological, morphological, and climatic properties, among other things, as seen in many waterbodies. Seasonal fluctuations had a substantial impact on transparency, turbidity, dissolved oxygen, and phosphate in this study. Kurudu reservoir physico-chemical characteristics were within WHO permitted limits. During the rainy season, however, turbidity, nitrate, and phosphate levels spiked. Kurudu Reservoir’s water quality was moderate, making it acceptable for agriculture.
Recommendation
Adequate, effective and consistent monitoring of the reservoir and regulation of activities in and around the reservoir should be of utmost priority to detect early warning signs and forestall further deleterious deterioration of its WQI. Also water from the reservoir should be treatment before consumption. If the water is to be recommended for drinking or other home purposes, it must undergo conventional treatment.
References
-
Alberta Water Portal Society AWPS (2015) What are Dams and Reservoirs?.
-
Gbaguidi HMAG, Adite A, Sossoukpe E (2016) Feeding Ecology and Establishment of the Naturally-Colonized Freshwater Cichlid, Sarotherodon galilaeus (Pisces: Actinopterigii: Perciformes) from a Man-Made Lake, South-Benin. West Africa Natural Resources 7: 337-355.
-
Hundey EJ, Russell SD, Longstaffe FJ, Moser KA (2016) Agriculture causes nitrate fertilization of remote alpine lakes. Nat Commun 7: 10571.
-
Stauffer B, Carle N, Spuhler D (2019) Man-made Reservoirs. Sustainable Sanitation and Water Management Toolbox.
-
Boix D, Jeremy B, Regis C, Andrew H, Thomas K, et al. (2012) Pond research and management in Europe: Small is Beautiful. Hydrobiologia 689: 1-9.
-
Le Viol I, Chiron F, Julliard R, Kerbiriou C (2012) More amphibians than expected in highway stormwater ponds. Ecol Eng 47: 146-154.
-
Joshua NH, Nazrul I (2015) Water Pollution and its Impact on the Human Health. Journal of Environment and Human 2(1): 36-46.
-
American Public Health Association (APHA) (2012) Standard method for the examination of water and waste water.22nd (Edn.), American Public Health Association. Washington, USA, pp: 1-541.
-
Echoke JCRW, Nadana, Idowu RT (2018) Water Quality Index as a Tool for the Assessment of the Health of Usuma Reservoir, in FCT Abuja Nigeria. Direct Res J Public Health and Environ Technol 3(6): 73-80.
-
Solomon RJ Babatunde A (2017) Kidney Analysis of Clarias Gariepinus in Relation to Weight from Jabi Lake, FCT, Abuja, Nigeria. Journal of Biology and Biotechnology 3(1): 24-32.
-
Banyigyi HA (2017) Physico-Chemical Parameters and Fish Diversity of Doma Reservoir, Nasarawa State, Nigeria. Department of biology.
-
Yusuf, Zahraddeen (2020) Phytoplankton as bioindicators of water quality in Nasarawa reservoir, Katsina State Nigeria. Acta Limnologica Brasiliensia 32: e4.
-
Abdulazeez MT, Bello AH, Alhassan N, Wada, Yusuf (2017) Relationship between physicochemical parameters and zooplanktons in Karidna reservoir, Kaduna state. Bayero Journal of Pure and Applied Sciences 10(1): 1-664.
-
Anago IJ, Esenowo IK, Ugwumba AAA (2013) The Physico-Chemistry and Plankton Diversity of Awba Reservoir, University of Ibadan, Ibadan Nigeria. Research Journal of Environmental and Earth Sciences 5(11): 638- 644.
-
Dan kishiya AS, Chiaha NQ (2012) Physico-Chemical Parameters of Some Selected Stations in Lower Usuma Reservoir Bwari, Nigeria. Report and Opinion 4(2): 1-6.
-
Boyd CE (1990) Water quality management for pond fish culture. Agriculture Experimental Station, Auburn University, Alabama, pp: 215.
-
Ezeamaka CK, Queen S, Mwanret D, Moses O, Wado AT (2019) Assesing the pollution status of Jabi lake, In FCT, Abuja Nigeria. Indonesia Journal of Geography 51(3): 324-331.
-
Dan kishiya AS, Olatunde AA, Balogun JK (2013) Variation in the concentration of dissolved oxygen (DO) and hydrogen ion (pH) at the surface of a tropical reservoir: a case study of lower Usuma reservoir in Bwari Abuja, Nigeria. American Journal of Research Communication 1(9): 204-214.
- Genetic Improvement of Nile Tilapia (Oreochromis niloticus): Advances in Selective Breeding and Genomic Approaches for Sustainable Aquaculture
- Microplastics, Contaminants, and Waste Hotspots: Divergences and Faults in Prioritizing Control Efforts
- Creating a Healthier, More Vibrant Open and Closed Aquatic Environment. A Submersible, Centrifugal Magnetically Affixed Current Changing Aquarium Pump
- An Attempt to Assess Alpha Diversity and Sample Size: Using the Ostracod Assemblages off Kumamoto Port, Japan
- Assessment of the Efficiency of Common Fishing Gears and Crafts Used at Mohananda River of Chapai Nawabganj, Bangladesh
- Fish Productivity and Biodiversity Status of Sundarban Mangrove in Bangladesh