Phytoplankton Species in Linkage to Water Quality and Landsat Data Indices at the Southern Part of Burullus Lake, Egypt
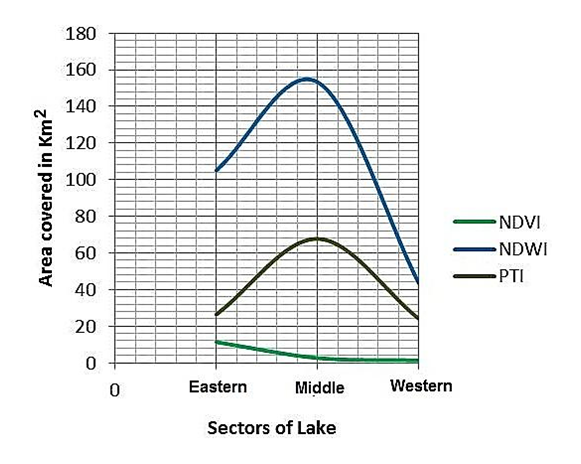
In aquatic ecosystems, phytoplankton assemblages are mostly affected by different water quality parameters. In March 2020, water and phytoplankton samples were collected from seven geo-referenced stations distributed along the southern part of Lake Burullus, in front of drains. Physio-chemical parameters (temperature T°C, pH, dissolved oxygen DO, Salinity, nitrite NO2, phosphate PO4, ammonia NH4, and silicates SiO4) were analyzed in water samples. Phytoplankton samples were collected using a net mesh of a size of 20 μm. The most abundant classes are Chlorophyceae, Cyanophyceae, and Euglenophyceae in stations 7, 2, and 6, respectively. The difference between classes and species is based on the different discharge of wastes, the high load of organic matter, and salinity. Results of the average water quality index AWQI showed low water quality in front of drainage waters. The vegetative cover increases on the eastern side. Landsat images were acquired, treated, and processed for concluding three important indices along with the three sectors of the lake. These indices are normalized difference vegetation index (NDVI), normalized difference water index (NDWI), and phytoplankton turbidity index (PTI). The NDVI showed that the vegetation-covered areas of about 11.3, 2.6, and 1.36 km2, and NDWI showed water areas of about 105.09, 153.25, and 43.57 km2 for eastern, middle, and western parts, respectively. PTI indicated that nearly 55.3% of phytoplankton turbidities concentrated towards the western side of the lake, followed by 44.21% at the middle part and 25.14 % on the eastern side. It is concluded that water quality nearby drains are bad, where the phytoplankton turbidities as observed from Landsat images were increased towards the southwestern parts.
Introduction
The phytoplankton community, which plays a central role in the structure and functioning of freshwater ecosystems, its distribution is impacted by the water physicochemical parameters [1, 2]. Phytoplankton assemblage in aquatic ecosystems is influenced by environmental changes and threats, in addition, they have a short life span and quick response to these changes [3, 4]. Aquatic ecosystems receive huge amounts of wastewater from drains and other sources like urban, agricultural, run-off, industrial effluents; therefore continuous monitoring of water quality and biodiversity is a must especially in aquatic systems that aid in income resources.
Researchers mostly focused on over-fertility waters (i.e. lakes and rivers) where toxic blue-green algae may distribute. These pose a great threat to aquatic systems and life [5]. So the eutrophication processes are clear in such areas characterized by the dominance of blue-green in the phytoplankton community [6]. In previous studies, the composition and distribution of phytoplankton in lakes and analysis of phytoplankton strongly indicate the dominance of blue-green algae [7]. Other studies pointed out that the structure and distribution as well as quality and quantity of the phytoplankton depend in part on the nutrient load, they respond to low dissolved oxygen levels, high nutrient levels, toxic contaminants. Therefore, the water quality assessment in systems is linked to the number or diversity of taxa from different phytoplankton groups [8]. A rich plankton community of reservoirs is can be attributed to biotic factors and nutrient load variability [9]. Any increase of nutrient inputs leads to enhance the productivity of phytoplankton as they constitute the very basis of the nutritional cycles of the aquatic ecosystem and they form a bulk of food for fish and other aquatic organisms.
Water quality index (WQI) can tell us whether the overall quality of water bodies may possess a potential threat to various uses of water as habitat for aquatic life, irrigation water for agriculture and livestock, recreation and aesthetics, and drinking water supplies. The advantages of WQI include its ability to single number, its ability to combine various parameters in a variety of different measurement units in a single metric, and its effectiveness as a communication tool [10, 11]. Remote sensing applications provide the significance of focusing the area of interest that has a significant thermal effect and allow the distinction between areas with low turbidity and high turbidity zones [12]. The normalized difference vegetation index (NDVI) resultant indices are based on plant pigment absorption there are other indices that try to discriminate vegetation parameters such as water content and the amount of non-photosynthetic vegetation. The normalized difference water index (NDWI) is a good indicator of soil and vegetation water content [13]. Therefore, the present study aims to determine the impact of physio-chemical parameters on phytoplankton, testing water quality, and mapping phytoplankton turbidity along with the lake sectors from Landsat image data.
Materials and Methods
Phytoplankton Detection
For microscopic analyses of phytoplankton species, the water samples were preserved by using a 1% formalin solution after the filtration of samples through plankton net with a pore size of 20 microns. The samples were then transported to the lab for qualitative and quantitative analyses. The detailed methodology of phytoplankton count (units L-1) has been described according to Radwan, et al. [14]. Each species was identified according to the methods of Prescott [15], and identification of freshwater algae occurred within the methods of Prescott [16], identification of various other algae species occurred within the methodologies of Bold, et al. [17]; Vinard [18].
Water Chemistry
Some measurements are obtained in the field; temperature (°C) and dissolved oxygen which are measured using YK- 22 DO meter. While, pH value of surface water was measured using an electrical pH meter (Model Lutron YK-2001 pH meter), while electrical conductivity (EC), total dissolved solids (TDS), and salinity (S‰) were measured used directly using a conductivity meter (Model Corning, NY 14831 USA). Analysis of ammonia (NH4-N) and nitrite (NO2-N) was occurred according to Grasshoff, et al. [19]. The phytoplankton biomass was estimated as chlorophyll (a) according to the procedure given by Strickland and Parsons [20]. 500ml of surface water was filtered into a nitrocellulose membrane filter of pore size 0.45μm. Chlorophyll “a” was extracted in 90% acetone, measured at spectrophotometer and calculated using the score UNESCO equation ([(11.64 * E663) - (2.16 * E645) + (0.1 * E630)] *10 / V). The results were expressed as μg/L.
Sampling Stations and Study Area
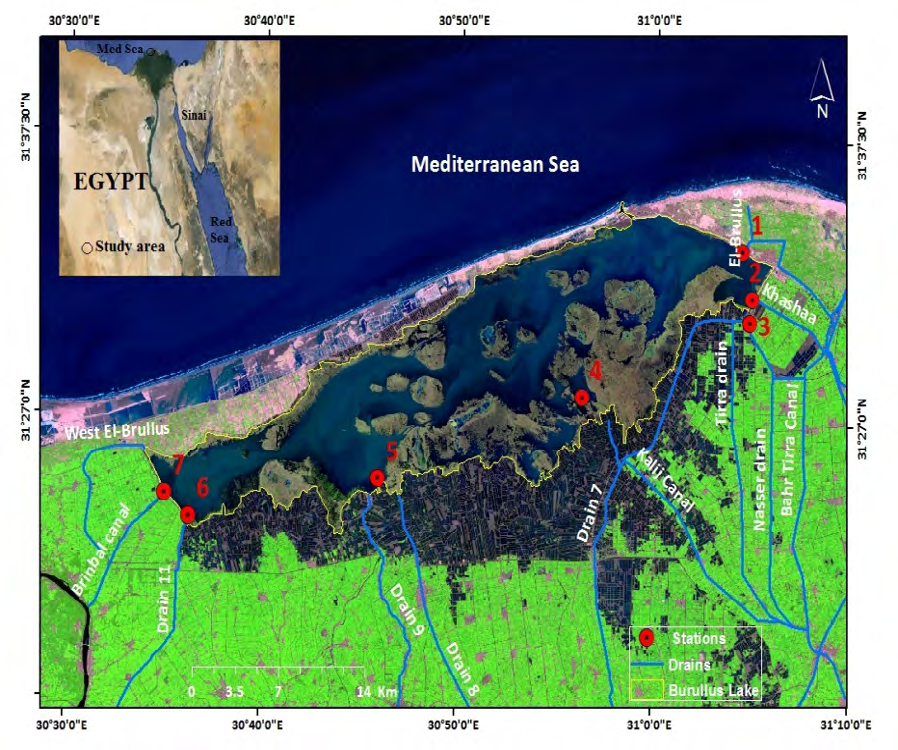
Lake Burullus is located along the Mediterranean Sea coast in the northern part of the Nile Delta. It is bordered from the north by the Mediterranean Sea and in the south part by agricultural lands. It has a total area of nearly 453 Km2 (108,000 feddan). The drainage system provides the lake with about 4.1 milliards m3 yr-1 discharges originated from the drains illustrated in Figure 1. Sampling took place during March 2020. The selection of important seven stations in front of drains in Lake Burullus was estimated accurately using GPS and recording latitude and longitude as in Table 1.
| Sector | Station No. | Station Name | Latitudes (N) | Longitudes (E) |
|---|---|---|---|---|
| Eastern Sector | 1 | El-Burullus drain (east) | 31ᵒ 33` 27.6 | 31ᵒ 04` 25.3 |
| 2 | El-Khashah drain | 31ᵒ 31` 42.4 | 31ᵒ 04` 56.0 | |
| 3 | Terra drain | 31ᵒ 30` 49.4 | 31ᵒ 04` 51.0 | |
| 4 | in front of drain 7 | 31ᵒ 27` 56.1 | 30ᵒ 56` 17.5 | |
| Middle Sector | 5 | El-Shakhloubah (drain 8 and 9) | 31ᵒ 24` 46.9 | 30ᵒ 45` 54.9 |
| Western Sector | 6 | in front of drain 11 (El-Hoks) | 31ᵒ 23` 15.5 | 30ᵒ 36` 15.3 |
| 7 | in front of Brimbal Canal | 31ᵒ 24` 06.0 | 30ᵒ 35` 00.4 |
Table 1: Latitudes and longitudes of the sampling stations at Lake Burullus.
Water Quality Index (WQI)
Water quality index (WQI) is a mathematical tool used to convert large capacities of water quality data into a single number that present water quality level. It is calculated as developed by Tiwari and Manzoor [21]. Usually, WQI ranges between (0 -100), and the higher numbers prove lower water quality. The quality rating qi, for the water quality parameter, can be determined as follow:
( ) i i i q =100 V / S (1)
Where Vi is the observed value of the parameter at a given sampling site and Si is the body water quality standard. Equation (1) ensures that qi = 100 if the observed value is just equal to its standard value. Therefore, the larger value of qi revealed polluted water. To calculate WQI, the quality rating qi corresponding to the parameter can be determined using equation (2). The overall WQI was:
1 WQI n
$$ I = \sum_ {i = 1} ^ {n} q _ {i} (2) $$
The average water quality index (AWQI) for n parameters was calculated using the following equation (3):
1 AWQI / n
$$ I = \sum_ {i = 1} ^ {n} q _ {i} / n \tag {3} $$
Where n = number of parameters. AWQI was categorized into 4 classes: good (0.0 - 100), medium (100 - 150), bad (150 - 200), and very bad (above 200).
Community Data Analysis
The dominancy value of phytoplankton species was determined according to the following equation [22]:
ni Dominance fi N =
Where ni is the abundance of species i, fi is the occurrence frequency of species i, and N is the total abundance. Taking into consideration that the dominant species was defined where the Dominance value ≥ 0.02 [23].
Shannon’s (H’) index was calculated according to the Shannon, et al. [24] equation:
s $$ \mathrm {H} ^ {\prime} = \sum_ {\mathrm {i} = 1} ^ {\mathrm {s}} \frac {\mathrm {n i}}{\mathrm {N}} \mathrm {x} \ln \frac {\mathrm {n i}}{\mathrm {N}} $$ i 1 Species Evenness (J΄) was calculated by using the following Heip [25] equation:
$$ J = H ^ {\prime} / \ln (s) $$
Where H΄ is the diversity index, S is the species number and ln is the natural logarithm.
Principle component analysis (PCA) was determined between different species and stations using the PAST program (multivariate statistical package, ver. 1.72).
Landsat Data Indices
Phytoplankton Turbidity Index
The image acquisition was from http://glovis.usgs.gov/ Path (177) and (Row 38). This is for calculating an index of phytoplankton turbidity as the following equation [26]:
Phytoplankton Turbidity Index
$$ x = B 2 / \log B 4 + 1 $$
Band2 (B2): Blue and Band 4 (B4): Red bands First, the downloaded image was treated and converted from digital number DN into reflectance Application of band ratios in ArcGIS is to conclude the distribution of phytoplankton turbidity along with three sectors of the lake.
Normalized Difference Vegetation Index (NDVI)
NDVI is used for the identification of vegetation cover in the lake. It is can be applied using ERDAS Imagine or by using ArcGIS. Its value ranged between -1 and 1 based on vegetation density. Where dense vegetation areas have values of NDVI are close to one and poor vegetated areas will have NDVI values close to zero [27].
$$\text{NDVI} = \frac{(\text{B5} - \text{B4})}{(\text{B5} + \text{B4})}$$
B5: Infrared and B4: Red
Normalized Difference Water Index (NDWI)
NDWI was applied using ERDAS or ArcGIS programs. It is the difference between green and infrared bands. NDWI reflects water cover from -1 and 1 and it resembles high water that values close to 1 [28]. NDWI for Landsat OLI8 is calculated as follow:
$$\text{NDWI} = \frac{(\text{B3} - \text{B5})}{(\text{B3} + \text{B5})}$$
B3: Green and B5: Infrared
Results and Discussion
The aquatic ecosystem is consisting of hydro-chemical and biological variables, which are extremely complex partly due to the strong impact of hydro-chemicals originated mainly from industrial, thermal, urban, and agricultural sources [29]. In this frame, chemical parameters are considered independently, may not be sufficient to furnish a complete picture of the aquatic environment. Therefore the examination of phytoplankton is an important part of the biological component, as it plays a key role in the primary production and global nutrient cycles of the earth [30].
Studying Phytoplankton ecology in fresh and brackish waters is better for understanding the distribution in broad terms; authors discussed the relations and impacts of factors like temperature, water pH, nutrient salts, and other hydrochemical on them [31].
In the present study, four classes of phytoplankton and species were identified at all selected stations in front of the drains namely: Bacillariophyceae, Cyanophyceae, Chlorophyceae, and Euglenophyceae (Appendixes 1 & 2). The percentage of each class differed from one station to another where class Bacillariophyceae was the most productive at the station (4) in front of drain 7 constituting about 45% from the total count, while the class Chlorophyceae was more abundant at the station (7) at Brinbal canal recording about 45.8% from the total count of phytoplankton, on the other hand, it must be clear that class Euglenophyceae were the most dominant at the station (6) in front of drain 11 (El-Hoks) recording about 40.9% from the total count of phytoplankton at this station due to the pollution with ammonia (107μmole L$^{-1}$) and organic matter. This observation coincided with Radwan, et al. [14] who reported that the dominancy of Euglenoids is related to high levels of ammonia and organic matters discharged from the drains. Class Cyanophyceae was dominated at station (2) in front of the El-Khashah region constituting about 37.0% of the total count of phytoplankton.
Diatoms are a major group of algae and one of the most common types of phytoplankton belonging to Bacillariophyceae. These are sensitive to changes in the chemistry of water in which they exist. Early researches realized this principle concerning ph. Although some species were found to have wide ranges of pH tolerance, scientists noted that optimal development occurs within a narrow range of pH [32].
Class Bacillariophyceae occupies the first important position at the station (4) in front of drain 7 associated with depletion in reactive silicate, this is agreed with Abdel-Hamid, et al. [33] who observed that flourish of diatoms caused a significant reduction in silicon content (920.5 μmole L$^{-1}$). The genera of Nitzschia spp. were the most abundant in this station. The common species belonging to this genus were N. longissima, N. palea, and N. closterium. The distribution of these species was influenced by the heavy load of organic matter and silicate levels, this agreed with Munawar, et al. [34].
The genus Cyclotella at the station (4) recorded the second important genus at this station; this genus was represented by three species C. meneghiniana, Kutzingiana, and C. operculata. The first species was recorded in high counts since this station was characterized by a heavy load of organic matters from drain 7 in addition to the high levels of salinity (Table 1). This observation was agreed with Abdalla, et al. [35].
Concerning the distribution of class Cyanophyceae in front of drains, it’s obvious that it was most abundant and important at station 2 representing 37.3% of the total count. The genera of Chroococcus spp and Oscillatoria spp were the most dominant genera also in st. 2. Where the first genus was represented by three species namely; C. disperses, C. limneticus, and C. turgidus. It is important to throw light on the flourish of the members of this genus that attributed to domestic sewage originated from Kitchener drain which discharges wastes directly into the lake through the El-Sharika drain in addition to a high load of nutrients as shown in Table 2. It is agreed with Radwan, et al. [14] who noticed that the flourish of this genus is associated with a high load of nutrient salts and domestic sewage as in Edku Lake. Ganai, et al. [36] reported that nitrate is one of the key chemical factors which control the distribution of Cyanophyceae in rivers and lakes.
The genus of Oscillatoria was represented by two species namely; O. lemnetica and O. princeps. The flourish of these species was influenced by the high load of organic matter and nutrient salts (especially ammonia and nitrite) from sewage wastes at the El-Khashaa region. This is agreed with Bianchi, et al. [29] who obtained that the flourish of this genus is influenced by the inputs from urban areas and runoff water from agricultural areas.
At the Brinbal canal, this area is characterized by productivity and abundance of class Chlorophyceae, representing 46 % of the total count of phytoplankton with 661000 unit l-1 as Table 1.
The first dominant genus among genera belonging to chlorophytes at st. 7 was Schenedesmus sp. Since it formed about 54.5%. While Scenedesmus quadricauda represents about 31% of the total count of Schenedesmus (Appendix 2). This agreed with observations of Radwan, et al. [37] who reported that the flourish of Schenedesmus spp. was influenced by oxidizable organic matter, phosphate concentration, and salinity value. On the other hand, the species of Chlorella vulgaris was the most abundant among the species of chlorophytes at st.5 (El-Shakhlouba drain) due to the high levels of phosphate. It’s known that the flourish of this species was associated with the levels of phosphate and low salinity, in addition to that, this species tolerates a certain degree of organic matter discharged from the El Shaklouba drain without any treatment.
In this context, Guru, et al. [38] reported that the members of Chlorococcales are very sensitive to pollution and don’t show any clear relationship with DO as shown in the investigation where the DO value is 6.7 mg/l. The euglenoids prefer to grow luxuriantly and develop in polluted water. In the current investigations, the euglenoids were the most abundant at st. 6 as constituting about 41 % of the total count of phytoplankton and a total of 4 species belonging to 2 genera were found at this station.
The common species occurrence was Phacus longicauda and Euglena acus. Euglenoids grow and often develop into the water which is organically rich and has low levels of DO. The lowest level of DO was recorded at st.6 (4.8 mg/l). Other investigations reported that the presence of euglenoids was associated with a high level of ammonia, nutrient salts, and sufficient organic matter, this agreed with Abdalla, et al. [35], Jagdeeshappa, et al. [32], and Radwan, et al. [14].
Chlorophyll-a is a general indicator of phytoplankton a pronounced variation was observed at the selected stations. The results showed that the highest level of Chl a (308 µg/l) was determined in station 2 at El Khasha region from the El Gharbia drain which discharges its wastes into the lake. The highest level of Chl-a was associated with the high total count of phytoplankton (931.000 unit/l). This observation disagreed with Radwan, et al. [39] who noticed that the highest value of Chl-a was measured in front of the amount of the drains. Also, Zaher, et al. [40] mentioned that the high level of Chl-a was recorded at the discharges which lead to the flourishment of phytoplankton especially class Cyanophyceae. On the other hand the highest value of Chl-a which was recorded at st.7 in front of the Brinbal canal (254 µg/l) associated with the high count of phytoplankton attributed to the flourish of chlorophytes members, while the lowest level of Chl-a (18.07 µg/l) at st.6 (in front of drain 11) was due to the dominancy of euglenoids members.
The results of WQI based on seven parameters namely pH, Ec, TDS, DO, NH4, NO2, and PO4, are as shown in (Table 2). The value of the average water quality index (AWQI) was 190.22 (bad quality) in front of the drains in lake Burullus. The average water quality index is a benefit to referring to the status of lakes water quality especially when the pressure of industrial and agricultural activities increases nowadays. According to Tiwari, et al. [21] classification, AWQI was classified into 4 categories: good (0.0 - 100), medium (100 - 150), bad (150 - 200), and very bad (over 200). On this basis, the quality of water is bad and this may be due to the increase in the amount of drainage water entering the lake.
| Drain | T°C | pH | Sal ‰ | TDS mg/l | EC ms/ cm | NH 4 µmole/l | NO µmole/l 2 | PO µmole/l 4 | SiO µmole/l 4 | Chl µg/l | DO mg/l | T.count of Phytoplankton |
|---|---|---|---|---|---|---|---|---|---|---|---|---|
| East El- Burullus | 16 | 7.9 | 2.8 | 2730 | 5.26 | 68.4 | 40.95 | 36.18 | 2604 | 26.22 | 7.4 | 439 |
| El-Khashaa | 18.5 | 8.01 | 2.1 | 2010 | 3.92 | 80.7 | 38.63 | 27.1 | 1379 | 308.4 | 8 | 931 |
| Terra | 18 | 8.04 | 1.8 | 1810 | 3.56 | 98.16 | 33.68 | 35 | 1183 | 46.82 | 7 | 395 |
| Drain 7 | 18.5 | 8.03 | 2 | 1920 | 3.77 | 59.58 | 21.5 | 18.35 | 920.5 | 113 | 6.5 | 552 |
| El-Shakloba | 18.5 | 8.07 | 1.5 | 1430 | 2.85 | 94.68 | 27.63 | 48 | 1683.5 | 87.14 | 5.4 | 630 |
| Drain 11 | 19 | 8.17 | 0.7 | 718 | 1.46 | 107.04 | 26.32 | 22.47 | 997.5 | 18.07 | 4.8 | 203 |
| Brinbal | 17 | 8.1 | 1.9 | 1890 | 3.73 | 46.08 | 17.27 | 7.12 | 374.5 | 254.5 | 6.2 | 661 |
Table 2: WQI and AWQI in front of the drains in Lake Burullus based on different parameters.
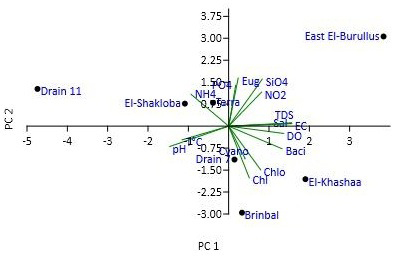
The interpretation of PCA (Figure 2) explains the relation between different water parameters with phytoplankton species and drains. It is indicated that drain 7, Brinbal, and El-Khashaa drain correlated with DO, chlorophyll within two genera namely; Bacillariophyceae and Cyanophyceae. Zaher, et al. [40] mentioned that the high level of Chlorophyll a may lead to the flourishment of Cyanophyceae. Whereas the Euglenophyceae was recorded at East El-Burullus related to some nutrient salts as NH4, SiO4, and NO2 and it agrees with Radwan, et al. [14]. Terra, El-Shakhlouba, and Drain 11 may contain the same physiochemical characteristics.
| Vi | Si | qi | |
|---|---|---|---|
| pH | 8.05 | 7.5 | 107.33 |
| EC | 3.51 | 2 | 175.5 |
| TDS | 1786.9 | 1000 | 178.69 |
| DO | 6.47 | 5 | 129.4 |
| NH4 | 79.23 | 14.28 | 554.83 |
| NO2 | 29.43 | 214.3 | 13.73 |
| PO4 | 27.75 | 16.13 | 172.04 |
| WQI | 1331.5 | ||
| AWQI | 190.22 |
Table 3: WQI and AWQI in front of the drains in Lake Burullus based on different parameters.
Vi is the observed value of the parameter at a given sampling site, Si is water quality standard of parameter and qi is quality rating values.
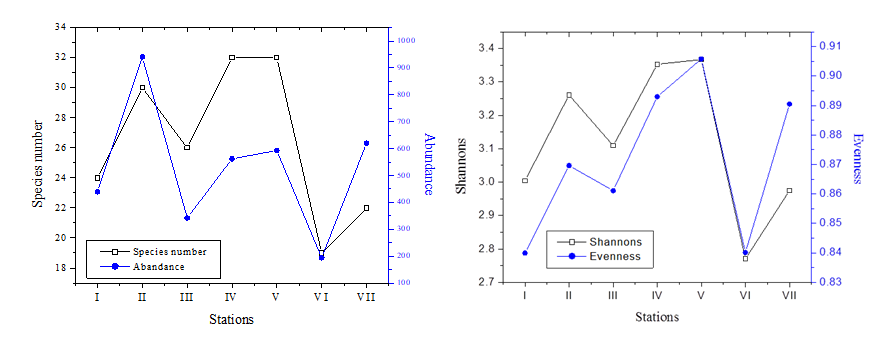
The taxa species number was estimated as in Table 3. It indicated that the lowest species number was estimated at station 6 namely drain 11 or Elhox drain, while the highest species number was estimated at stations of Drain 7 and Elshaklouba drains. Different calculated indices were estimated as Table 3 & Figure 3 that indicate the Shannon and evenness values of (2.77-3.36) and (0.84-0.90), respectively. Shannon diversity index is a commonly used diversity index that takes into consideration the abundance and evenness of species present in the community. It is commonly used to characterize species diversity in a community [41]. Dash [42] reported that the high value of Shannon’s index (H’) signifies planktonic diversity. The highest Shannon value here is recorded at the Elshaklouba drain area, which may be attributed to high organic matters. While the lowest was obtained at drain 11, mostly drainage wastes from industrial areas.
Also, the high values (0.928 to 0.962) of Simpson’s Dominance index indicate the dominance of common species in this small spatial scale that was found by another study by El Tohamy, et al. [43] of 0.65 to 0.79. Consideration of abundance and species numbers studies using Margalef’s richness index (DMARG) which ranged between 3.26 at Brinbal canal (Freshwater source from Rosetta River Nile Branch) and 4.89 at Drain 7 (agriculture drain). Species diversity within aquatic communities is closely related to the trophic state of the water [44].
| Diversity Indices | Stations | ||||||
|---|---|---|---|---|---|---|---|
| 1 | 2 | 3 | 4 | 5 | 6 | 7 | |
| Taxa_S | 24 | 30 | 26 | 32 | 32 | 19 | 22 |
| Individuals | 439 | 941 | 342 | 562 | 593 | 194 | 620 |
| Dominance_D | 0.06 | 0.04 | 0.05 | 0.04 | 0.04 | 0.07 | 0.06 |
| Simpson_1-D | 0.94 | 0.96 | 0.95 | 0.96 | 0.96 | 0.93 | 0.95 |
| Shannon_H | 3 | 3.26 | 3.11 | 3.35 | 3.37 | 2.77 | 2.98 |
| Evenness_e^H/S | 0.84 | 0.87 | 0.86 | 0.89 | 0.91 | 0.84 | 0.89 |
| Margalef | 3.78 | 4.24 | 4.29 | 4.9 | 4.86 | 3.42 | 3.27 |
Table 4: Different indices of the community structure of the sampling stations.
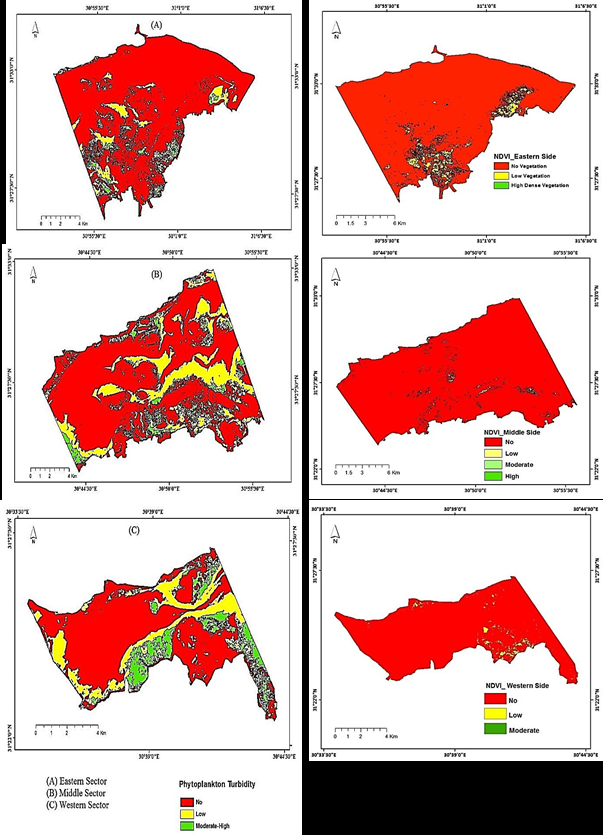
The calculation of the phytoplankton turbidity index and from band values, showed three classes ranging between low, moderate, and high. From Figure 4, the phytoplankton turbidity index developed using Landsat data indicate that nearly 147, 149.2 and 40.3 km2 have no phytoplankton in eastern, middle, and western sectors respectively. While 22.2, 57.17, and 16.22 km2 have low phytoplankton. Finally, the range of moderate to a high concentration of phytoplankton species recorded 4.17, 10.57, and 7.91 km2 in the three sectors. Normally that the middle sector contains the high reflectance and area of phytoplankton cover as there are two important drains of Damru and Elshaklouba drains that contain a high percentage of drainage waters in addition to organic matters from agricultural and urban wastes in the southern part of the lake.
Calculation of NDVI for Burullus Lake in the reflectance image (the year 2019) gives a different range for three sectors.
It gives an indication that the no vegetation category was abundant in the lake and represented by 162.45, 214.64, and 63.34 km2 in eastern, middle, and western sides, respectively (Figure 4). The vegetative low dense areas in the lake covered areas of about 11.33, 2.59, and 1.36 km2 for the three sectors. For the moderate vegetation category, it appears only in middle and western areas with 0.002, and 0.003 km2, respectively. The high dense vegetation was observed only on the eastern side with an area of about 0.002 Km2.
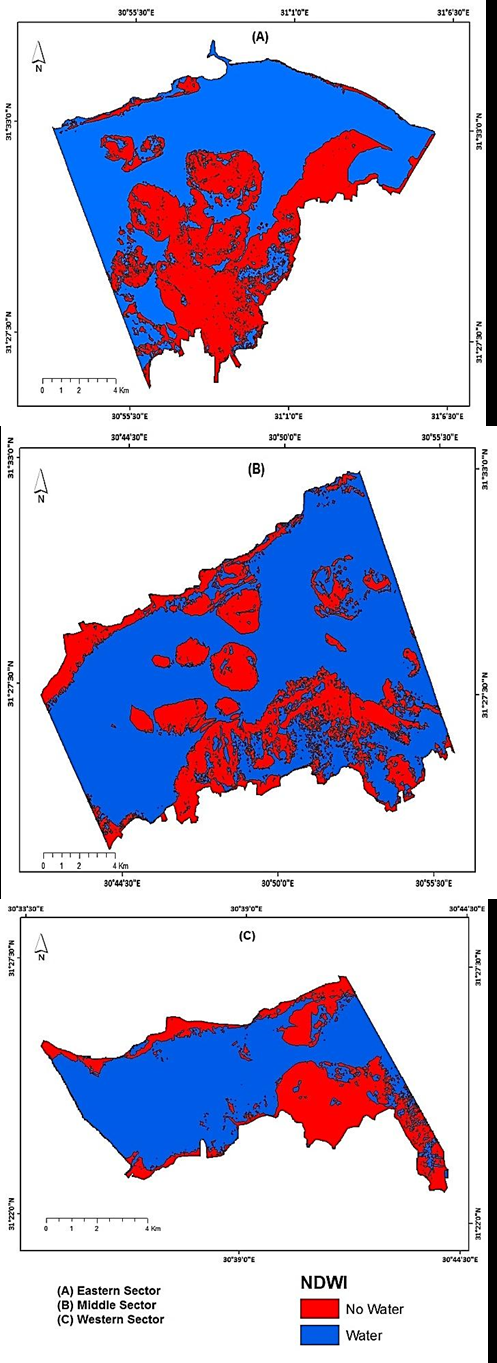
The NDWI distinguishes areas covered with water and those with no water. It indicates different proportions, as areas covered with water are 105.09, 153.25, and 43.57 km2 for eastern, middle, and western sectors, respectively (Figure 5). While Figure 6 and Table 4, it showed that the area is covered by different land cover in the lake in Km2. From the calculation of cover percent of the three sectors, it is an obvious high percentage in the western sector followed by the middle and eastern sectors respectively. It can be interpreted that the eastern sectors are nearby Boughaz that renew the water in this area, but with far from the El-Boughaz area the water may be affected by freshwater discharges from drains.
| Eastern | Middle Km² | Western | |
|---|---|---|---|
| NDVI | 11.33 | 2.6 | 1.36 |
| NDWI | 105.09 | 153.25 | 43.57 |
| PTI | 26.42 | 67.75 | 24.12 |
| Percent of PTI covered of water % | 25.14 | 44.21 | 55.36 |
Table 5: Areas covered by vegetation, water and phytoplankton.
Conclusion
• The average water quality of the aquatic environment in front of drains (south parts of Lake Burullus) is bad.
• Phytoplankton species in studied sampling sites were inventor under four classes namely; Bacillariophyceae, Cyanophyceae, Chlorophyceae, and Euglenophyceae.
• Appendices 1 and 2 discuss the classes’ numbers, total amount, and species of different classes.
• Landsat indices indicate that the areas covered by phytoplankton turbidity of the water, vegetation cover, and water areas.
• The phytoplankton turbidities as observed from Landsat images were increased towards the western part faraway from El-Boughaz.
Ethics Declarations
Conflict of Interest
The authors declare that they have no conflict of interest.
Ethical Approval
No animal testing was performed during this study.
Sampling and Field Studies
All necessary permits for observational field studies have been obtained by the authors.
Author Contributions
All authors contribute equally in this manuscript.
References
-
Ligez S, Wilk Wozniak E (2011) The occurrence of a _Euglena pascheri_ and Lepocinclis ovum bloom in an oxbow lake in southern Poland under extreme environmental conditions. Journal of Ecological Indicators 11(3): 925-929.
-
Cloern JE, Powell TM, Huzzey LM (1989) Spatial and temporal variability In South San Francisco Bay (USA). 11. Temporal changes in salinity, suspended sediments, and phytoplankton biomass and productivity over tidal time scales. Estuary Coastal Journal of Shelf Science 28(6): 599-613.
-
Zebek E (2004) Species biodiversity of net phytoplankton as an indicator of trophic changes in the urban lake Jeziorak. MalyTeka Kom Ochr Kszt Srod Przyr 1: 316- 321.
-
Pourafrasyabi M, Ramezanpour Z (2014) Phytoplankton as bio-indicator of water quality in Sefid Rud River, Iran (South of Caspian Sea). Caspian Journal of Environmental Sciences 12(1): 31-40.
-
Toporowska M, Pawlik Skowronska B, Kalinowska R (2014) Accumulation and effects of cyanobacterial microcystins and anatoxin-a on benthic larvae of Chironomus spp. (Diptera: Chironomidae). European Journal of Entomology 111(1): 83-90.
-
Baldwin DS, Wilson J, Gigney H (2010) Influence of extreme drawdown on water quality downstream of large water storage reservoir. River Research and Applications 26(2): 194-206.
-
Mitrovic SM, Hardwick L, Drani F (2011) Use of flow management to mitigate Cyanobacterial blooms in the lower Darling River, Australia. Journal of Plankton Research 33(2): 229-241.
-
Kangro K, Laugaste R, Noyes P, Ott I (2005) Long-term changes and special features of seasonal development of phytoplankton in a strongly stratified hypertrophic lake. Journal of Hydrobiologia 547(1): 91-103.
-
Goswami AP (2012) Department of Biology, M. V. M. Science and Home Science College Rajkot Gujarat. INDIA. ISCA Journal of Biological Sciences 1(1): 30-34.
-
Canadian Council of Ministers of the Environment (CCME), WQI, (2005) Standard Methods for the examinations of water and wastewater, American Public Health Association, Washington, DC.
-
Deepika, Singh SK (2015) Water Quality Index Assessment of Bhalswa Lake, New Delhi. International Journal of Advanced Research 3(5): 1052-1059.
-
Aitelghazia A, Rhinanea H, Bensalmiaa A, Giulianib G (2019) Using the Landsat-7 data to study the correlation between the surface temperature and phytoplankton turbidity Case study: Al Massira Lake (Settat - Morocco). ICMES, 2018. Materials Today: Proceedings 13(3): 496- 504.
-
Fensholt R, Sandholt I (2003) Derivation of a shortwave infrared water stress index from MODIS near and shortwave infrared data in a semiarid environment. Remote sensing of Environment 87(1): 111-121.
-
Radwan AM, Abdelmoeim MA, Basiony AI, El Alfy MA (2019) Water pollution monitoring in Idku Lake (Egypt) using phytoplankton and NSF-WQI. Egyptian Journal of Aquatic Biology and Fisheries 23(4): 465-481.
-
Prescott GW (1978) How to know fresh water algae. W.M.C.Brown Co, USA, pp: 1-199.
-
Prescott GW (1962) Algae of western Great Lakes area. W.M.C.Brown Co. Dubque, Lowa, USA, pp:1-965.
-
Bold HC, Wynne MJ (1978) Introduction to the algae structure and reproduction prentice. Hall Inc Engl Wood Cliffs, pp: 1-706.
-
Vinard WC (1979) Diatoms of North America. In: 3rd (Edn.), Text Book. New Yourk, USA pp: 1-339.
-
Grasshoff K, Kremling K, Ehrhardt M (1999) Methods of Sea water analysis. In: 3rd (Edn.), Wiley-VCH, pp: 1-600.
-
Strickland J DH, Parsons TR (1972) A practical handbook of seawater analysis. Fish. Res. Board Can. Bull. 167. In: 2nd (Edn.), pp: 1-328.
-
Zhao ZM, Zhou XY (1984) Introduction to Ecology. Scientific and Technical Documents Publishing House, Chongqing pp: 108-119.
-
Tiwari TN, Manzoor A (1988) Water Quality Index for Indian Rivers. In: Ecology and Pollution of Indian River. Ashish Publishing House pp: 271-286.
-
Xu ZL, Chen YQ (1989) Aggregated intensity of dominant species of zooplankton in autumn in the East China Sea and Yellow Sea. Journal of Ecology 8: 13-15.
-
Shannon CE, Weaver W (1949) The mathematical theory of communication. University of Ilinois Press, Urbana, pp: 1-131.
-
Heip CH, Herman PM, Soetaert K (1998) Indices of diversity and evenness. Oceanis 24(4): 61-88.
-
Verdin J, Funk C, Klaver R, Roberts D (1999) Exploring the correlation between Southern Africa NDVI and Pacific sea surface temperatures: results for the 1998 maize growing season, Int J Remote Sens 20(10): 2117- 2124.
-
El Alfy MA, Hasballah AF, Abd El Hamid HT, El Zeiny AM (2019) Toxicity assessment of heavy metals and organochlorine pesticides in freshwater and marine environments, Rosetta area, Egypt using multiple approaches. Sustainable Environment Research 29: 19.
-
Xu H (2006) Modification of normalized difference water index (NDWI) to enhance open water features in remotely sensed imagery. International Journal of Remote Sensing 27(14).
-
Bianchi F, Acri F, Aubry FB, Berton A, Boldrin A, et al. (2003) Can plankton communities be considered as bioindicators of water quality in the lagoon of Venice?. Marine Pollution Bulletin 46(8): 964-971.
-
Daniel V (2001) Phytoplankton. Encyclopedia of life sciences. Macmillan Publishers Ltd. Nature Publishing Group pp: 1-5.
-
Manisha D, Fulke AB, Khairnar K, Meshram PU, Paunikar WN (2013) A review of phytoplankton ecology in Freshwater Lakes of India. Lakes, Reservoir and ponds 7(2): 127-141.
-
Jagadeeshappa KC, kumara V (2013) Impact of Physico- Chemical Conditions on Seasonal Fluctuation of Plankton Diversity In Certain Wetlands of Tiptur Taluk, Tumkur Dist, Karnataka, India. GJBAHS 2(4): 143-150.
-
Abdel-Hamid MI (1986) Ecological studies on algal pollution of Damietta branch and the possibility of their use as water pollution indicator M.Sc. Thesis, Botany Department, Mansoura University, Egypt, pp: 260.
-
Munawar M (1974) Limnological studies of fresh water ponds of Hyderabad. India IV. The Biocenos. Periodicity and species composition of unicellular and colonial phytoplankton in polluted environments. Hydrobiologia 45: 1-32.
-
Abdalla RR, Samaan AA, Ghabrial MG (1991) Eutrophication in Lake Mariut. Bull Nat Ins Ocean and Fish, ARE 17(1): 157-166.
-
Ganai AH, Parveen S (2014) Effect of physico-chemical conditions on the structure and composition of the phytoplankton community in Wular Lake at Lankrishipora, Kashmir. International Journal of Biodiversity and Conservation 6(1): 71-84.
-
Radwan AM, Tayel FT, Morsy MH, Abdelmoneim MA, Basiony AI (2018) Monitoring of water pollution and eutrophication using phytoplankton as bioindicator in Burullus Lake, Egypt. Mansoura Journal of Environmental Sciences 47(1-2): 63-74.
-
Guru SD (2008) Distribution and biodiversity of Chlorococcales flora in the phytosystan of freshwater lake. Journal of Phytoplankton Research 21(1): 149-150.
-
Radwan AM (2007) Impact of the primary production of phytoplankton in Lake Burullus. African Journal of Biological Science 3(1): 35-49.
-
Zaher S (2012) Potential toxicity of algal blooms in Wadi El-Rayan Lakes, El-Fayoum (Egypt). PhD Thesis, Faculty of Science, Ain Shams University, Egypt.
-
Hossain MD, Pramanik MD, Hasan MD (2017) Diversity indices of plankton communities in the River Meghna of Bangladesh. International Journal of Fisheries and Aquatic Studies 5(3): 330-334
-
Dash MC (1996) Fundamentals of Ecology, Tata McGraw Hill Publishing Company limited, New Delhi.
-
El Tohamy WS, Azab YA, Abdel Aziz NE (2019) Evaluation of the Water Quality of Damietta Harbor: Using the Zooplankton Diversity and the Traditional Water Quality Parameters. International Journal of Oceans and Oceanography 13(1): 219-236.
-
Telesh IV (2004) Plankton of the Baltic estuarine ecosystems with emphasis on Neva Estuary: a review of present knowledge and research perspectives. Marine Pollution Bulletin 49(3): 206-219.
- Genetic Improvement of Nile Tilapia (Oreochromis niloticus): Advances in Selective Breeding and Genomic Approaches for Sustainable Aquaculture
- Microplastics, Contaminants, and Waste Hotspots: Divergences and Faults in Prioritizing Control Efforts
- Creating a Healthier, More Vibrant Open and Closed Aquatic Environment. A Submersible, Centrifugal Magnetically Affixed Current Changing Aquarium Pump
- An Attempt to Assess Alpha Diversity and Sample Size: Using the Ostracod Assemblages off Kumamoto Port, Japan
- Assessment of the Efficiency of Common Fishing Gears and Crafts Used at Mohananda River of Chapai Nawabganj, Bangladesh
- Fish Productivity and Biodiversity Status of Sundarban Mangrove in Bangladesh