The Process of Heat Transfer to the Sea Caused by Wastewater from the Central Cooling System of Vinh Tan Thermal Power, Binh Thuan - Vietnam
Every day Vinh Tan thermal power center needs millions of gallons of seawater to cool the machinery system and that volume of seawater will eventually return to the sea. This volume of seawater with a temperature ranging from 32-35 degree celsius pouring into the sea will spread heat to the surrounding environment in a large area, down to the deep layer of the sea. Quantifying the affected space and water temperature, I’m using the ROMS (Regional Ocean Modeling System) model to solve this process. The source of boundary condition data for ROMS is obtained from the databases of NOMADS, COADS, QuikSCAT, TPXO7.1 through OPenDAP data access protocol. Topographic data sources, factory discharge water, river water flow, sea water temperature, discharge water temperature were collected from field measurements. The study area is the coastal sea waters from Hon Dinh headland to Ne headland covered by a network of 80x110 points in the horizontal direction and 5 sigma layers in the vertical direction. The results show that a strip of water with high temperature appears from the outlet of the factory towards the south and parallel to the shoreline. Heat transfer in layers has a similar thing which is very limited to the north because the flow effect from north to south is dominant. A strip of high-temperature water spread to the sea, after 10 days hot water had spread near Ne headland and after 30 days in all three layers, there was a coastal strip of water with a high temperature of over 28°C appearing to spread and stretch. long to the south, in the large surface this strip of water is larger than the middle layer, while the bottom layer is prolonged, but in some places it is interrupted and the hot water area is significantly smaller than the upper layers.
Introduction
In Vinh Tan-Tuy Phong district, Binh Thuan province Vietnam, there is an enormous thermal power center with 5 coal-fired power plants: Vinh Tan 1, Vinh Tan 2, Vinh Tan 3 , Vinh Tan 4 and Vinh Tan 4 expanded. Everyday, the factory sucks millions of gallons of seawater to cool the machinery system and is then dumped into the sea. Due to currents, waves and winds, this water source spreads to the sea on a large scale and penetrates deep into the sea. Warming temperatures will increase chemical reactions in the water, increase the percentage of dissolved salts in the water, reduce growth, and prevent natural conditions in the sea from affecting aquatic flora and fauna [1]. Many studies have shown that heat acts as a contaminant [2, 3] affecting the environment. Industrial chemicals, fossil fuels, and power plants use large amounts of water to cool their machinery and discharge this hot water back into a higher temperature environment. severe effects for a particular sea area or region [4, 5].
In order to determine the evolution of heat propagation and accumulation of sea water due to the influence of these discharge heat sources, some places in Viet Nam have studied and forecasted this propagation process for appropriate solutions and treatment. such as the works ``Research and calculation of heat spread in Cua Luc Bay by Dao Thi Hoa and colleagues",“Research on pollutant transmission on two-dimensional mathematical model of Do Son - Hai Phong sea of Do Son - Hai Phong of authors HV. Cuong, NM Linh”, “Application of MIKE 21FM model to assess the impact of discharge water from Thang Long thermal power plant on water intake area by DD. Duc and colleagues”. Research on heat spread by three-dimensional mathematical model - thermal power plant in Degi sea area, Binh Dinh province. The results show that the discharge source has an effect on the water intake location of the plant and when there is a barrier, it The level of effect from the discharge source of the thermal power plant is reduced [6]. Studying the temperature of the water in the study area, based on a number of datasets collected in the period 2003-2017, new findings on sea water temperature were identified in the mass water of the South Central Coast of Vietnam. Under La Nina conditions, the temperature of most mass water decreased by 0.1-3 degree celsius [7].
During the study of Heat transfer process to sea by cooling wastewater from Vinh Tan thermal power center, Binh Thuan province - Vietnam, I applied a ROMS model integrated with actual measured data for calculation. As is known, ROMS is an open model, used by many researchers and developed for many different space-time scales: from the coastal strip to the oceans, simulating days, months, decades. ROMS allows efficient deployment and high-resolution computational results. ROMS solves hydrostatic and free-surface hydrodynamic equations for complex horizontal terrains using orthogonal curved grids, which are described in detail by Arakawa, et al. [8, 9] Using the Sigma coordinate system, the Sigma system is described in detail by Coo. Mellor GL, et al. [10] ROMS uses boundary data conditions from models and global databases (OGCM); how to execute OGCM is explained in detail by Silva DAC, et al. [11] At the fluid margins, I’m using data from the Global Sea Atlas, with tidal fluid margins (water level and tidal current) calculated from the tidal model TPX07.1, which Marchesiello P, et al. [12] using detailly. Water flow and temperature of the Thermal Power Center are taken from the official design capacity calculations of the Center. Using ROMS to study and calculate the coastal waters from Hon Dinh headland (Ninh Thuan Province) to Ne headland (Binh Thuan Province) and it is covered by a network (resolution) of 80x110 points horizontally and 7 sigma layers in vertical direction.
Research Methodology
Research basis, heat transfer process from Vinh Tan Thermal Power Center to the sea by deploying and applying ROMS are established based on three coordinate systems: Descartes - Sigma - Orthogonal curved. Descartes coordinate system with $x$ increasing in the east, $y$ increasing in the north and $z$ increasing vertically from the bottom. The free surface of the sea is determined at position $z = z(x,y,t)$ and the bottom at position $z = -H(x,y)$. Where $\vec{v}$ is the horizontal velocity vector with components $(u,v)$, $w$ is the vertical component, TS is the heat-salt component and $\nabla$ is the horizontal gradient operator. ROMS then gives seven equations: the equation of continuity for incompressible liquids, two equations of momentum in the horizontal direction, the equation of momentum in the vertical direction, the equation of state, and the equation of thermal diffusion, the salt diffusion equation. By transforming from Descartes coordinates $(x,y,z)$ to a dimensionless (Sigma) coordinate system in the vertical direction $(x',y',\sigma)$, then using the operators $x' = x, y' = y, \sigma = \frac{z - \zeta}{H + \zeta} (z = \zeta \sigma = 0), z = -H \sigma = -1)$, we perform the transformations of the Descartes coordinate system to the Sigma coordinate system at the sea surface $z = \zeta$ to the seabed $z = -H$ with coordinates dimensionless = 0 and = -1.
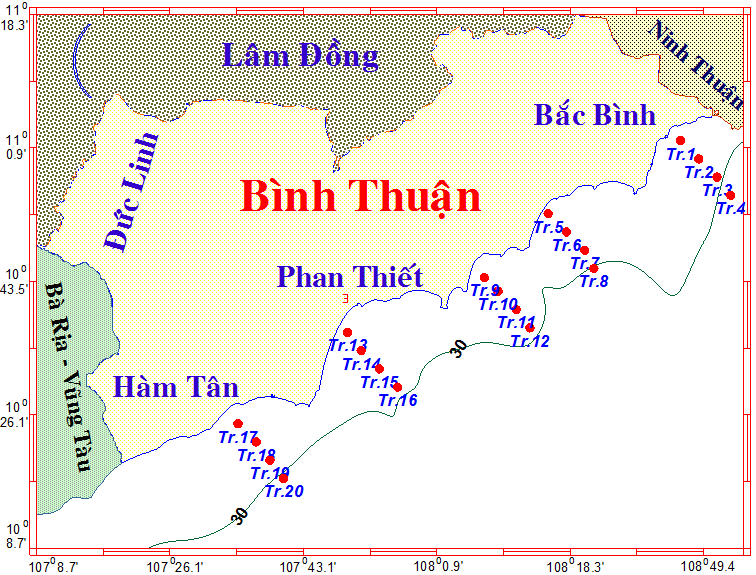
Then we get 7 dominant equations of ROMS in the Sigma coordinate system. In the orthogonal curvilinear coordinate system, by using the operators $\xi, \eta$ orthogonal and the boundaries of the domain coincide with the isolines $\xi, \eta$, when the mapping function is determined, the measurement coefficients $m(\xi,\eta), n(\xi,\eta)$ are also identified. The measurement coefficients $m$ and $n$ of the orthogonal curvilinear coordinate system that link the difference distances in the directions $\xi, \eta$ to the actual arcs, replacing and transforming the ROMS equations in the Descartes coordinate system will be 7 corresponding equations in orthogonal curvilinear coordinate system. Equations in Descartes, Orthogonal, Sigma coordinate systems are available in the ROMS model documentation. The seabed topography is interpolated from the global seabed topographic data (ETOPO-2) with a resolution of 2’ and corrected with the measured topographic data of the project KC09-03/06-10 (Figure 1). The model divides the depth into 5 layers according to the Sigma coordinate system. Using the conditions of stability and convergence according to the criterion Courant - Fredrichs - Lewy (conditions of stability and convergence, Durran DR, et al.) [13, 14].
Results and Discussion
Input data of Vinh Tan thermal power plant
The model applied to the study area is the coastal sea from Hon Dinh headland to Ne headland, located in the coordinate range 11° 00’ ÷ 11° 26’N and 108° 35’ ÷ 109° 30’E. Covered by a net 80×110mesh button. Step in space $$ \Delta x = \Delta y $$
= 160-315 m, step in time satisfies Courant-
Fedrich-Lewy conditions (4), (5); t
∆ = 60 s.
• Speed and temperature of discharge water through the waste outlet After cooling the condenser is discharged into the sea with the temperature at the condenser outlet fluctuating around 35°C. At the open waste channel, the water will be exchanged for natural heat. With sea water temperature (about 26°C), it is estimated that the total amount of cooling water discharged into the sea through the waste canal is about 28.3 million cubic meters/day (Cooling water demand for Vinh Tan Thermal Power Center with a total capacity of 5.600MW estimated 18÷20 million m3/day according to Dr. Nguyen Thanh Son, council of Vietnam energy magazine) [15]. Thus, the rate of cooling water discharged into the sea is calculated by the formula:
At the discharge channel: D Q V KenhThai = (7)
Where Q: Water flow through the waste canal, D: Wet cross- sectional area of the waste channel TKenh = 35 °C SKenh = Snước biển = 33.45 (average salinity of sea plant area, based on survey data of the subject).
In order for the problem to converge closely to the sea temperature in the study area, use temperature data at the typical depths (equivalent to 5 Sigma layers) of the topics measured in the area (KC09-03/06-10).
The level of heat spread due to discharge water of Vinh Tan thermal power center to the surface layer
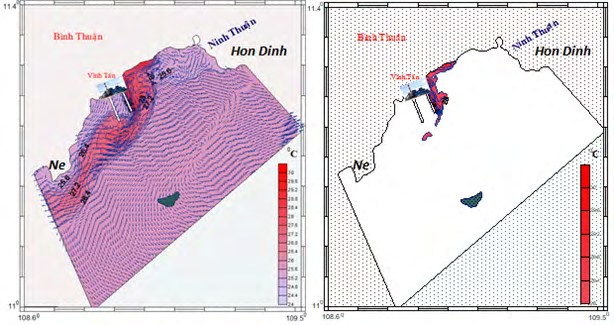
On the basis of taking the temperature and flow data series from the file Vinhtan_his_0001.nc (the name “vinhtan” is put in file vinhtan.in, his_0001.nc because “ROMS” runs automatically put in). Consider the process of heat spreading from Vinh Tan - Binh Thuan thermal power center to the sea for a continuous process of half a day (12 hours), 1, 2, 3, 5 days, 10, a month. According to the cooling water discharge time of the plant, the highlight of the sea water temperature field at the floors is always the high temperature water range from the area from the factory to the south.
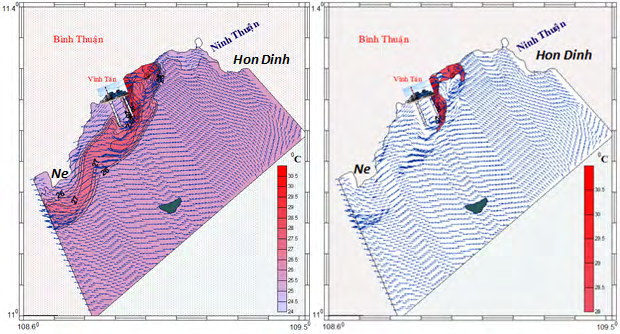
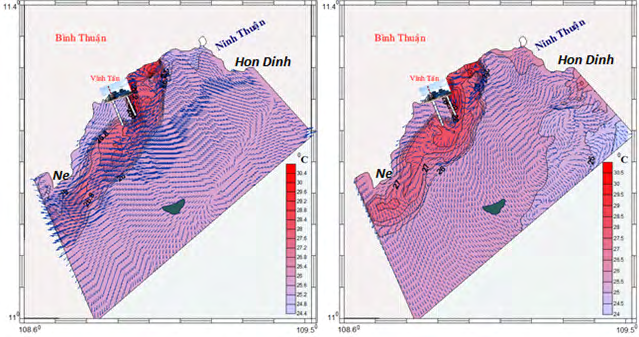
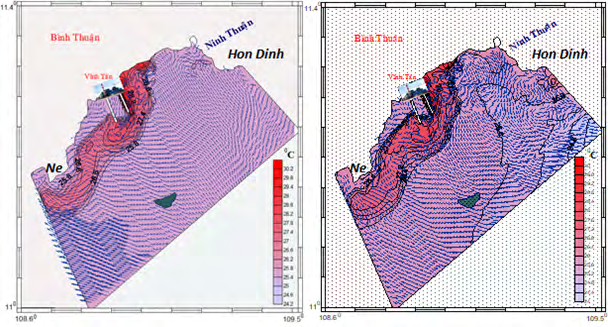
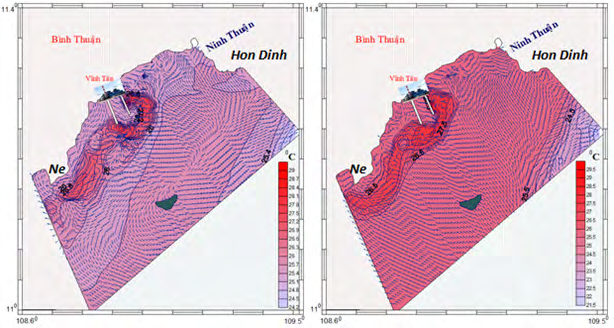
In the surface layer: After 12 hours (half a day) of calculation, the thermal field has a strip of hot water running parallel to the shore from the outlet to the south. The water temperature gradually increased from the outlet down and the high temperature water area of 28-31°C crossed the embankment of Vinh Tan port towards Ne headland (Figure 2). After 5 days, the high-temperature strip of water widened and advanced further through the harbor embankment (Figure 3). After 10 days, this streak of water spread close to Ne headland and after a month the hot water mass above 28 °C parallel to the shoreline covered Ne headland (Figure 3).
Through analysis of the surface temperature field, it shows that, after 12 hours, the average temperature of the study area is 25.91°C, the highest temperature is 30.96°C and the lowest is 24.82°C with the standard deviation of temperature in space. 0.679°C. After 5 days the average temperature is 25.97°C, the highest temperature is 31.07°C and the lowest is 25.150 C with standard deviation 0.692°c. After 10 days the average temperature is 26.02°C, the temperature the highest temperature is 31.1°C (near the sluice gate) and the lowest is 24.08°C (offshore) with standard deviation 0.852°C. After 30 days, the average temperature is 25.49°C; the highest temperature is 31.2°C. The lowest is 23.63°C with standard deviation 1,203°C.
The level of heat spread by the discharge water of Vinh Tan thermal power center into the middle layer
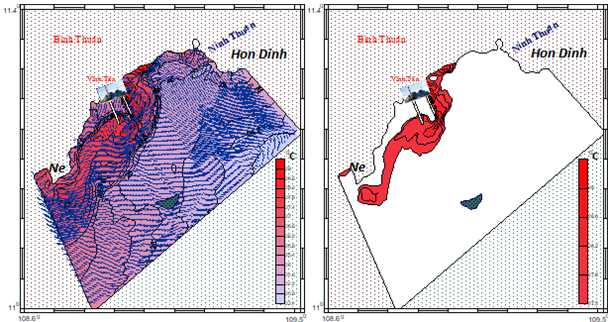
- Temperature distribution of the middle layer: The trend of heat transfer in the middle layer is similar to that of the power plant to the sea like in the surface layer. Because the mid-layer flow is different from the surface layer, the heat spread to the north (toward Ninh Thuan) spreads less than the surface layer.
- As surface layer: After half a day of calculation for the discharge of cooling water for the plant, there is also a hot water streak running parallel to the shore from the outlet to the south. The high temperature water has started to cross the two shores of the harbor towards Mui Ne (Figure 5). After 5, 10 days, the hot water streak spread widely and far through the harbor embankment and after about a month, the hot water mass above 28°C was cooled by the surrounding seawater but still accumulated heat spread. cover Ne headland (Figures 6,7).
- In the middle layer: after 12 hours, the average temperature of the study area is 25.88°C, the highest temperature is 29.84°C and the lowest is 24.83°C with the standard deviation of temperature in space is 0.616°C. After 5 days the average temperature is 25.94°C, the highest temperature is 30.43°C and the lowest is 25.14°C with standard deviation 0.693°C. After 10 days, the average temperature is 25.98°C, the highest temperature is 30.22°C and low The highest temperature is 24.58°C with standard deviation 0.798°C. After 30 days the average temperature is 25.44°C, the highest temperature is 30.02°C and the lowest is 23.62°C with a standard deviation of 1,116°C. Comparison of indicators, thermal standard deviation in space, it is found that the heat spread of the surface layer and the middle layer is not much different.
The level of heat spread due to discharge water of Vinh Tan thermal power center to the bottom floor
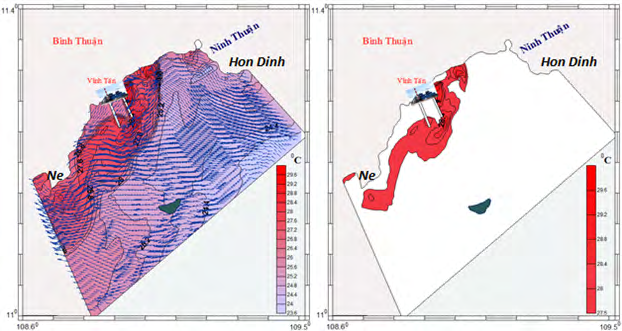
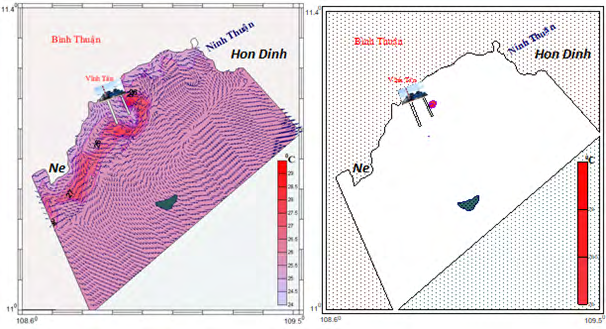
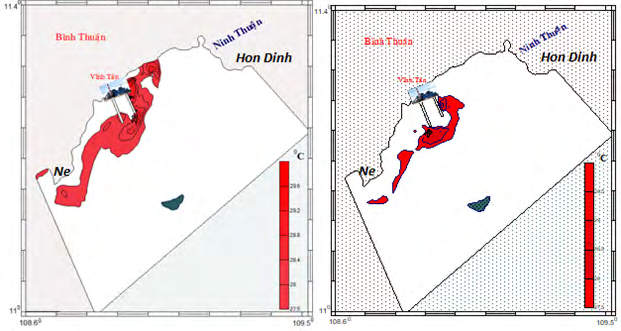
The temperature of the bottom layer is always lower than the upper layers, so the heat generated by the discharge of cooling water from the power plant to the sea affects the bottom layer differently from the upper layers. After half a day of discharge, there is a hot stream running parallel to the shore from the outlet to the south but much fainter than the surface and middle layers. Where the water has high temperature, only a very small area appears near the middle of the harbor (Figure 8). After 5, 10 days, the hot water streak spreads widely and passes through the harbor embankment, but this hot water trail is often broken. After about a month, the hot mass water above 28°C has been cooled a lot by the bottom water, so the hot water has not reached Ne headland like in the upper floors and this hot water is often interrupted (Figures 9,10). • In the middle layer: after 12 hours, the average temperature of the study area is 25.18°C, the highest temperature is 29.32°C and the lowest is 23.17°C with the standard deviation of temperature in space is 0.366°C. After 5 days the average temperature is 25.24°C, the highest temperature is 29.26°C and the lowest is 22.01°C with standard deviation of 0.681°C. After 10 days the average temperature is 25.28°C, the highest temperature is 29.38°C and low The highest temperature is 19.04°C with a standard deviation of 1,116°C. After 30 days, the average temperature is 25.12°C, the highest temperature is 28.61°C and the lowest is 21.95°C with a standard deviation of 1,085°C.
After 30 on the day of cooling water discharge, an area (strip) of water with high temperature above 28°C appeared spread out and extended to the south, this water area in the surface layer is slightly larger than the middle layer. The bottom layer of this water trail also extends, but in some places it is interrupted and the area of hot water is significantly smaller than the surface and middle layers.
Conclusion
The trend of heat transfer in the surface, middle and bottom layers is also relatively similar, all spreading to the south, but spreading to the north is very limited because the dominance flow effect usually flows from north to south. After many days of discharge, hot water above 28°C from the plant can spread about 20km to the south from the plant. The cooling water of Vinh Tan Thermal Power Center poured into the sea for a long time will affect the coastal water strip from the factory to Ne headland. A strip of high-temperature water spread to the sea, after 10 days hot water had spread near Ne headland and after 30 days in all three layers, there was a coastal strip of water with a high temperature of over 28°C appearing to spread and stretch. long to the south, in the large surface this strip of water is larger than the middle layer, while the bottom layer is prolonged, but in some places it is interrupted and the hot water area is significantly smaller than the upper layers.
Acknowledgement
This paper is a contribution to celebrate the 100 years Anniversary of the Institute of Oceanography, Vietnam Academy of Science and Technology. References
1. Madden N, Lewis A, Davis M (2013) Thermal effluent from the power sector: An analysis of once-through cooling system impacts on surface water temperature. Environmental Research Letters 8(3): 1-9.
2. Ling F, Foody GM, Du H, Ban X, Li X, et al. (2017)
Monitoring thermal pollution in rivers downstream of dams with Landsat ETM+ thermal infrared images. Remote Sensing 9(11): 1-1175.
3. vliet MTHV, Yearsley JR, Ludwig F, Vogele S, Lettenmaier DP, et al. (2012b) Vulnerability of US and European electricity supply to climate change. Nature Climate Change 2: 676-681.
4. Abbaspour A, Javid AH, Moghimi P, Kayhan K (2005) Modeling of thermal pollution in coastal area and its economical and environmental assessment. International Journal of Environmental Science & Technology 2(1): 13-26.
5. Lyubimova T, Lepikhin A, Parshakova Y, Lepikhin Y, Tiunov A (2018) The modeling of the formation of technogenic thermal pollution zones in large reservoirs. International Journal of Heat and Mass Transfer 126: 342-352.
6. Long BT, Anh NL, Oanh CTB, Huy ND (2016) Simulation of heat spread by three-dimensional mathematical model - the case of a thermal power plant in De-Gi sea area, Binh Dinh. Science and Technology Development Journal 2(2): 123-130.
7. Duong PX, Du HT, Linh VTT, Thai TD, Thu PM (2020) The Effect of ENSO on Hydrological Structure and Environment in the South Central Coast-Vietnam. Journal of Marine Science 2(1): 1-7.
8. Arakawa A, Lamb VR (1977) Computational design of the basic dynamical processes of the UCLA general circulation model. Meth Computat Phys 16: 173-263.
9. Arakawa A, Lamb VR (1977) Methods of computational physics. Academic Press 17: 174-265.
10. Mellor GL, Blumberg AF (1985) Modeling Vertical and Horizontal Viscosity and the Sigma Coordinate System. Mon Wea Rev 113(8): 1379-1383.
11. Da Silva A, Young C, Levitus S (1994) Atlas of Surface Marine Data. NOAA Atlas NESDIS 1(5): 6-10.
12. Marchesiello P, McWilliams JC, Shchepetkin A (2001) Open boundary conditions for long-term integrations of regional oceanic models. Ocean Modelling 3(1-2): 1-20.
13. Durran DR (1999) Numerical methods for wave equations in geophysical fluid dynamics. Spinger publishers, pp: 1-7.
14. Kwalik Z, Murty TS (1993) Numerical Modeling of Ocean Dynamics. World Scientific 5: 1-496.
15. Ducc DD, AnhTN, Vinh TN (2016) Applying the MIKE 21FM model to assess the impact of discharge water from Thang Long thermal power plant to the water intake area. VNU Journal of Science: Earth and Environmental Sciences 32(3S).
- Genetic Improvement of Nile Tilapia (Oreochromis niloticus): Advances in Selective Breeding and Genomic Approaches for Sustainable Aquaculture
- Microplastics, Contaminants, and Waste Hotspots: Divergences and Faults in Prioritizing Control Efforts
- Creating a Healthier, More Vibrant Open and Closed Aquatic Environment. A Submersible, Centrifugal Magnetically Affixed Current Changing Aquarium Pump
- An Attempt to Assess Alpha Diversity and Sample Size: Using the Ostracod Assemblages off Kumamoto Port, Japan
- Assessment of the Efficiency of Common Fishing Gears and Crafts Used at Mohananda River of Chapai Nawabganj, Bangladesh
- Fish Productivity and Biodiversity Status of Sundarban Mangrove in Bangladesh