Healthy Condition of Anchoveta (Engraulis Ringens) in 2021 in the Northern Region of the Humboldt Current System
The present study was to observe the healthy condition of the anchoveta population at the level of distribution, size structure, acoustic descriptors of the schools, and estimation of biomass by three acoustic stratification techniques investigated in the two research surveys carried out by the Instituto del Mar del Perú in 2021. The three techniques were: i) 10x30 mn isoparalittoral areas with size mode data (Biom 1), ii) transects proposed by Jolly & Hampton (Biom 2), and iii) in 10x30 mn isoparalittoral areas with modal size data (Biom 3). The results showed that in the 2102-07 survey, the anchoveta had a mainly concentrated spatial distribution with high abundances; while, on the 2109-11 survey, it was generally scattered by its longitudinal displacement towards areas far from the coast. At the vertical level it was found mainly in the surface layer of the 50 m, with greater depths between 14° and 16°S, which reached up to 99 m in survey 2109-11 due to good oxygenation at those depths. The structure of the sizes observed in both surveys was congruent, with latitudinal segregation between adult and juvenile specimens, and with the presence of juvenile cohorts. In the 2102-07 survey, higher values of the energy descriptors were obtained (NASC, average Sv and asymmetry), mainly of the adult specimens; while, in the 2109-11 survey, schools with greater morphometric dimensions were obtained (height, perimeter, volume, area and rectangularity) due to the wide distribution away from the coast. The biomasses estimated by the hydroacoustic methodology were similar in 2102-07 and 2109-11 surveys, determined at 12.03 and 8.03 million tons, respectively, being healthy and reflected in catches in the two fishing seasons of 2021. The three biomass estimation techniques were almost similar to those obtained in both surveys.
Introduction
The extraction of anchoveta (Engraulis ringens) is of great importance for the Peruvian economy because it generates foreign exchange for the state and because it also generates work for more than 250 thousand people who depend on it to live; mentions that the fishing sector contributes 700 thousand jobs, of which 112 thousand are generated by the extraction and fishing industry [1]; but also, excess capture can affect the ecological role it plays in the trophic chain towards other organisms [2, 3, 4]. Sustainability in fisheries is one that ensures the renewal of this species in an economically viable and socially acceptable way [5], and the Instituto del Mar del Perú (IMARPE) plays a fundamental role in guaranteeing sustainability with scientific research of the marine ecosystem, mainly in the recommendations for the opening and closing of fishing seasons, monitoring of fisheries, determination of catch volumes, conservation of marine biodiversity, protection of the environment, etc. This continuous research makes it possible to recommend appropriate management measures.
The abundance of anchoveta in the Northern Region of the Humboldt Current System (NRHCS) is due to the characteristics of this system, such as: i) high productivity and, ii) sensitivity to climate variability at different time scales in relation to other marine ecosystems [6, 7]. The high biological productivity is caused by upwelling, generating the ascent of waters rich in organic nutrients (nitrates, nitrites, etc.) and that by the action of photosynthesis activates the conversion of nutrients into organic matter for phytoplankton and zooplankton, food of anchoveta and other species [6, 8, 9, 10].
Marine environmental variability is generated by short- term (seasonal, intra-seasonal), medium-term (inter-annual, El Niño - La Niña), long-term (periodic, Decennial Oscillations) and very long-term (Secular, High and Low Environmental Variability Cycles) changes [11]. Environmental conditions can affect the carrying capacity of the ecosystem and allow different anchoveta abundance regimes [12]. This variability influences the dynamics of Cold Coastal Waters (CCW) and preferential habitat in anchoveta distribution [13, 14].
In 2021, oceanographic conditions were favorable for anchoveta, because these waters flowing from south to north were slightly cold to neutral. The official communiqués of the Multisectoral Commission in charge of the National Study of the El Niño Phenomenon (ENFEN) also reported these predominant cold conditions throughout the Peruvian coast. The spatial thermal distribution showed between January and February cold conditions in the coastal strip; while, in March they were neutral to the north of Callao, while to the south they remained cold, with nuclei of positive anomalies. In April and May, the dominant condition was cold, with nuclei greater than -2°C in April. Neutral conditions prevailed between June and August, especially in the coastal area south of Punta Falsa (06°S). In August, temperature thermal anomalies reached up to -3°C in the north-central and up to about 200 nm. In September, the development of anomalous cold conditions (<-1°C) was observed again, which in November and December extended their coverage towards the oceanic zone. With respect to salinity, it indicated the presence of equatorial surface waters (ESW) between January and March; the negative anomalies indicated a greater intrusion of these waters towards the south, which is usual for the season; while, between June and September, the presence of subtropical surface waters (SSW) and mixing waters between the CCW and SSW were observed. From October onwards, the influence of ESW outside 20 nm, atypical for the season, and mixing waters between ESW and CCW were observed in the most coastal zone [15, 16, 17, 18, 19].
These cold oceanographic conditions favored the anchoveta population in 2021, constituted in preferential habitats for the presence of anchoveta, described in [14], determined by the variables: temperature, salinity and sea surface oxygen. However, oceanographic conditions and the high variability in this current system influence the dynamics of cold coastal waters, and can affect the carrying capacity of the ecosystem, generating a negative ecological, social and economic impact.
The execution of the two hydroacoustic assessment surveys of anchoveta and other pelagic resources carried out by IMARPE in 2021, allowed the present study to be carried out in order to know mainly the inertia and center of gravity of anchoveta distribution, vertical distribution by latitudinal degree and spatial level, size structure by latitudinal degree, characteristics of anchoveta schools and biomass estimation by three hydroacoustic methodologies.
The results will provide reliable tools for fishery managers in the process of making recommendations for its extraction and fishing regulation in the two fishing seasons of this species during the year, taking into consideration a sustainable fishing policy. Due to the importance of the extraction of this species, it is necessary to carry out periodic biannual research to monitor its abundance and variability due to the hydrographic conditions, since a collapse produces an enormous negative ecological, social and economic impact. The expected results of these investigations will allow us to define the status (healthy or unhealthy) of the anchoveta in this region.
Materials and Methods
Research Activities Analyzed
For this study, the acoustic and biological data of the research surveys carried out by IMARPE were analyzed, which aimed to determine the biomass, distribution and biological-fishing aspects of the anchoveta and other pelagic resources, throughout the Peruvian maritime coast. The surveys were: Hydroacoustic evaluation survey of anchoveta and other pelagic resources 2102-07. This survey was carried out in two phases; the first phase called 2102-04 was carried out between Tumbes-Bahía Independencia from February 17 to April 1, 2021, and the second phase called 2106-07 between Punta Infiernillos-Sama from June 19 to July 13, 2021 [20]. The research coverage was the coastal zone up to 80 nm away from the coast, in which 110 transects separated by 10 and 15 nm (systematic sampling) were carried out (Figure 1).
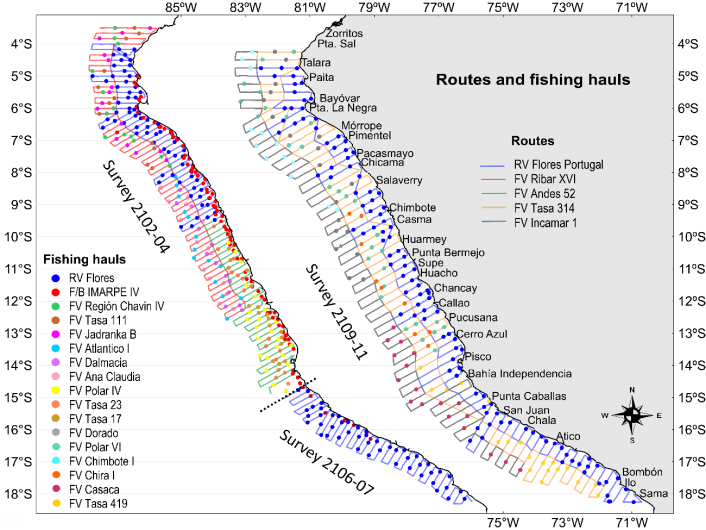
Hydroacoustic evaluation survey of anchoveta and other pelagic resources 2109-11. The survey was conducted between Punta Sal-Sama from September 22 to November 3, 2021, the research coverage was the coastal area up to 120 m distance from the coast, in which 77 transects were conducted separated by 15 mn [21].
IMARPE vessels (BIC Flores Portugal, mainly) and Sociedad Nacional de Pesquería (SNP) fishing vessels participated in both surveys (Figure 1). Each survey has a code, for example, in the case of code 2109-11, the first two numbers [21], correspond to the last two digits of the year in which the survey was made (2021) and 09-11 are the months of October-November that correspond to the period of execution of the survey.
Acoustic Data
The acoustic data were generated from the scientific echo sounder EK80 Simrad installed in the BIC Flores Portugal with 4 frequencies of sound emission (38, 70, 120 and 200 kHz), in the case of the fishing vessels of the SNP that carried out acoustic sampling, a portable EK80 scientific echo sounder with 3 frequencies of sound emission were installed (38, 70 and 120 kHz). The procedures in the analysis process are described in the “Technical Protocol for the acoustic evaluation of the distribution areas and abundance of pelagic resources in the Peruvian sea [22].
In the spatial distribution of the anchoveta was added inertia and center of gravity, inertia is a measure of dispersion of the population (NASC values) around its center of gravity; that is, the average square distance between fish. NASC (Nautical Area Scattering Coefficient) is a quantification value of the echo sounder as a consequence of the measurement of the energy emitted by a target, fish or school expressed in m2 nm-2 [23, 24]. The formulation of inertia and center of gravity is described in [25, 26, 27]. A breakdown of the spatial distribution is also shown in the form of a graph of the distribution of adults (specimens with fashions greater than 12 cm LT) and the distribution of juveniles (specimens with modes less than 12 cm of LT) for each survey. With respect to the vertical distribution, it was obtained from the exports of the regions per cell obtained with the Echoview program during the school identification process and which were classified according to three levels of abundance of the volume backscatter force (Sv), expressed in decibels (dB) referred to 1 m-1, given by the formula:
10 10log ( ) Sv Sv =
Sv is the coefficient of the backscatter volume [23], Sv abundance levels were: Scattered (between -65 to -55 dB), Dense (between -55 to -45 dB) and Very dense (between -55 to -45 dB).
To obtain the center of mass index of the vertical distribution of the schools, the formulation described in [28], was used, which allows spatially knowing the variability of anchoveta in the water column through the central position of the schools in a given area weighted according to the Sv of each one. The area was established through a grid of the Peruvian maritime domain in 30x30 nm cells.
Of these exports, the following acoustic descriptors, described in [29, 30, 31, 32]:
- Depth: It is the average depth of the school in the water column, expressed in m.
- Height: It is the average height or measure of extension of a school along the axis of the beam. The average distance of the upper and lower distances along each ping that makes up the school, is expressed in m.
- Perimeter: It is the perimeter of the school, expressed in m.
- Volume: It is the estimate of the volume of the school, assuming a cylindrical shape, expressed in m³.
- Area: It is the area of the school, expressed in m².
- Rectangularity: Expresses the deviation of a school of fish from the tendency of a rectangle shape. It is an index of the ratio between the area of the rectangle that could be formed by the height and length of the school and the observed area of the school.
- NASC: It is the dispersion coefficient of the nautical area. It is an energy measurement value emitted by a target, fish or school of fish expressed in m2.nm-2.
- Average Sv: It is the average energy or average acoustic density produced by the pixels that make up the school, expressed in dB re 1 m-1.
- Asymmetry: It is the statistic used to identify if the data of the acoustic energy of the school are distributed uniformly around the central point (mean), expressed in dB re 1 m-1.
These acoustic descriptors were classified as: i) Positional or bathymetric, which indicate the location of the school in the water column, ii) Morphometric, which indicate the dimensional characteristics of the school, and iii) Energetic, which indicate the reflected energy density of the school.
As for the biomass estimates for both surveys, NASC data from the 120 kHz frequency anchoveta were used for three stratification techniques.
Method 1: This is the stratification methodology in isoparalittoral areas of 10x30 nm, with data on the average length of fishing hauls in each area (Biom 1), whose formulation is described in [24], and [33], and is the basic methodology used by IMARPE in its research surveys.
Method 2: The second methodology is the transect stratification proposed by Jolly & Hampton, which considers the size structure associated with the nearest fishing haul. It was considered the NASC data of anchoveta from the intertransects (Biom 2), whose formulation that described in [33, 34].
Method 3: The third methodology is stratification in 10x30 nm isoparalittoral areas, with data from the entire size structure of fishing hauls in each isoparalittoral area (Biom 3), whose formulation is described in [24, 35].
Anchoveta target strength equations for different size ranges are described in [22, 24].
**Biological Data**
The size structure of anchoveta by degrees of latitude comes from the biometric sampling of the fishing hauls carried out on the surveys. An aluminum ichthyometer with double graduation was used, using the measurement to the half centimeter of the total length of the anchoveta. The size groups recorded were weighed with a digital scale (0.1 g graduation). This type of sampling is based on a simple randomized design. The anchoveta size structure of each activity corresponded to the sum of the frequency structure of each haul weighted to the catch, using the parameters of the length-weight relationship to the acoustic integration values described in [36].
**Results**
**Inertia and Center of Gravity of Spatial Distribution**
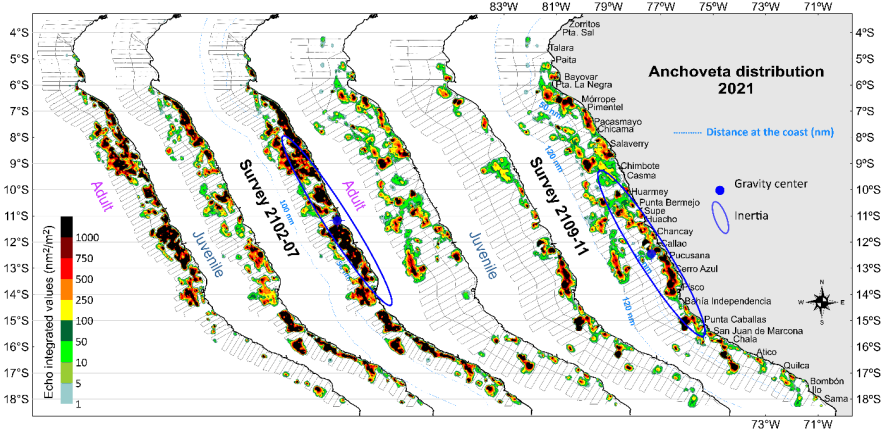
Inertia is a measure of dispersion of the weighted NASC echo-integration data, whose longitudinal diameter of the ellipse was smaller in the 2102-07 survey due to the retreat or concentration of schools towards the coast, compared to 2109-11 survey, which was wider due to the dispersion or at a greater distance from the coast. The center of gravity in 2102-07 survey was located 8 nm from Huacho (-11.19°S and -77.75°W) and in 2109-11 survey it was located 24 nm from Pucusana (-12.45°S and -77. 36°W), which indicated that a portion of the anchoveta population found in summer-autumn moved southward in the spring due to the wide distribution of potential anchoveta habitat, evidenced by the location of the center of gravity of the distribution at each survey.
However, this near-shore anchoveta retraction in the 2102-07 survey had its own characteristics, such as: i) continuity along the coast between Paita-Sama, ii) not very wide (0.5 to 80 nm offshore) between Chicama-Chimbote and off Punta Bermejo, iii) very inshore or retreating to the coast (0.5 to 30 nm offshore) between San Juan de Marcona- Sama and Paita-Morrope, and iv) abundant in the 55 nm coastal strip with important areas of high concentration distributed between Morrope-Atico. If we visualize the spatial distribution at the size structure level, we note that the adult specimens were mainly located between Mórrope- Bahía Independencia and the juvenile specimens between Mórrope-Salaverry, Callao-Pucusana and Punta Caballas- Ilo; although, the presence of juveniles was in almost all the distribution.
While, in 2109-11 survey anchoveta had a wider distribution, dispersed and far from the coast, with the following characteristics: i) continuity along almost the entire coast, recorded between Paita-Atico and Quilca- Sama, ii) very wide (0.5 to 121 nm from the coast) found between Mórrope-Cerro Azul, specifically in Mórrope and between Huarmey-Cerro Azul, and iii) generally dispersed distribution with small nuclei of high concentration located between 1 and 22 nm from Punta La Negra-Mórrope, between 1 and 20 nm from Pimentel-Chicama, in two areas between Salaverry-Chimbote (between 1 and 20 nm, and between 40-70 nm from the coast), in a nucleus between 20 and 40 nm off Callao, between 1 and 30 nm from Pucusana-Pisco, between 10 and 42 nm off Punta Caballas, and between 22 and 40 nm from Chala-Atico. Regarding the distribution by size structure, in the northern zone, mainly between Talara- Pucusana, adult specimens predominated due to the larger areas of extension; while in the south (Chancay-Chala) juvenile specimens predominated with an important area of high concentration near the coast (0.5 to 30 nm from the coast) between Callao-Pisco, in front of Punta Caballas and in Chala. Adult specimens were located more distant from the coast in this survey (Figure 2).
Vertical Distribution
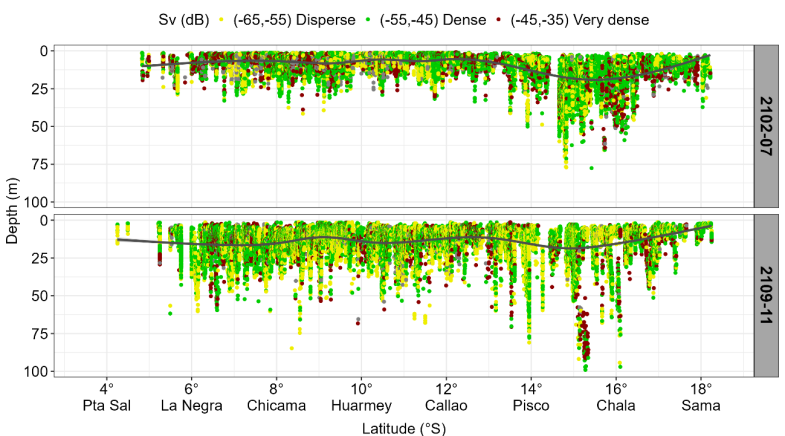
In the 2102-07 survey, 66820 schools were identified, which were recorded at a depth between 0.89 and 77.09 m with an average of 9.42 m. The location of the schools in the pelagic layer had some characteristics along the coast. The location of the schools in the pelagic layer had some characteristics throughout the coast, they were mainly recorded in the surface layer of 30 m between Paita-Punta Infiernillos and Atico-Sama; while, the deepest were found between Bahía Independencia-Atico. High abundance or high densities in the schools were observed in a large part of the coast (very dense values between -35 to -45 dB) mainly in the surface layer of 25 m and at 50 m in the south.
On 2109-11 survey, 47086 schools were identified, which were recorded at depths ranging from 1.23 to 99.06 m with an average at 14.80 m. The shallowest schools were recorded in the shallowest depths. The shallowest schools were recorded off Punta Sal, between Paita-Bayovar and between Ocoña-Sama, and the deepest were detected off Salaverry and between Pisco-Chala. There was a predominance of scattered concentrations of schools along the Peruvian coast.
In general, the schools in the spring survey (2109-11) were slightly deeper compared to the survey 2102-07, in both surveys they were found deeper in the southern zone (Pisco-Chala) (Figure 3).
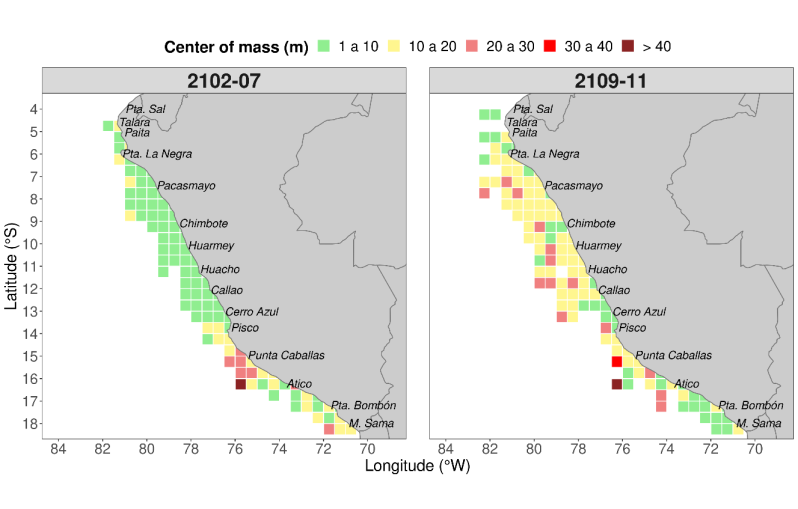
If we observe this distribution of the schools at the spatial level in the water column through its center of mass, we find that, in the 2102-07 survey the anchoveta between Talara-Cerro Azul was located mainly in the surface layer of the 10 m, to the south between Cerro Azul-Sama was variable, noting the greater deepening in the area away from the coast of Punta Caballas. In the 2109-11 survey in the area between Paita-Callao and between Pisco-Punta Caballas predominated in the layer of 10 to 20 m, with some areas between Punta La Negra-Pisco generally far from the coast in the layer of 20 to 30 m deep, a greater deepening was also observed in the area away from the coast of Punta Caballas. As in the previous graph (Figure 4), the anchoveta schools were deeper compared to the 2102-07 survey.
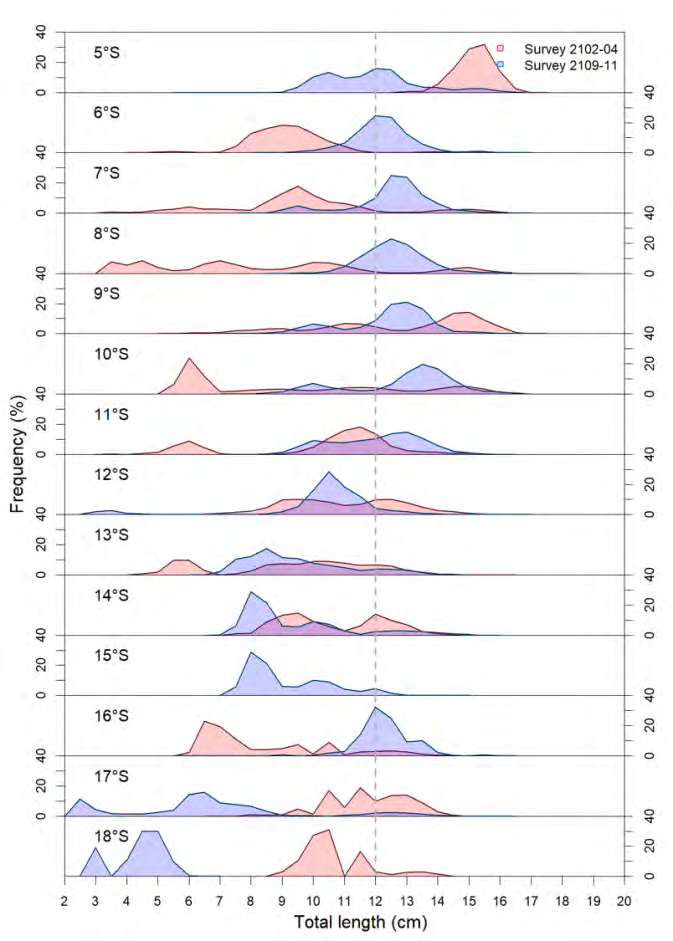
Length Structure by Latitude Grade
In the size structure we can highlight three aspects: i) the congruence of the anchoveta size groups observed in both periods, with very wide size ranges and registering pre- recruit age groups (between 0 and 0.5 years), recruits (close to one year) and adult ages (between 1 and 1.5 years), ii) in both surveys, the anchoveta was characterized by a latitudinal segregation between adults and juveniles, where adults dominated the latitudes between 05° and 12°S, while juveniles dominated the latitudes between 12° and 18°S, and finally, iii) the large number of cohorts observed in both periods is evidence of the healthy state of the resource, mainly due to the important presence of youth cohorts, which are those that would be renewing the population (Figure 5).
School Characteristics
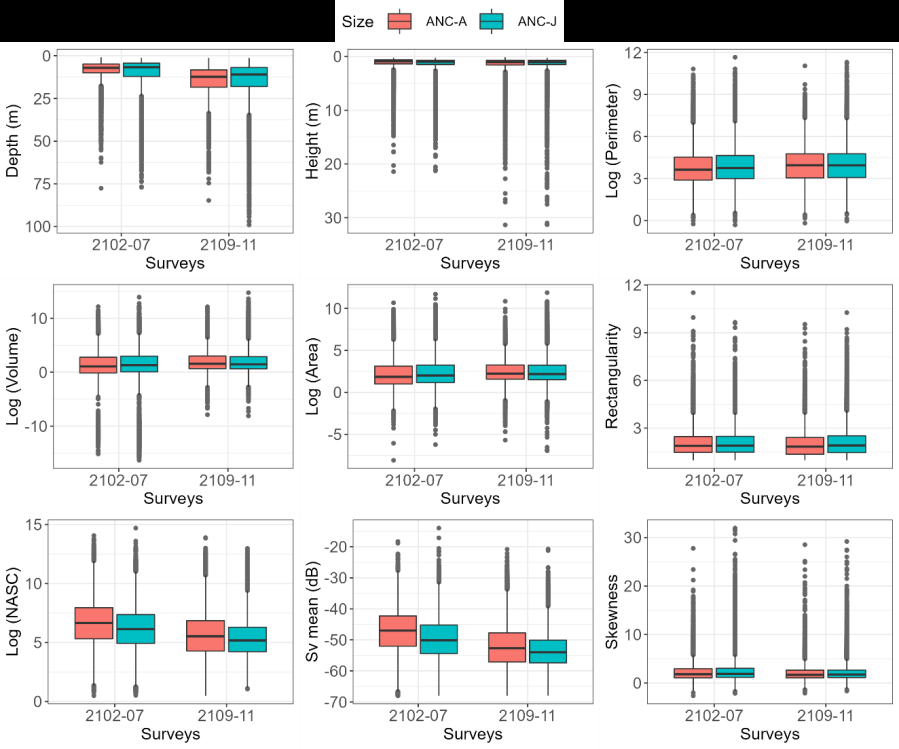
Positional or Bathymetric
Depth: In both surveys they were mainly located in the 50 m surface layer, although in survey 2109-11 they were slightly deeper, juvenile schools were recorded down to 99.06 m.
Morphometrics
Height: The majority of schools were less than 1.50 m in height in both surveys; however, in the 2102-07 survey they were found up to 21.42 m and in the 2109-11 survey they were recorded up to 31.34 m in height. There were no significant differences between the height of adult and juvenile schools. Perimeter: The perimeter of the schools between adults and juveniles were not significant; in the 2109-11 survey, schools of larger dimensions were obtained with an average of 181.27 m and in the 2102-07 survey with an average of 114.37 m. Volume: Similar characteristics occurred with the volume of the schools between adults and juveniles, also in the 2109- 11 survey, higher volumes were obtained with an average of 134.05 m3 compared to the 2102-07 survey which obtained
64.37 m3. Area: There were no significant differences in school area between adults and juveniles. In the 2109-11 survey, schools were recorded with larger areas between 1 and 36434 m2, with an average of 58.67 m2; whereas, in the 2102-07 survey they were recorded between 1 and 16567 m2, with an average of 35.80 m2. Rectangularity: The tendency of the shoal index to the shape of a rectangle between adults and juveniles did not show significant differences. In the 2109-11 survey, the average was 2.27; while in the 2102-07 survey, the average was 2.20. The highest indices were obtained in the 2102-07 survey with the adults at 11.52 and in the 2109-11 survey with the juveniles at 10.26.
Energetics
NASC: Integration values of adult schools were higher than juvenile schools in both surveys, and in the 2102-07 survey higher values were obtained than in the 2109-11 survey. In the 2102-07 survey, adults averaged 5710 m2/nm2 and juveniles averaged 2614 m2/nm2; whereas, in the 2109-11 survey, adults averaged 3119 m2/nm2 and juveniles averaged 1556 m2/nm2. Average Sv: This value had the same characteristic as the NASC values; that is, the adult schools had higher acoustic energies than the juvenile schools. Also, in the 2102-07 survey the average was higher than in the 2109-11 survey, with average values of -47.29 dB and -50.79 dB re 1 m-1, respectively. Asymmetry: This statistical value of the acoustic energy of the school showed that in the 2102-07 survey it was lower (average 2.18 dB re 1 m-1), with respect to the 2109-11 survey (average 2.27 dB re 1 m-1); that is, its distribution was more uniform in the school, as a consequence of the high concentration. Although, in the 2102-07 survey the juvenile schools obtained the highest value with 31.61 dB re 1 m-1. There were no significant differences in school asymmetry between adults and juveniles in both surveys (Figure 6).
Estimates of Anchoveta Biomass by Three Methodologies
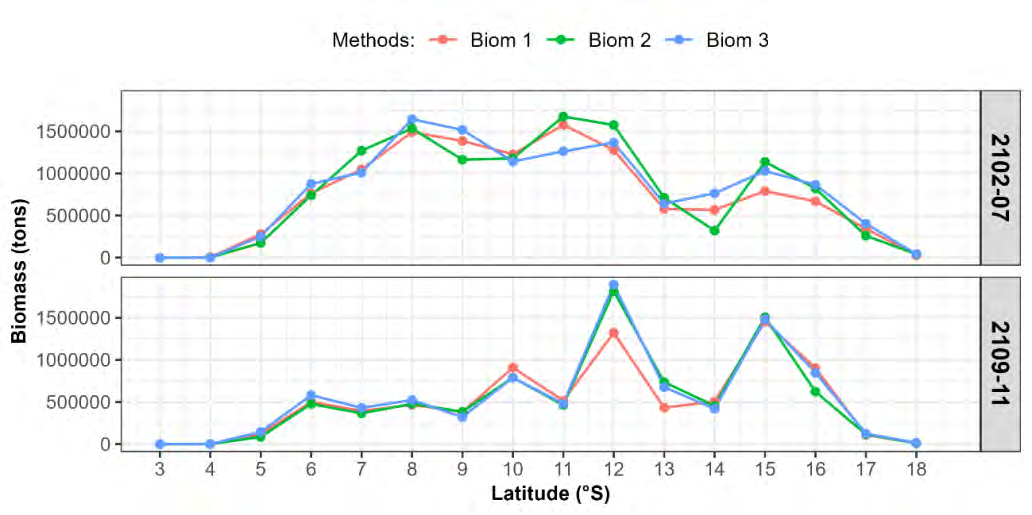
In the 2102-07 survey: i) The biomass estimated by the stratification technique in isoparalittoral areas of 10x30 mn (Biom 1), was 12.03 million tons, the highest abundances were estimated in the 11° and 08° S with 1’577,514 (13.11%) and 1’491,441 tons (12.39%), respectively. Biomass in the north-central region was estimated at 10’994,147 tons and in the southern region at 1’041,628 tons. As for the biomass by distance from the coast, it was mainly concentrated in the coastal strips of the 0-10 nm and 10-20 nm, with biomasses of 4’067,963 (33.80%) and 2’771,893 tons (23.03% of the total biomass), respectively; ii) The biomass obtained by the transect stratification technique proposed by Jolly & Hampton (1990) considering the intertransect data (Biom 2), was 12.60 million tons, with the highest abundances in the 11° and 12°S with 1’676,471 and 1’575,454 tons, respectively. In the north-central region the biomass was 11’485,013 tons and in the southern region at 1’123, 715 tons; iii) Finally, the biomass per 10x30 mn stratification composed by size structure (Biom 3), was 12.81 million tons, with the highest abundances in the 08° and 09°S with 1’644,791 and 1’517,118 tons, respectively. In the north- central region the biomass was 11’507,689 tons and in the southern region it was 1’311,264 tons.
In the 2109-11 survey: i) The biomass estimated by the stratification technique in isoparalittoral areas of 10x30 mn (Biom 1), was 8.03 million tons, the highest abundances were estimated in the 15° and 12°S with 1’454,002 (18.10%) and 1’322,792 tons (16.47%), respectively. The biomass in the north-central region was estimated at 7’007,899 tons and in the southern region 1’024,450 tons. By distance from the coast, it was found that this biomass was mainly in the coastal strip of 30-40 and 20-30 nm with 26.01% and 23.03%, respectively; ii) The biomass obtained by the transect stratification technique proposed by Jolly & Hampton (1990) considering the intertransect data (Biom 2), was 8.31 million tons, with the highest abundances in the 12° and 15°S with 1’816,739 and 1’507,855 tons, respectively. In the north- central region the biomass was 7’561,990 tons and in the southern region 750,033 tons; iii) Finally, the biomass per 10x30 mn stratification composed by size structure (Biom 3), was 8.73 million tons, with the highest abundances in the 12° and 15°S with 1’893,986 and 1’480,098 tons, respectively. In the north-central region the biomass was 7’747,087 tons and in the southern region 988,944 tons.
The three methodologies used showed similarity in the estimates, although the traditional methodology (Biom 1) was more cautious (Figure 7).
Discussion
Currently, anchoveta fishery management is based on a series of rules and regulatory measures, such as: maximum total allowable catch limit, maximum catch limit per vessel, minimum size, maximum bycatch tolerance percentage, reserved areas, closed areas, maximum tolerance percentage of juveniles, temporary closures, etc. These measures are based on fisheries research that provides scientific evidence to achieve its rational exploitation [37]. Consider that the sustainability of the anchoveta would be explained by the flexible management system of the fishery, which allows regulating the sustainable catch limits during each fishing season and also allows an efficient control of the fishing areas with high incidence and entanglement of juvenile specimens. IMARPE provides these scientific evidences through its continuous research activities.
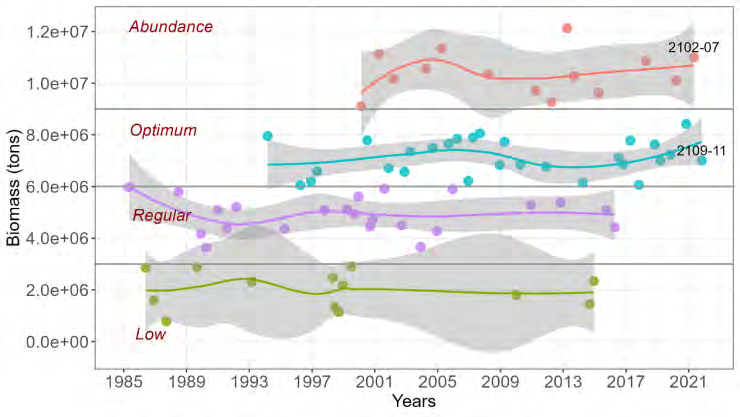
Among these activities are the hydroacoustic assessment surveys that were carried out from 1983 to date and have allowed us to know the abundance of anchoveta in the NRHCS since 1985, after the extraordinary El Niño event of 1982/1983. Throughout these years the biomass of the anchoveta has been variable, in which they were classified into 4 categories according to their abundance and the biomasses of the surveys carried out in 2021 were incorporated, the trends in recent years are optimal (Figure 8). The results and analysis obtained in these surveys evidenced their healthy condition, which were found through the concentration levels and amplitude of the spatial distribution areas, normal behavior in the vertical distribution, range and modes in the size structure, characteristics of the acoustic descriptors of the schools that were found according to their abundance levels, and the results of similar biomass estimates obtained by two acoustic methodologies.
considered that the north-central region (04 ° 30 ́-16 ° 00 ‘S) is the most important due to the high abundances founded in recent decades and in which the two fishing seasons that are executed each year are established. The centers of gravity of the spatial distribution evidence this statement [38].
The difference in the slight deepening of the anchoveta schools (vertical center of mass) obtained in the 2109-11 survey, mainly in the 10-20 and 20-30 m layer, is due to the fact that in the first few meters of depth the tidal wave is produced by the strong winds that occur during these months of the year (winter-spring).
The size structure observed during the last assessment surveys has shown congruence in terms of the results and the evolution of sizes during the following months, which supported the 2021 fishing seasons. The persistence of the same size groups observed in both surveys of 2021 evidenced a stability in the demographic structure of anchoveta, a fact that has been strengthened as a result of the favorable cold environmental scenario that has been registered throughout the year [39].
Regarding the segregation between adults and juveniles observed north of 12°S, we can mention that it is a particular spatial pattern that has been observed in recent years. However, it has not yet been discovered what factors could be conditioning this behavior, which is much less marked during the summers since the level of mixing between adults and juveniles increases [39, 40].
The high biomass of anchoveta estimated in the first part of the 2102-04 survey at 9.88 million tons of the 2102-07 survey, allowed to contribute in the management report for the determination of the quota in the first anchoveta fishing season of 2021 in the north-central region [40]. The quota was 2’509,000 tons, 98.11% of the total was caught between April 23 and August 13, 2021, and a total of 109 areas with high incidence of juveniles were closed. The ports with the highest landings were Malabrigo (27%), Chimbote (23%), Coishco (11%) and Callao (11%), precisely in the areas of high abundance of adult anchoveta found in the Morrope- Bahía Independencia survey. However, during the months of May, June and July the CCW, mainly in the northern region were expanded, which caused greater dispersion of anchoveta.
In the spring 2109-11 survey, a biomass of 7.01 million tons of anchoveta was obtained in the north-central region, determining a quota of 2’047,000 tons for the second fishing season of 2021, 29% less than the biomass observed during the summer of 2021 and 17% less than that observed in the spring of 2020. This second season began on November 22, 2021 and ended on January 15, 2022, with the participation of 697 industrial vessels, catching 98.14% of the allocated quota in the north-central region. The ports with the largest landings were Malabrigo, Chimbote and Coishco, precisely in the areas of greatest extension of the distribution of adult anchoveta between Talara-Pucusana.
In 2021, anchoveta fishing quotas were also determined for the southern region, in two seasons for a value of 409,000 tons (January-June and July-December 2021, respectively), being the largest landings in both seasons, the ports of Ilo and Mollendo. These anchoveta fishing seasons carried out in 2021 also evidenced the healthy condition of this species due to the high catch percentages in the quotas assigned in the two fishing seasons, considering the remaining percentage for its ecosystemic and fishing sustainability.
Whereas, a biological population is defined as a group of individuals of the same species that share biological properties that cause a high reproductive and ecological cohesion of the group. Reproductive cohesion implies the exchange of genetic material among individuals and ecological cohesion refers to the presence of interactions among them, resulting from having similar requirements for survival and reproduction [41]. Knowing individual and population parameters such as abundance, biomass, growth, mortality, maturity and recruitment reflect the productivity of a stock and are necessary to evaluate the status of exploited fish populations. In particular, taking into account that the deterioration of the health of a stock is a possible cause in the decline of catches and biomass, as different case studies for marine and freshwater species [42, 43]. In this sense, IMARPE evaluates these parameters through the execution of scientific surveys to determine the status of the anchoveta population. The results obtained from biomass estimates, percentages of catch quotas greater than 98% and congruence in the evolution of sizes with a large number of cohorts show the healthy state of the anchoveta population. Considering that the term healthy is an adjective that refers to what serves to preserve or restore health [44].
However, we must be careful in the presence of strong warm events, such as El Niño, equatorial Kelvin waves, etc., which alter the anchoveta’s habitat, generating migrations generally to the south in search of favorable habitats, reducing the anchoveta population in the NRHCS. Given this probable situation, continuous research monitoring is essential to have adequate management tools within the framework of its fishing sustainability.
Conclusions
In 2021 the anchoveta maintained its seasonal behavior, in the 2102-07 survey it had a distribution up to 80 nm from the coast with high concentrations; while, in the 2109-11 survey it was found up to 121 nm from the coast with greater dispersion. In the two hydroacoustic evaluation surveys conducted this year, the deepest schools were located between 14° and 16°S, which reached up to 99 m in 2109-11
survey due to good oxygenation at those depths. Congruence of anchoveta size structure observed in both 2021 surveys, with latitudinal segregation between adult and juvenile specimens, and with the presence of juvenile cohorts.
The high concentration of anchoveta schools near the coast in the 2102-07 survey generated higher values of the energetic descriptors (NASC, average Sv and asymmetry), mainly of the adults, compared to the 2109-11 survey. On the other hand, in 2109-11 survey, schools with larger morphometric dimensions (height, perimeter, volume, area and rectangularity) were obtained due to the wide distribution far from the coast and that in some occasions some schools were larger than 3 mn. The biomasses estimated by the hydroacoustic methodology determined in the 2102-07 and 2109-11 surveys at 12.03 and 8.03 million tons, respectively, were favored by the cold oceanographic conditions and were found to be healthy and were reflected in the catches in the two fishing seasons of 2021. Other biomass estimation techniques were almost similar to those obtained in both surveys.
Acknowledgments
We would like to thank the DGIHSA personnel who participated on the vessels participating in the surveys, as well as the personnel who supported the logistical and administrative activities for the surveys, such as: Ketty Ferrel, Cynthia Gonzales, Néstor Saavedra, Jairo Calderón, William Calderón, etc., who were present despite the difficulties caused by COVID-19. To Pablo Marín of the DGIRP for his support in the biological component.
References
-
Villanueva ET, Llerena CV, Concha R U, Peñafiel JB, Ríos GV, et al. (2021) Importance of the Fishing Industry in Peru, an approach towards its sustainable development. 1sh LACCEI International Multiconference on Entrepreneurship, Innovation and Regional Development - LEIRD 2021: Ideas to Overcome and Emerge from the Pandemic Crisis, pp: 1-9.
-
Muck P (1989) Major trends in the pelagic ecosystem off Peru and their implications for management. AGRIS, pp: 386-403.
-
Jahncke J, Checkley DM, Hunt GL (2004) Trends in carbon flux to seabirds in the Peruvian upwelling system: effects of wind and fisheries on population regulation. Fisheries Oceanography 13(3): 208-223.
-
Bouchon M, Ayón P, Mori J, Peña C, Espinoza P, et al. (2010) Biología de la anchoveta peruana, Engraulis ringens Jenyns. Bol Inst Mar Perú 25(1-2): 23-30.
-
FAO United Nations Fund for Food and Agriculture (2000) Indicators for the Sustainable Development of Marine Capture Fisheries. FAO.
-
Chávez FP, Bertrand A, Carrasco RG, Soler P (2008) The Northern Humboldt Current System: Brief History, Present Status and a View towards the Future. Progress in Oceanography 79(2-4): 95-105.
-
Bouchón M (2018) The anchovy fishery in Peru. PhD thesis in Marine Sciences and Applied Biology, pp: 131.
-
Morón O (2000) Characteristics of the marine environment off the Peruvian coast. Bol Inst Mar Perú 19(1-2): 179-204.
-
Espinoza P, Bertrand A (2008) Revisiting Peruvian Anchovy (Engraulis ringens) Trophodynamics Provides a New Vision of the Humboldt Current System. Progress in Oceanography 79(2-4): 215-227.
-
Oerder V, Colas F, Echevín V, Codrón F, Tam J, et al. (2015) Peru-Chile Upwelling Dynamics under Climate Change. Journal of Geophysical Research: Oceans 120(2): 1152- 1172.
-
Espino Sánchez MA (2014) Patterns of variability and fisheries in the South East Pacific. Thesis degree of Doctor in Biological Sciences, pp: 134.
-
Csirke J, Carrasco RG, Cárdenas G, Ñiquen M, Chipollini A (1996) Situation of the Anchoveta (Engraulis Ringens) and Sardine (Sardinops sagax) resources at the beginning of 1994 and prospects for fishing in Peru, with particular preference for the northern and central regions of the Peruvian coast. Bol Inst Mar Perú 15 (1): 1-23.
-
Swartzman G, Bertrand A, Gutiérrez M, Bertrand S, Vasquez L (2008) The relationship of anchovy and sardine to water masses in the Peruvian Humboldt Current System from 1983 to 2005. Progress in Oceanography 79(2-4): 228-237.
-
Castillo R, Dalla Rosa L, García W, Madureira L, Gutiérrez M, et al. (2018) Anchovy distribution off Peru in relation to abiotic parameters: A 32‐year time series from 1985 to 2017. Fisheries Oceanography 28(4): 389-401.
-
Imarpe (2022) Manifestaciones y efectos de El niño y La Niña en el ecosistema marino en 2021. Informe interno de oceanografía, pp: 9.
-
Enfen (2021) Comunicado oficial N° 02-2021. Estado del sistema de alerta: No Activo. Comisión Multisectorial encargada del Estudio Nacional del Fenómeno El Niño ENFEN 12 de febrero de 2021, pp: 6.
-
Enfen (2021) Comunicado oficial N° 06-2021. Estado del sistema de alerta: No Activo. Comisión Multisectorial encargada del Estudio Nacional del Fenómeno El Niño ENFEN 14 de junio de 2021, pp: 6.
-
Enfen (2021) Comunicado oficial N° 07-2021. Estado del sistema de alerta: No Activo. Comisión Multisectorial encargada del Estudio Nacional del Fenómeno El Niño ENFEN 12 de julio de 2021, pp 6.
-
Enfen (2021) Comunicado oficial N° 09-2021. Estado del sistema de alerta: No Activo. Comisión Multisectorial encargada del Estudio Nacional del Fenómeno El Niño ENFEN 13 de setiembre de 2021, pp: 6.
-
Castillo PR, Valdez C, Grados D, Pozada M, Cuadros G, et al. (2022) Distribución y biomasa de los principales recursos pelágicos marinos determinados por acústica verano-otoño 2021. Instituto del Mar del Perú 49(2): 1-18.
-
Imarpe (2021) Informe ejecutivo del crucero 2109- 11 de Evaluación Hidroacústica de Anchoveta y Otros Recursos Pelágicos, realizado entre el 22 de setiembre al 03 de noviembre del 2021. Informe interno IMARPE, pp: 56.
-
Castillo PR, Peraltilla S, Aliaga A, Flores M, Ballón M, et al. (2011) Protocolo técnico para la evaluación acústica de las áreas de distribución y abundancia de recursos pelágicos en el mar peruano. Versión 2009. Instituto del Mar del Perú 36(1-2): 7-28.
-
MacLennan DN, Fernandes PG, Dalen J (2002) A consistent approach to definitions and symbols 508 in fisheries acoustics. ICES Journal of Marine Science 59(2): 365-369.
-
Simmonds J, MacLennan D (2005) Fisheries Acoustics. Theory and Practice. Fisheries Processing & Methods, pp: 436.
-
Bez N and Rivoirard J (2001) Transitive geostatistics to characterize spatial aggregations with diffuse limits: an application on mackerel ichtyoplankton. Fish Res 50(1- 2): 41-58.
-
Woillez M, Poulard JC, Rivoirard J, Petitgas P, Bez N (2007) Indices for capturing spatial patterns and their evolution in time, with application to European hake (Merluccius merluccius) in the Bay of Biscay. ICES Journal of Marine Science 64(3): 537-550.
-
Castillo PR, Ñiquen M, La Cruz L, Carrasco RG, Cuadros G (2021) Migration behavior of anchoveta (Engraulis ringens) in the Northern Humboldt Current System between September 2019 and September 2020. Latin American Journal of Aquatic Research 49(5): 702-716.
-
Urmy SS, Horne JK, Barbee DH (2012) Measuring the vertical distributional variability of pelagic fauna in Monterey Bay. ICES Journal of Marine Science 69(2): 184-196.
-
Weill A, Scalabrin C, Diner N (1993) MOVIES-B: acoustic detection description software. Application to shoal species’ classification. Aquatic Living Resources 6(3): 255-267.
-
Scalabrin C, Diner N, Weill A, Hillion A, Mouchot MC (1996) Narrowband acoustic identification of mono specific fish shoals. ICES Journal of Marine Science 53(2): 181-188.
-
Diner N (2001) Correction on school geometry and density: approach based on acoustic image simulation. Aquatic Living Resources 14(4): 211-222.
-
Diner N (1998) Correction on school geometry and density. In ICES C M 1998: 1.
-
Castillo PR, La Cruz L, Grados D, Cornejo R, Guevara R, et al. (2022) Anchoveta (Engraulis ringens) Biomass in the Peruvian Marine Ecosystem Estimated by Various Hydroacoustic Methodologies during Spring of 2019: A Recent Study. New Visions in Biological Science 8(3): 35- 55.
-
Jolly D, Hampton I (1990) A stratified random transect design for acoustic surveys of fish stocks. Can J Fish Aquat Sci 47(7): 1282-1291.
-
Simmonds EJ, Gutiérrez M, Chipollini A, Gerlotto F, Woillez M, et al. (2009) Optimizing the design of acoustic surveys of Peruvian anchoveta. ICES Journal of Marine Science 66(6): 1341-1348.
-
Imarpe (2020) Protocolo Elaboración de la Tabla de Decisión para la determinación del Límite Máximo Total Permisible por temporada de pesca en la pesquería del stock norte-centro de la anchoveta peruana. IMP-DGIRP/ AFDPERP, pp: 40.
-
Oliveros Ramos R, Ñiquen M, Csirke J, Guevara Carrasco R (2021) Management of the Peruvian anchoveta (Engraulis ringens) fishery in the context of climate change. Adaptive management of fisheries in response to climate change, pp: 237.
-
Ñiquen M, Bouchón M, Cahuín S, Díaz E (2000) Pesquería de anchoveta en el mar peruano: 1950–1999. Bol Inst Mar Perú 19(1-2): 117-123.
-
Imarpe (2021b) Informe Situación del stock norte- centro de la anchoveta peruana (Engraulis ringens) al 01 de noviembre de 2021 y perspectivas de explotación para la segunda temporada de pesca del año. Informe del instituto del Mar del Perú, pp: 46.
-
Imarpe (2021) Informe Situación del stock norte-centro de la anchoveta peruana (Engraulis ringens) a abril de 2021 y perspectivas de explotación para la primera temporada de pesca del año. Inf Inst Mar Perú, pp: 59.
-
Morláns MC (2004) Introducción a la ecología de poblaciones. Área de Ecologís Editorial Científica Universitaria. Universidad Nacional de Catamarca.
-
Lambert Y, Dutil JD (1997) Can simple condition indices be used to monitor and quantify seasonal changes in the energy reserves of Atlantic cod (Gadus morhua)?. Can J Fish Aquat Sci 54(1): 104-112.
-
Zimmerli S, Bernet D, Burkhardt Holm P, Schmidt Posthaus H, et al. (2007) Assessment of fish health status in four Swiss rivers showing a decline of brown trout catches. Aquat Sci 69: 11-25.
-
Pérez Porto J, Gardey A (2010) Definition of healthy- What it is, Meaning and Concept. Definition.
- Genetic Improvement of Nile Tilapia (Oreochromis niloticus): Advances in Selective Breeding and Genomic Approaches for Sustainable Aquaculture
- Microplastics, Contaminants, and Waste Hotspots: Divergences and Faults in Prioritizing Control Efforts
- Creating a Healthier, More Vibrant Open and Closed Aquatic Environment. A Submersible, Centrifugal Magnetically Affixed Current Changing Aquarium Pump
- An Attempt to Assess Alpha Diversity and Sample Size: Using the Ostracod Assemblages off Kumamoto Port, Japan
- Assessment of the Efficiency of Common Fishing Gears and Crafts Used at Mohananda River of Chapai Nawabganj, Bangladesh
- Fish Productivity and Biodiversity Status of Sundarban Mangrove in Bangladesh