Evaluation of Fungal Diversity in Water and Sediment, AgbaNdele Segment, Sombriero River, Rivers State
This study was carried out between September and December, 2022 in Sombriero river to assess the water and sediment quality using fungal load and diversity. Water and sediment samples collected were analysed in the laboratory for fungi using standard method of APHA and the obtained data were subjected to descriptive and inferential statistics. The results showed that Total fungi in water (Tfw) and sediment (TFs) ranged from 1.0x101 to 1.4x10²cfu/ml and 1.0x101 to 1.7x10²cfu/g with the overall mean values of 114.37±35.397 cfu/ml and 168.44±358.999 cfu/g respectively. Spatial mean values of TFw and TFs varies significantly at p<0.05 with station 3 higher than all other stations. TFw and TFs values exhibited non-seasonality and seasonality respectively at p<0.05. The total of 5 and 6 fungal species observed in the water and sediment samples included Aspergillus niger, Rhizopus oligospora, Pennicilium species, Mucoccus caris and Micrococcus caris with Fusarium solani absent in water. The values of diversity indices varied spatially with Simpson’s dominance index (D) of fungi in water ranging between 0.2503 and 0.6428 while that of sediment ranged from 0.255 to 0.609. Based on the fungal load, diversity index and some pathogenic species the water is therefore under stress/threat. There is need to regulate the anthropogenic activities in the area to avoid further discharge of wastes capable of causing further pollution of the area.
Introduction
The global increase in loads and diversity of microbial organisms such as fungi especially in the aquatic ecosystem including biota is attributed to increased anthropogenic activities causing indiscriminate discharge of organic and inorganic wastes into the aquatic environment [1, 2, 3]. Microbes play diverse roles in biotechnology among which is bio-remediation referred to as use of biota in the cleanup of polluted environment [4]. Fungi are known to exhibit diverse growth pattern such as secretion of extracellular enzymes and invasive mode of growth. It has been noted that the release of petroleum and its related products artificially or naturally into the environments endangers aquatic and terrestrial life forms by causing devegetation, contamination of portable water sources, fall in reproduction of biota due to disruption in food chain and death of biota inhabiting polluted environment [5].
The globally grown interest in the occurrence and diversity of fungi and their secondary metabolites in the aquatic ecosystems is attributed to their roles in water quality and human health [1]. According to WHO [6] as reported by Otene BB, et al. [3] water could be considered safe and fit for human consumption when it cannot cause any significant health hazard when consumed and that which has microbial, chemical and physical properties that meet the World Health Organization Guidelines.
The presence of certain fungi species (toxic) in water tends to infect the aquatic animals including those consumed by man as opined by Otene BB, et al. [3] and Jalees MM, et al. [7] opined that fungi species such as Aspergillus, Pencillium, Rhizopus, Blastomyces and Aternaria are responsible for infecting fish organs. Agba-Ndele river which is a segment of Sombricro river has been considered as an essential water body considering the activities going on in the area and the fact that it is a source of livelihood for the inhabitants. Oil exploration and other anthropogenic activities are ongoing in the area. Several researches have been carried out in this area but to the best of my knowledge only few works on fungal diversity has been done in this river. This paper is therefore aimed at investigating the fungal load and diversity in water and sediment as to ascertain its health/pollution status.
Materials and Method
Study Area
This research was carried out in Agba-Ndele river, a segment of Sombriero river which is a mangrove intertidal wetland and a thicky populated municipal environment. The study was carried out at the middle reaches of Sombreiro River at Agba-Ndele, Rivers State, Nigeria with the coordinate to be 4.8976° E and 6.6990° N. The water is a tidal fresh water part of the Sombreiro river which serves as a boundary between Agba-Ndele in Emohua Local Government Area and Abua, Rivers State.
Sample Collection
Four sampling stations were selected within the study area with a distance of 500m apart considering ecological setting and human activities. Water samples were collected from the respective stations for four months in ragolis bottles as described in APHA,2012 in Otene et al.(1). Sediment samples were collected also from the bottom of water using Eckman grab as described in APHA. Samples were transported to the laboratory for further analysis where they were sorted, rinsed, processed and kept in refrigerator.
Isolation and Identification of Fungi
Each of 1.0g and 1.0ml of sediment and water samples were aseptically diluted in nutrient broth followed by 0.1ml aliquots of each 10 fold serially diluted samples transferred into triplicate plates of Rose-Bengal Chloramphenicol (RBC) agar and Bushnell-Hass (mineral salt) agar supplemented with 0.05% (v/v) streptomycin. Total heterotrophic fungal counts (THF) were obtained from the innoculated RBC agar after incubation for 24hrs at 37°C. Fungal colonies were subcultured on nutrient agar plates to obtain pure culture and stored on agar slants in the refrigerator at 4°C. Isolates were identified using morphological features Chessbrough, et al. followed by microscopy after staining with lactophenol collon blue [8].
Analysis of Data
A PAST Software Version 4 and Statistical packages for Social Sciences (SPSS) version 25 were used in carrying out the statistical analysis of the fungi data for descriptive and inferential statistics at P<0.05. The Analysis of variance (ANOVA) was determined while the spatial means were subjected to Duncan Multiple Range Test (DMRT) for differences at p<0.05.
Calculation of Bio-Indices
The fungal diversity indices such as Simpson’s dominance index (D), Simpson index of diversity (1-D), Simpson’s reciprocal index (1/D), Shannon diversity index (H’), evenness index (E1), Brillouin (HB), Menhinick’s Index of Species Abundance, Margalef’s index of species richness (S), equitability (J), fisher alpha and Berger-parker (d) were estimated for each sampling point using the appropriate formulae as in Otene et al.(1).
Fungal species richness in the sites was evaluated using two indices; menhinick’s and margalef’s indices.
These indices were used to obtain estimation of species diversity, species richness and species evenness.
Species richness (R1 and R2) obtained using the equations
$$R1 = \frac{S - 1}{N} = S - 1/\text{Log}_E N$$
$$R2 = \frac{S}{\sqrt{\sum i n i}}$$
Where,
$R$ = Index of species richness
$S$ = Total number of species
N = Total number of individuals
Ln= Natural logarithm
Shannon and Wiener (1949) and Simpson (1949) diversity index values were obtained by using the following equation:
$$\text{Shannon’s index} = -\sum_n \left( \frac{ni}{N} - \log 2 \left( \frac{ni}{N} \right) \right)$$
Simpson’s Diversity Index (D)
This is a measure of diversity used to quantify the biodiversity of a habitat. It takes into account the number of species present as well as abundance of each species. It measures the probability that two individuals randomly selected from a sample will belong to the same species (or some category other than species).
$$\text{Simpson index} = \frac{\sum i n i (-1)}{N(N-1)}$$
Where $ni$ = the number of individuals in the $i$th species
$N$ = the total number of individuals
$S$ = the total number of species
The value of $D$ ranges between 0 and 1.
Simpson’s indices of diversity (1-D) and reciprocal (1/D) are obtained from Simpson’s dominance index by subtracting dominance index from 1 and dividing 1 by dominance index respectively.
$$\text{Dominance index} = 1 - \left( \frac{\sum i n i (-1)}{N(N-1)} \right)$$
Species evenness index (E) was determined using the following expression:
$$H' / \text{Log}_E S \text{ (Pielou, 1966)}$$
Shannon’s equitability (EH) was calculated with the equation:
$$\frac{\sum i \left( \frac{ni}{N} \ln \frac{ni}{N} \right)}{\ln N}$$
Species Equitability or Evenness (J) Jaccard
This is a measure of how evenly the individuals are distributed among the species present in a sample. It ranges between 0 and 1, the maximum value. One represents a situation where individuals are spread evenly among the species present Jaccard (1912). It was calculated as follows:
- Dominance index is used to characterize most conspicuous and abundant species with its relative importance related to degree of influence it has on ecosystem components.
- The Berger – Parker Dominance Index is a simple measure of the numerical importance of the most abundant species.
$$\text{Berger – Parker Dominance Index} = \frac{(n \max)}{N}$$
Where
nmax= maximum number of organisms
N= Total number of individuals
Fisher’s alpha is a diversity index, defined implicitly by the formula:
$$S = a * \text{Log}_E (1 + n/a)$$
Where $S$ is number of species, $n$ is number of individuals and $a$ is the Fisher’s alpha.
The Berger–Parker index equals the maximum $pi$ value in the dataset or sampling station, i.e. the proportional abundance of the most abundant species.
Where $pi = ni/N$ as has been earlier expressed.
Results
Total fungi in water (Tfw) ranged from 1.0x101 (Station 4 October) to 1.4x10² (Station 3 September) with the overall mean value of 114.37±35.397 cfu/ml while Total fungi in the sediment (Tfs) ranged from 1.0x101 (Station 1 November) to 1.7x10² (Station 3 December) with the overall mean value of 168.44±358.999 cfu/ml (Tables 1 & 2). This showed that the fungi load of sediment is higher than that of the water. The spatial mean value of Tfw was highest in station 3 (142.50±34.034 cfu/ml) but lowest in station 4 (95±57.45cfu/g) while TFs was highest in station 3 (470.00±686.73 cfu/ml) but lowest in station 1 (35±50.00 cfu/ml). Spatial mean values of TFw and TFs varies significantly with station 3 higher than all other stations at $p<0.05$ (Table 3). The monthly values of TFw and TFs were uniform throughout the period of study except in the Months of November and October respectively (Figure 1). TFw values exhibited non-seasonality though with higher wet season value than the dry season while TFs values exhibited seasonality with higher dry season than wet season values at $p<0.05$ (Figure 2). The range and mean values of fungi in water exceeded the permissible limits of WHO/FAO and EPA.
| S/No | Isolate Parameters | Mean | Mini | Max | WHO/FAO | EPA |
|---|---|---|---|---|---|---|
| 1 | Tfw | 114.37±35.397 | 10 | 190 | 102 | 102 |
| 2 | Tfs | 168.44±358.999 | 10 | 1500 |
Table 1: Overall Mean Value for Fungi 1solates in the Area.
| Month | Station | Season | TFw | TFs |
|---|---|---|---|---|
| Sept. | 1 | A | 1x10^{2}$ | $1x10^{1}$ |
| Sept. | 2 | A | 1.2x10^{2}$ | $1.0x10^{1}$ |
| Sept. | 3 | A | 1.4x10^{2}$ | $1.0X10^{2}$ |
| Sept. | 4 | A | 1.3X10^{2}$ | $1.0X10^{2}$ |
| Oct | 1 | A | 1.0x10^{2}$ | $1.0x10^{2}$ |
| Oct | 2 | A | 1.2x10^{2}$ | $1.1x10^{1}$ |
| Oct | 3 | A | 1.1x10^{2}$ | $1.2x10^{2}$ |
| Oct | 4 | A | 1.3x10^{1}$ | $0.9x10^{2}$ |
| Nov | 1 | B | 1.1x10^{2}$ | $1x10^{1}$ |
| Nov | 2 | B | 1.2x10^{2}$ | $1.2x10^{2}$ |
| Nov | 3 | B | 1.3x10^{2}$ | $1.5x10^{2}$ |
| Nov | 4 | B | 1.0x10^{1}$ | $1.0x10^{2}$ |
| Dec. | 1 | B | 1.0x10^{2}$ | $1.0x10^{1}$ |
| Dec. | 2 | B | 1.1x10^{2}$ | $1.0x10_{2}$ |
| Dec. | 3 | B | 1.9x10^{2}$ | $1.7x10^{2}$ |
| Dec. | 4 | B | 1.1x10^{1}$ | $1.3x10^{2}$ |
Table 2: Monthly and Spatial Value of Fungi in the Study Area.
Key: Number of Month September to December, Number of Station 1 to 4, Season A = Wet Season (September to October) B = Dry Season (November to December). Key: TFW= Total fungi in water, TFS= Total Fungi in sediment Table 2: Monthly and Spatial Value of Fungi in the Study Area.
| S/No | Parameters | Stn 1 | Stn 2 | Stn 3 | Stn 4 |
|---|---|---|---|---|---|
| 1 | Tfw | 102.50±0.50c | 117.50±5.00b | 142.50±34.034a | 95±57.45c |
| 2 | Tfs | 35±50.00c | 55.50±51.965c | 470.00±686.73a | 105.25±17.23b |
Table 3: Spatial Mean Value Fungi Isolate.
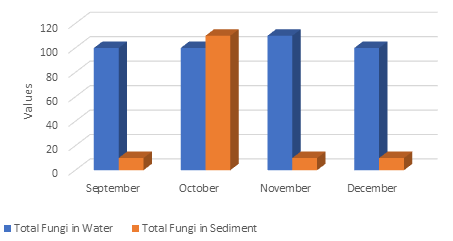
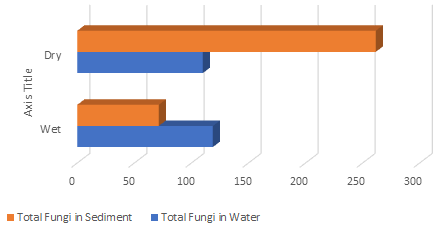
Table 4 showed the macroscopic and microscopic characteristics of fungi in the study area. A total of 5 and 6 fungal species were observed in the water and sediment samples respectively which include Aspergillus niger, Rhizopus oligospora, Pennicilium species, Fusarium solani, Mucoccus caris and Micrococcus caris with Fusarium solani absent in water.
| Macroscopic Characteristics | Microscopic | Water | Sediment | Suspected Fungi | |
|---|---|---|---|---|---|
| 1 | Dark brown colony with dense growth grow to cover plate | Conidia head are radiated, conidiosphore is unbranched, no rhizoid, hyphae is seplate. | +ve | +ve | Aspergillus niger |
| 2 | Pale brownish grey colour and fast growing whitish colony seen | Black pigmentation, sporangim | +ve | +ve | Rhizopus oligospora |
| 3 | Green pigmentation with white black ground powdery surface in shape with elevated centre see. | Coniifophor is septate, erect, and | +ve | +ve | Penicillium spp |
| 4 | White colony with mass rapid growth covering the surface | Short cresent shaped conidiophores microcomidia hyphae septate | -ve | +ve | Fusarium solani |
| 5 | Cotton wool like aerial mycelia first grey in colour later become darker | Non-seplate mycelia bears sporangio scattered over the mycelia. Sporangio are erect and branched | +ve | +ve | Mucoccus caris |
| 6 | Lemon yellow apron seen with pigments | Gradnules on the surface of the conidia are many. | +ve | +ve | Micrococcus caris |
Table 4: Macroscopic and Microscopic Characteristics of Fungi Isolates.
Tables 5 & 6 showed the diversity indices of fungi in water and sediment. Simpson’s dominance index (D) for fungi in water ranged between 0.2503 (Station 2) and 0.6428 (Station 4) with the mean value of 0.351 while that of sediment ranged from 0.255 (Station 4) to 0.609 (Station 1) with the mean value of 0.387. Simpson’s index of diversity (_I-D) of fungi in water ranged between 0.3572 (Station 4) and 0.7497 (Station 2) with the mean value of 0.649 while that of sediment ranged from 0.391 (Station 1) to 0.7449 (Station 4) with the mean value of 0.613. Shannon index for water ranged between 0.7369 (Station 4) to 1.386 (Station 2) with the mean value of 1.219 while that of sediment ranged between 0.794 (Station 1) and 1.376 (Station 4) with the mean value of 1.130. Evenness index for water was between 0.5224 (Station 4) and 0.9993 (Station 3) with the mean value of 0.875 while that of sediment was between 0.553 (Station 1) and 0.990 (Station 4) with the mean value of 0.798. Brillouin index for fungi in water and sediment are as in the table below.
| Indices | 1 | 2 | 3 | 4 | Mean | Range |
|---|---|---|---|---|---|---|
| Dominance_D | 0.2504 | 0.2503 | 0.2607 | 0.6428 | 0.351 | 0.2503-0.6428 |
| Simpson_1-D | 0.7496 | 0.7497 | 0.7393 | 0.3572 | 0.649 | 0.3572-0.7497 |
| Shannon_H | 1.385 | 1.386 | 1.366 | 0.7369 | 1.219 | 0.7369-1.386 |
| Evenness_e^H/S | 0.9991 | 0.9993 | 0.9796 | 0.5224 | 0.875 | 0.5224-0.9993 |
| Brillouin | 1.363 | 1.366 | 1.349 | 0.6985 | 1.194 | 0.6985-1.366 |
| Menhinick | 0.1975 | 0.1845 | 0.1675 | 0.3123 | 0.216 | 0.1675-0.3123 |
| Margalef | 0.4987 | 0.4876 | 0.4728 | 0.5883 | 0.512 | 0.4728-0.5883 |
| Equitability_J | 0.9994 | 0.9995 | 0.9851 | 0.5316 | 0.879 | 0.5316-0.9995 |
| Fisher_alpha | 0.615 | 0.6002 | 0.5805 | 0.74 | 0.634 | 0.5805-0.740 |
| Berger-Parker | 0.2683 | 0.2553 | 0.3333 | 0.7927 | 0.412 | 0.2683-0.7927 |
| Chao-1 | 4 | 4 | 4 | 4 |
Table 5: Diversity Indices for Fungi in Water.
| Indices | 1 | 2 | 3 | 4 | Mean | Range |
|---|---|---|---|---|---|---|
| Dominance_D | 0.6095 | 0.4239 | 0.2599 | 0.2551 | 0.387 | 0.255-0.609 |
| Simpson_1-D | 0.3905 | 0.5761 | 0.7401 | 0.7449 | 0.613 | 0.391-0.7449 |
| Shannon_H | 0.7937 | 0.9851 | 1.366 | 1.376 | 1.13 | 0.794-1.376 |
| Evenness_e^H/S | 0.5529 | 0.6695 | 0.9801 | 0.9902 | 0.798 | 0.553-0.990 |
| Brillouin | 0.7468 | 0.9558 | 1.349 | 1.355 | 1.102 | 0.7468-1.349 |
| Menhinick | 0.3508 | 0.2577 | 0.1721 | 0.1952 | 0.244 | 0.1721-0.351 |
| Margalef | 0.6163 | 0.547 | 0.4768 | 0.4967 | 0.534 | 0.4768-0.616 |
| Equitability_J | 0.5726 | 0.7106 | 0.9855 | 0.9929 | 0.816 | 0.5726-0.993 |
| Fisher_alpha | 0.7812 | 0.6813 | 0.5859 | 0.6123 | 0.665 | 0.5859-0.7812 |
| Berger-Parker | 0.7692 | 0.4979 | 0.3148 | 0.3095 | 0.473 | 0.3095-0.7692 |
| Chao-1 | 4 | 4 | 4 | 4 |
Table 6: Table Diversity Indices of Fungi in Sediment.
Discussion
Reports from different researchers Shah JA, et al. [9] and Otene BB, et al. [1] revealed species in the natural community respond differently to the varying environmental conditions whether biotic or abiotic which causes diverse niche organizations and consequently diverse communities. The observed mean values and ranges in this study are less than the finding of Otene BB, et al. [3] in Trans-Amadi/Woji Creek. This range is also lower than the ranges (0.1x10⁴cfu/100ml to 4.6x10⁴cfu (100ml) and 0.4x10⁴cfu/100g to 42.5x10⁴cfu/100g for water and sediment respectively reported by Doi SA, et al. [10] from Araca Bay in Sao Sebastiao. This value is also lower than the range (5.2x10⁵cfu/g and 9.7x10⁵cfu/g) reported by Pupin B, et al. [11] from a swamp on Cardoso Island.
The spatial and temporal variations in fungal population observed in this study could be attributed to some biotic factors and anthropogenic activities in the respective areas. This confirms the assertion by Sharma MS, et al. [12] that variation and biodiversity of fungal population could be caused by soil pH, moisture content, salinity, organic carbon, nitrogen, sulphur and potassium. The higher fungal load in station 3 in both water and sediment in this study could be attributed to high level of anthropogenic activities in the area. This therefore, corresponds with the assertion that certain physical and chemical aspects of the environment including temperature and pH are important for the survival adaptability and growth of microbes such as fungi [13]. Similarly, Wong MKM, et al. [14] opined that temperature affects the distribution and diversity of fungi and exist more in the tropic than temperate waters. The observed uniform fungal load in most of the months could be due to uniform rainfall and decomposition during the period. The observed non-seasonality in fungal value in this study could be attributed to uniformity in anthropogenic activities during the wet and dry season. The observed higher fungal load in the wet than the dry season in this study is in tandem with the finding of Otene BB, et al. [1] (though without seasonality) in Trans-Amadi/Woji Creek which was attributed to high level of nutrient resulting from decomposition of allochthonous materials in the area. This could also be attributed to the assertion by Venugopal P, et al. [15] that the dynamic for fungal community may be attributed generally to abiotic variables and nature of substrate in the area. The exceedance of the permissible limits of WHO/FAO by the fungal load in this study is a clear indication that the area/water is polluted and therefore unsafe for human consumption. WHO [6] opined that water can be considered safe and fit for human consumption if it cannot cause any significant health hazard when consumed and that it has microbial, chemical and physical properties that meet the World Health Organization Guidelines.
The observed 5 to 6 fungal species in water and sediment respectively in this study is contrary to the eight (8) species reported by Otene BB, et al. [1] from Trans- Amadi/Woji Creek and nine (9) species reported by Kortee NK, et al. [16]. However, this result is in line with the four (4) species reported by Ibrahim WH, et al. [17]. The species of fungi such as Aspergillus niger, Rhizopu species, Penicillium species etc observed in this study is similar to those reported by Abolude DS, et al. [18] in Zaria. According to Kelly MG, et al. [19] mycotoxins and other metabolites can be produced by fungi in water which could be extremely diluted thereby reducing its toxicity. Consumption of mycotoxins in small amount over a long period of time could cause hazardous health effect to man [20].
Hoog D, et al. [21] and Otene BB, et al. [22] reported that diversity index is a qualitative measure that reflects how many different species in a data set and simultaneously taken into account how evenly the basic entities (such as individual are distributed among these types. Chiu GS, et al. [23] opined that biological diversity, abundance, tolerance and composition are community metrics frequently used inadequate environment to assess ecosystem health.
In this study, there has been no much variation among most of the diversity indices used across the stations and could be attributed to similarity in anthropogenic activities in the respective sampling stations. Simpson dominance index in this study which were highest in Station 4 and 1 for fungi in water and sediment respectively clearly satisfied the assertion by Otene BB, et al. [22] in Whittaka RH [24] that Simpson diversity index is usually higher where community is dominated by less number of species and when the dominance is shared by large number of species.
Considering the values of Shannon Wiener index in the respective media, the water and sediment are said to be moderately and heavily polluted. This is in line with the William JL, et al. [25] classification that values of the index greater than 3 indicated clean water values, range of 1 to 3 is moderately polluted while that less than 1 (<1) is heavily polluted. The consistent higher values of Shannon Wenner index in water across the Stations 1-3 in this study confirmed the assertion by Davies OA, et al. [26] that they are indicators of environmental pollution. Shannon Wenner index in this study is less than the value (3.90) reported by Antai EE, et al. [27] in great Kwa rivers, Cross River State which was attributed to difference in environmental factors. The Evenness/Equitability value showed that there is evenness in fungal distribution in water across the stations except Station 4 unlike in the sediment where there is inconsistency and unevenness in species distribution except in Stations 3 and 4. The non-evenness in species distribution in water (Station 4) and sediment (Station 3 and 4) could be attributed to stress resulting from more anthropogenic activities in the areas. The consistent fluctuation in Margalef and Menhinick indices in this study (for water and sediment)) could be attributed to fluctuation in fungal population/species across the stations in both water and sediment.
The species of fungi such as Aspergillus niger, Penicillium species, Mucor species etc isolated from the study area have been reported to be causative agents of asthma, hypersensitivity, pneumonia and pulmonary mycosis [28, 29]. Other diseases known to be caused by these fungi are Aspergillosis by Aspergillus species [30, 31]. Ariyo AB, et al. [32] and Sokolo RS, et al. [33] reported some of these fungi to be waste degraders in aquatic environment [34].
Conclusion and Recommendation
The Agba-Ndele segment of Sombriero river is under threat /stress considering the species of fungi isolated in this study and the fact that the fungal load of the water exceeded the permissible limits (102cfu/ml) set by World Health Organisation (WHO), Food and Agriculture Organisation and Environmental Protection Agency (EPA) guidelines. The observed/calculated bio-indices values in this study especially Shannon wiener index which ranged between 0.7369-1.386 showed moderate pollution since it is between the range of 1-3. There is therefore the need to regulate the anthropogenic activities in the area to avoid further discharge of wastes capable of causing further pollution of the area [35, 36].
References
-
Otene BB, Ejiko EO, Deekae SN (2021) Fungal Diversity in Water and Mangrove Oyster (Crassotrea Gasar), Woji/ Trans-Amadi Creek, Port Harcourt, Nigeria. International Journal of Research and Innovation in Applied Science (IJRIAS) 6(2): 218-223.
-
Otene BB, Alfred-Ockiya JF, Amadi F (2019) Physicochemical Properties and Zooplankton Community Structure of Okamini Stream, Port Harcourt, Nigeria. International Journal of Research and Innovation in Applied Science (IJRIAS) 4(6): 100-107.
-
Otene BB, Chukwu KO, Pepple FS (2021) Microbiological Properties of Water and Sediment of New Calabar River, Port Harcourt, Nigeria. Journal of Aquatic Sciences 36(2): 199-222.
-
Chikere CB, Azubuike CC (2014) Characterization of hydrocarbon utilizing fungi from hydrocarbon polluted sediments and water. Nig J Biotech 27: 49-54.
-
Chikere CB, Azubuike CC (2013) Catechol-2,3- dioxygenase screening in putative hydrocarbon utilizing bacteria. Int Res J Microbiol 4(1): 1-6.
-
World Health Organization (WHO) (1997) Guidelines for Drinking-Water Quality, Geneva, Switzerland.
-
Jalees MM, Hussain I, Arshad M, Muhammad G, Khan QM, et al. (2012) Occurrence of peste des petitis ruminants in five districts of Punjab, Pakistan. Pak Vet J 33(2): 165- 169.
-
Abolude DS, Opabunmi OO, Davies OA (2013) Fresh water fungi associated with Eggs and Broodstock of African Catfish (Clarias Gariepinus, Burchell 1822) in fish hatchery farms, Zaria, Kaduna State, Nigeria. J Res Environ Sci Toxicol 2(7): 131-135.
-
Shah JA, Pandit AK (2013) Relation between physico– chemical limnology and crustacean community in Wular Lake of Kashmir Himalaya. Pak J Biol Sci 16(19): 976- 983.
-
Doi SA, Pinto AB, Canali MC, Polezel DR, Chinellato RAM, et al. (2018) Density and diversity of filamentous fungi in the water and sediment of Araçá bay in São Sebastião, São Paulo, Brazil. Biota Neotropica 18(1): e20170416.
-
Pupin B, Nahas E (2014) Microbial populations and activities of mangrove, restinga and Atlantic forest soils from Cardoso Island, Brazil. Journal of applied microbiology 116 (4): 851-864.
-
Sharma MS, Raju NS (2013) Frequency and percentage occurrence of soil mycoflora in different crop fields at H D Kote of Mysore district. Inter J Environ Sci 3(5): 1569- 1576.
-
Raghukumar C (2008) Marine fungal biotechnology: an ecological perspective. Fungal Diversity 31: 19-35.
-
Wong MKM, Goh TK, Hodgkiss IJ, Hyde KD, Ranghoo VM, et al. (1998) Role of fungi in freshwater ecosystems. Biodiversity and Conservation 7: 1187-1206.
-
Venugopal P (2016) Effects of climate, wood quality and fungal diversity on coarse wood decomposition of Scots pine. School of Forest Sciences faculty of Sciences and Forestry of the University of Eastern Finland, pp: 35.
-
Kortei NK, Odamtten GT, Obodai M, Wiafe-Kwagyan M (2017) Mycofloral profile and the radiation sensitivity (D10 values) of solar dried and gamma irradiated Pleurotus ostreatus (Jacq. Ex. Fr.) Kummer fruitbodies stored in two different packaging materials. Food Science and Nutrition 6(1): 180-188.
-
Ibrahim WH, Nimir AHH, El-Sanousi SM, Shuaib YA (2016) Aerobic bacteria and fungi from skin lesions of fish in Khartoum state. J Adv Vet Anim Res 3(4): 375-385.
-
Abolude DS, Chia AM, Yahaya AS, Okafor DC (2012) Phytoplankton Diversity and Abundance as a function of Water Quality for Fish Production: a case study of two Man made Reservoir in Zaria, Nigeria. Tropical Fresh Water Biology 21(2): 41-58.
-
Kelly MG (1998) Use of the trophic diatom index to monitor eutrophication in rivers. Water Res 32(1): 236- 242.
-
Paterson R, Lima N (2005) Fungal contamination of drinking water. In: Lehr J, Keeley J, et al. (Eds.), Water Encyclopedia. 3rd (Edn.), JohnWiley & Sons, New York, USA, pp: 1-7.
-
De-Hoog GS, Guarru J, Gene J, Figueras MJ (2000) Atlas of Clinical Fungi. Central Bureau Voor Schimmel Cultures, Mycopathologia. Journal of Mycological Research 110: 1003-1010.
-
Otene BB, Alfred-Ockiya JF, Ejiko EO (2020) Bio-Indices of Bacteria Loads in Water and Mangrove Oyster (Crassostrea Gasar) of Woji/ Trans-Amadi Creek, Port Harcourt, Nigeria. International Journal of Research and Innovation in Applied Science (IJRIAS) 5(3): 104-110.
-
Chiu GS, Guttorp P, Westveld AH, Khan SA, Jun L (2011) Latent health factor index: a statistical 841 modeling approach for ecological health assessment. Environmetrics 22(3): 243-255.
-
Whittaker RH (1965) Dominance and Diversity in Land Plant Communities: Numerical relations of species express the importance of competition in community function and evolution. Science 147(3655): 250-260.
-
Wilhm JL, Dorris TC (1968) Biological parameters of water quality criteria. Bioscience 18(6): 477-481.
-
Davies OA, Otene BB (2009) Zooplankton Community of Minichinda Stream, Port Harcourt, Rivers State. European Journal of Scientific Research 26(4): 490-498
-
Antai EE, Joseph AP (2015) Planktonic Abundance and Diversity in Great KWA River, Cross River State, Nigeria. International Journal of Innovative Science Engineering & Technology 2(9): 141-154.
-
Adamu KM, Adebola MO, Iloba IK, Jonathan D, Abdullahi AS, et al. (2018) Are Fungi Isolated from Water and Fish Samples in Lapai-Agaie Dam, Nigeria Pathogenic to Human Health?. Production Agriculture and Technology, 14(2): 58-67.
-
Ewulonu CC, Obire O, Akani NP (2019) Microbiological and Physiochemical Quality of Freshwater in Isiokpo Community, Rivers State, Nigeria. South Asian Journal of Research in Microbiology 3(1): 1-8.
-
Singleton P, Sainsbury D (2001) Dictionary of Microbiology and molecular Biology. In: 3rd (Edn.), John Wiley & Sons, New York, USA, pp: 140-141.
-
Adamu KM, Mohammed YM, Ibrahim UF, Abdullahi IL, Jimoh YO (2022) Assessment of some physical, chemical and biological parameters of Lake Dangana, Nigeria. Zoologist (The) 20(1).
-
Ariyo AB, Obire O (2016) Microbial population and hydrocarbon utilizing microorganism from Abattoir soils in the Niger Delta. Current Studies in Comparative Education Science and Technology 3(1): 228-237.
-
Sokolo RS, Atagana H, Akani NP (2018) Molecular characterisation of culturable aerobic hydrocarbon utilizing bacteria and fungi in oil polluted soil at Ebubu- Ejama community, Eleme River State. Journal of Advances in Biology and Biotechnology 18(4): 1-7.
-
FAO (2011) Fisheries Department, Food and Agriculture Organization. World aquaculture 2010. FAO Fisheries and Aquaculture Technical Paper, Rome, Italy.
-
Otene BB, Alfre-Ockiya JF (2019) Assessment of water Quality Index (WQI) and Suitability for Consumption of Elele-Alimini Stream, Port Harcourt. Global Scientific Journal 7(2): 2320-2391.
-
Ravera O (2001) A comparison between diversity, similarity and biotic indices applied to the macroinvertebrate community of a small stream: The Ravella River (Como Province, Northern Italy). Aquatic Ecol 35: 97-107.
- Genetic Improvement of Nile Tilapia (Oreochromis niloticus): Advances in Selective Breeding and Genomic Approaches for Sustainable Aquaculture
- Microplastics, Contaminants, and Waste Hotspots: Divergences and Faults in Prioritizing Control Efforts
- Creating a Healthier, More Vibrant Open and Closed Aquatic Environment. A Submersible, Centrifugal Magnetically Affixed Current Changing Aquarium Pump
- An Attempt to Assess Alpha Diversity and Sample Size: Using the Ostracod Assemblages off Kumamoto Port, Japan
- Assessment of the Efficiency of Common Fishing Gears and Crafts Used at Mohananda River of Chapai Nawabganj, Bangladesh
- Fish Productivity and Biodiversity Status of Sundarban Mangrove in Bangladesh