Mapping of Urban Heat Island in West Semarang Subdistrict, Semarang City of Indonesia
One of the top ten hottest cities in Indonesia is Semarang City which is characterized by a high level of density. This research aims to classify urban heat conditions, particularly in West Semarang Sub-district, through Urban Heat Island mapping. The mapping and analysis stages include Top of Atmosphere (ToA), Brightness Temperature (BT), Normalized Difference Vegetation Index (NDVI), Proportional Vegetation Index (PVI), Error Correction (EC), and Land Surface Temperature (LST). The results of investigations based on maps produced from ArcGIS show that areas in West Semarang District can be classified into high, moderate and low temperature categories. Tambakharjo Village is the area with the highest temperature, whereas part of this area is found with low temperature, and moderate temperatures dominate almost all villages in West Semarang sub-district. The high heat that occurs in Tambakharjo is caused by fisheries production activities.
Introduction
The Urban Heat Island (UHI) is a natural phenomenon specifically related to climate which is characterized by increasing temperatures in dense urban centers [1, 2]. The city center area has a higher temperature compared to the surrounding buffer areas. The lessening in green regions due to arrive clearing in urban ranges causes the UHI impact. Concurring to the Environmental Protection Agency (EPA), this impact may be a major issue for each creating city within the world, particularly with respect to global warming. The phenomenon was to begin with explored and portrayed by Luke Howard within the 1810s [3]. The most cause of the UHI phenomenon in urban areas is the alteration of the land surface through urban advancement utilizing materials that store heat [4]. Warm that emerges as a result of vitality utilize is the moment biggest contributor to the UHI phenomenon.
Semarang City may well be a metropolitan city and the capital of Central Java Province, Indonesia (https:// semarangkota.go.id). Geographically, the city of Semarang
is found between 6°50›–7°10’ South Latitude and 109°35›– 110°50’ East Longitude, with boundaries to the north by the Java Sea, to the east by Demak Rule, to the west by Kendal Rule, and to the south with Semarang Regency [5]. Air temperature ranges between 20-30°C and the average temperature is 27°C. The city of Semarang proceeds to develop, apart from being a trading city, it is also a tourism destination. Hence, within the city of Semarang, hotels continue to grow from low class to star hotels. The progression into a tourism city will be reinforced by air transportation offices with Ahmad Yani Airplane terminal being updated to a worldwide airplane terminal, as well as arrive transportation within the shape of trains and buses with various routes [6]. In any case, on the other hand, this development has triggered an increase in density in the city of Semarang. A high level of urban thickness is specifically relative to an increment in urban temperature. This causes the city of Semarang to be included within the 10 most heat cities in Indonesia. High temperatures are an indicator of high levels of density, especially West Semarang Sub-district, which is included in the beat three most densely populated sub-districts in Semarang City and is a contributor to high temperatures in Semarang City.
This research aims to show the classification of UHI, particularly in West Semarang District. By classifying areas with high, medium or low temperatures, this could be a critical source of information in knowledge with respect to heat rise in the Semarang Metropolitan City. The comes about of this investigation will be exceptionally valuable for nearby governments in determining urban policies, mapping risks, and anticipating undesirable environmental events.
Methods
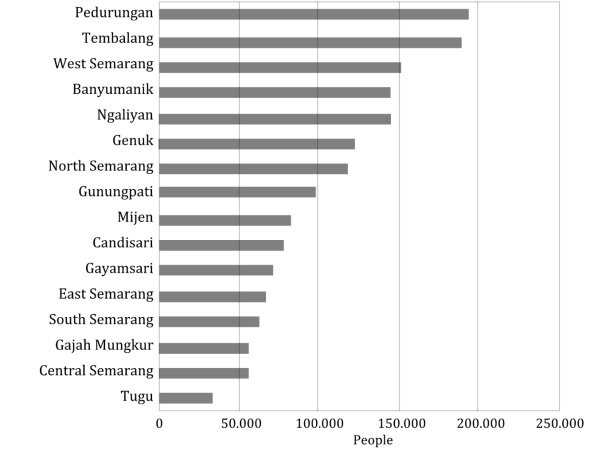
The 10 hottest city areas in Indonesia based on reports from the Meteorology, Climatology and Geophysics Agency (BMKG) as of early October 2023, namely from the hottest temperature to the lowest temperature in degrees Celsius, are Majalengka, West Java (37.4), Banjarbaru, South Kalimantan (37.3), Palembang, South Sumatra (37.2), Palu, Central Sulawesi (36.6), South Tangerang, Banten (36.4), Banjarbaru, South Kalimantan (36.4), Bandar Lampung, Lampung (36.2), Palembang, South Sumatra (36.2), Belitung, Kep. Bangka Belitung (35.8), Semarang City, Central Java (35.8). In the meantime, the total population of Semarang City agreeing to sub-district based on the 2023 Central Statistics Agency (BPS) report, it can be seen in Figure 1. The populace of West Semarang Sub-district is underneath the Pedurungan and Tembalang Sub-districts. This indicates that a dense populace does not continuously trigger an increment in heat, but the topographical area of the city and natural variables such as the effect of material reflection from buildings, asphalts and roads, counting human activities, can alter everything.
To investigate the phenomenon of rising heat in the city of Semarang particularly in West Semarang sub-district, this research was carried out by analyzing satellite data from Landsat 8 for the year of 2023. Landsat 8 is a medium resolution satellite imagery that was launched on 11 February 2013. This was with the aim of classifying areas that have experienced rising temperatures so that mitigation can be carried out. The stages in UHI mapping for Semarang City consist of several analyzes such as Top of Atmosphere (ToA), Brightness Temperature (BT), Normalized Difference Vegetation Index (NDVI), Proportional Vegetation Index (PVI), Error Correction (EC), and Land Surface Temperature (LST). These stages can be seen from the flowchart as shown in Figure 2. The onboard Operational Land Imager (OLI) and Thermal Independent Sensor (TRIS) sensors on the Landsat 8 satellite consists of 11 channels, of which 9 channels (bands 1-9) are on OLI and band 10 and band 11 on TRIS. The ESRI (Environmental Systems Research Institute) website states that there are 10 Landsat band combinations that can be created based on band characteristics for various analysis purposes [7]. In this UHI analysis there are three band combinations, namely band 10, band 4, and band 5. Note that Band 4 and Band 5 are visible Red (6360 – 6730 Å) and Near- Infrared (8510 – 8790 Å), respectively with a resolution of 30 m. While Band 10 is long wavelength infrared of TIRS-1 (10.60 -11.19 µm) with a resolution of 100 m.
![Figure 2: The onboard Operational Land Imager (OLI) and Thermal Independent Sensor (TRIS) sensors on the Landsat 8 satellite consists of 11 channels, of which 9 channels (bands 1-9) are on OLI and band 10 and band 11 on TRIS. The ESRI (Environmental Systems Research Institute) website states that there are 10 Landsat band combinations that can be created based on band characteristics for various analysis purposes [7]. In this UHI analysis there are three band combinations, namely band 10, band 4, and band 5. Note that Band 4 and Band 5 are visible Red (6360 – 6730 Å) and Near- Infrared (8510 – 8790 Å), respectively with a resolution of 30 m. While Band 10 is long wavelength infrared of TIRS-1 (10.60 -11.19 µm) with a resolution of 100 m.](/fulltextimages/12139/fig_2.png)
As can be seen from Figure 2, the sequence of UHI work steps is as follows: • ToA calculation from band 10, import band 10, set location, select raster calculator, enter ToA formula, and run.
• Calculation of brightness temperature (BT) from ToA, select the raster calculator, enter the BT formula, and run it.
• Normalize the difference vegetation index using a raster calculator, namely by importing band 4 and band 5 from the Landsat 8 image, then selecting raster calculator and typing in the NDVI estimation formula for band 4 and band 5.
• Calculate PVI from NDVI by selecting raster calculator, enter the PVI formula, and run it.
• EC calculation, select the raster calculator, enter the EC
formula, and run it.
• Land Surface Temperature (LST) calculation, select the raster calculator, enter the LST formula, and run it.
• Heat island process, stack profile, and graph of heat island; select the stack profile in geoprocessing, set the input paths to the urban heat path and to the LST target, specify the name and location of the output table, then run.
The formula for the various stages in Figure 2 can be formulated as follows [8]:
$$ T o A = 0. 0 0 0 3 4 2 * B a n d 1 0 + 0. 1 $$
$$ B T = \frac {1 3 2 1 . 0 7 8 9}{\ln \left(\left(7 7 4 . 8 8 5 3 / T o A\right) + 1\right)} - 2 3 7. 1 5 $$ ( ) ( ) ( ) ( ) $$ N D V I = \frac {f l o a t \left(B a n d 5 - B a n d 4\right)}{f l o a t \left(B a n d 5 + B a n d 4\right)} $$ ( ) min square NDVI NDVI PVI NDVI NDVI $$ = \frac {s q u a r e \left(N D V I - I\right)}{N D V I _ {\max } - N D} $$ max min $$ E C = 0. 0 0 4 * P V I + 0. 9 8 6 $$ BT LST NDVI BT EC $$ T ^ {\prime} = \frac {B T}{\left(1 + \frac {0 . 0 0 0 1 1 5 * B T}{\left(1 . 4 3 8 8\right) * \ln (E C)}\right)}. $$ ( ) ( ) 0.000115* 1 1.4388 ln
Results and Discussion
Figure 3 shows the map of West Semarang Subdistrict. Topographically, the West Semarang District area of Semarang City consists of coastal areas, swamps, and hills/ highlands. The coastal area is an area in the north that borders straightforwardly on the Java Sea and covers a small portion of the Semarang City area. This area encompasses a arrive slant of between 0% and 2% a and a height of below 1.0 m above sea level. Swamp areas are areas in the middle, such as intersections and city centers, with inclinations between 2 and 15% and heights between 0.75 and 3.5 m above sea level [9]. West Semarang is very important because it is designated as a residential area, offices, trade, air and sea transportation services. Ahmad Yani International Airport is located on Puad Ahmad Yani Street, Tambakharjo, West Semarang, Semarang City.
![Figure 3: Map of West Semarang Subdistrict [9].](/fulltextimages/12139/fig_3.png)
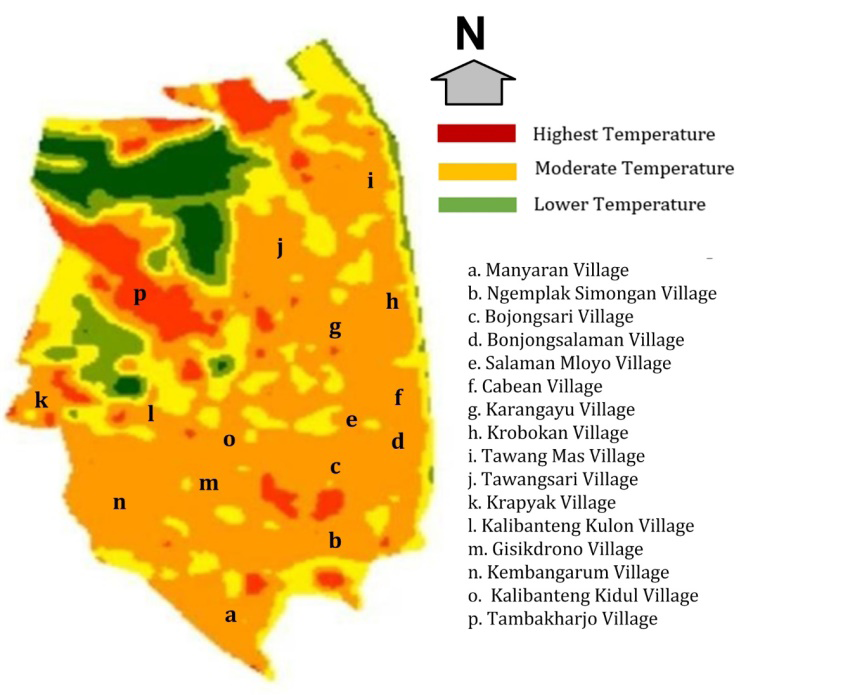
From the results of these stages, Figure 4 shows the obtained of UHI mapping for the West Semarang sub-district for 2023 Landsat data. The results shown are the classification of areas into high, moderate and low temperature categories. Based on the map obtained, Tambakharjo Village (p) and northern part of Tawangmas (j) is the area with the highest temperature, with the red color; low temperatures are also found in the northern part of Tambakharjo Village (p), with green color; and moderate temperatures dominate almost all sub-districts in West Semarang District, with orange color, where these include 13 sub-districts [10] or as indicated by the letters a, b, c, etc. on the map. In general, it can be said that West Semarang District is still beneath control from high surface temperature increases. In any case, on the off chance that this not maintained due to unplanned urban development and the risks of global climate change, then the potential phenomenon for UHI to increase in this area will be a challenge.
The outcomes of this research can become policy recommendations for the Semarang City government, particularly West Semarang District. Approach suggestions can incorporate things like handling areas with high temperatures so that they don’t affect other areas and anticipating areas with medium and low temperatures so that they don’t fall into the high temperature category. From the map it is found that Tambakharjo Village is coloured ruddy because it is housing development, service city due to the movement of vehicles from to the airport, and an industrial area in the northern, especially in the fisheries sector, which is close to the Java Sea [11]. In this way, regulatory industrial areas or air pollution can be a priority for the government in carrying out relief to areas with high temperatures. In another note for encourage further investigation, it is fundamental to analyze in detail the relationship between surface temperature and NDBI and NDVI. Typically to discover whether more heat emerges from human activity or whether heat is sent from other zones.
Conclusion
West Semarang is one of the most populous sub-districts in Semarang City. This level of density is one of the triggers for high temperatures in urban areas. This causes the phenomenon of increasing UHI in 2023. Based on mapping with various stages of analysis, such as ToA, BT, NDVI, PVI, EC, and LST, the results from UHI mapping in West Semarang sub-district we can classify areas with the highest, moderate and lowest temperatures. The highest temperature was found in Southern part of Tambakharjo Village, while parts of this area in the north also showed the lowest temperature. In the meantime, moderate temperatures were found to dominate almost all villages in West Semarang sub-district.
Further research can be extended by comparing the remaining nine hottest cities in Indonesia based on 2023 data. It ought to be famous that the cause of this increment in heat is due to climate change or other viewpoints in a city. This be an imperative issue formulating urban policies towards sustainable and productive cities.
Acknowledgement and Conflict of Interest
Wayan Suparta contributes major in idea, conceptualization, review and editing manuscript, correction, guidance, supervision, and facilitated the final version of the manuscript; Mardiana Niken writing original draft preparation, data processing, and method preparation. The research work was carried out by Wayan Suparta and Mardiana Niken without any budgetary bolster from any office or person and at long last the research work has no any conflict of interest.
References
-
Battista G, Evangelisti L, Guattari C, De Lieto Vollaro E, De Lieto Vollaro R, et al. (2020) Urban Heat Island Mitigation Strategies: Experimental and Numerical Analysis of a University Campus in Rome (Italy). Sustainability 12(19): 7971.
-
Cecilia A, Casasanta G, Petenko I, Conidi A, Argentin S (2023) Measuring the urban heat island of Rome through a dense weather station network and remote sensing imperviousness data. Urban Climate 47: 101355.
-
Howard L (2007) The Climate of London. IAUC edition.
-
Liang S, Li X, Wang J (2012) Chapter 24-Land Cover and Land use Changes. Advanced Remote Sensing, Academic Press, pp: 703-772.
-
Pramudibyanto H (2023) Content Preservation Analysis of Semarang City Tourism Website. Daluang: Journal of Library and Information Science 3(1): 47-56.
-
Susiatiningsih H, Farabi N, Paramasaty S (2019) Development Strategy to Improve The Quality of Tourism in Kota Lama Semarang, Central Java. Advances in Social Science, Education and Humanities Research 366: 218- 220.
-
Hamzahplpul (2020) Tutorial ArcGIS Pembuatan Peta Tutupan Lahan dengan Data Landsat. Community ESRI.
-
Oppong J (2021) How to Use ArcGIS Pro to Map Urban Heat. Geography Realm.
-
OPD Kecamatan Semarang Barat (2018) Changes To The Strategic Plan of West Semarang District Semarang City 2016-2021. Pemerintah Kota Semarang Kecamatan Semarang Barat Tahun 2018 Arsip.
-
Badan Penanggulangan Bencana Daerah (2011) Disaster Prone Map (Peta Rawan Bencana 2011).
-
Prasasti LD, Sulardiono B, Jati OE (2022) Suitability Analysis of Fish Pond Based on Physicochemical Parameters in Tambakharjo, Semarang City. Jurnal Pasir Laut 6(1): 60-66.
- Genetic Improvement of Nile Tilapia (Oreochromis niloticus): Advances in Selective Breeding and Genomic Approaches for Sustainable Aquaculture
- Microplastics, Contaminants, and Waste Hotspots: Divergences and Faults in Prioritizing Control Efforts
- Creating a Healthier, More Vibrant Open and Closed Aquatic Environment. A Submersible, Centrifugal Magnetically Affixed Current Changing Aquarium Pump
- An Attempt to Assess Alpha Diversity and Sample Size: Using the Ostracod Assemblages off Kumamoto Port, Japan
- Assessment of the Efficiency of Common Fishing Gears and Crafts Used at Mohananda River of Chapai Nawabganj, Bangladesh
- Fish Productivity and Biodiversity Status of Sundarban Mangrove in Bangladesh