Carbonate System Seasonal Behavior along a Southeastern Brazilian Estuarine-Lagoon Complex with Different Degrees of Anthropogenic Impacts on its Sectors
This study aimed to understand the behavior of the carbonate system in the Cananéia-Iguape Estuarine-Lagoon Complex (CIELC) to evaluate its potential as a source or sink for atmospheric CO2. This estuarine-lagoon complex is one of the most extensive in Brazil, more than 100 km long and covers protected and sparsely inhabited regions of the state of São Paulo. This system presents, in its southern portion, most preserved areas, and evident anthropogenic impact in the northern portion, where an artificial canal was created in the second half of the 19th century, with the aim of shortening the navigation path link the river to the estuarine system offering a passage to the sea, resulting in several modifications, both from a hydrodynamic and biogeochemical mechanisms. Sampling of salinity (S), temperature (T), total alkalinity (TA), pH, dissolved oxygen (DO), and nutrients (P and Si) were performed along the CIELC in the winter of 2012 and in the summer of 2013. S, TA, pH and nutrients were used to support the understanding the behavior of the species in the carbonate system (CO2, HCO3 -, CO3 2-) and related variables were used to calculating the partial pressure of CO2 (pCO2). The data showed the difference in salinity and carbonate members distinguished the northern and southern areas, the influence of the marine waters entrance by the bars, and the predominance of the system as a source of CO2, even in the most preserved area. However, the difference in this behavior is most evident under anthropogenic pression offering risk of extreme changes in direction to the southern sector, now observed until the intermediate point of the system. The recommendation is an urgency in monitoring this region to minimizes futures environmental changes, as acidification and the increase as a source of CO2.
Introduction
The oceans are major sinks of anthropogenic carbon. Since the Industrial Revolution, the oceans have already absorbed 48% of total fossil fuel emissions [1]. The potential to removal global atmospheric CO2 by the oceans in the year 2000 was estimated at 1.25 GtC/year [2, 3, 4]. And some authors indicated an important remotion way by “ocean alkalinity enhancement “ via spreading Ca (OH)2 or NaOH in seawater for mitigating ocean acidification [5, 6, 7, 8, 9] and enhancing the net calcification of reef as discussed by Albright R, et al. [10]. Therefore, the ocean is an important protagonist in the sequestration of atmospheric CO2 using several ways (carbonate-bicarbonate-carbon system, precipitation with Ca and Mg and incorporation into organic matter through primary production) naturally and exist stimulation for experimental proposals [10]. This article first describes the distribution of pH and TA and their seasonal variability in the Cananéia-Iguape Estuarine-Lagoon Complex (CIELC) and then evaluates the species of the carbonate system with the aim of describing the metabolism of the aquatic system from the point of view of CO2 absorption/elimination to improve the knowledge about the natural and anthropogenic influence on potential for CO2 sequestration of estuarine systems in two seasonal periods. The regional carbon studies need more attention in the coastal system due to the spatiotemporal variability in the biogeochemical processes at these regions [11, 12]. Considering the gas solubility law in water, carbon dioxide, once in the sea, reacts with water and forms carbonic acid, which, being a weak acid, dissociates twice, forming the bicarbonate ion and the carbonate ion:
2 2 2 2 3 3 3 CO H O H CO H HCO H CO + − + − + ↔ + + → → (eqn. 1)
At the pH of seawater, which is around 8, the most available form in this balance is bicarbonate (HCO3 -).
Members’ knowledge of these basic reactions allows them to calculate both the concentration of CO2 in the oceans and the effect of adding carbon to the sea, in terms of changes in TA, total carbon (which is the sum of inorganic carbon present in the ocean), pH and CO2 partial pressure, as done by Takahashi T, et al. [13].
Some signs may indicate the pathways for greater or lesser carbon retention in the aquatic system. Abiotic characteristics such as salinity, temperature, dissolved oxygen and nutrients when associated with data from the carbonate system can be excellent indicators of processes that may be occurring with solubilized CO2, such as acidification, primary production and remineralization of organic matter. When it comes to marine primary production, CO2 and, mainly, the inorganic forms derived from its dissolution, mainly bicarbonate (HCO3 -), participate in biological processes via photosynthesis, showing that areas suitable for the proliferation of marine autotrophic life (where there is essential nutrient and light conditions) can be considered potential sinks for this greenhouse gas. An important way to characterize the pathway taken by carbon in marine systems is total alkalinity (TA).
By definition, this indicates the total amount of anions in the carbonate system that react to neutralize hydrogen ions. Therefore, it is a measure of the buffering capacity of water, that is, its ability to resist changes in pH. As the distribution of the main carbon species that contribute to total alkalinity varies according to the pH of the water, in the case of seawater, the main contributor to TA is the bicarbonate ion.
Identifying the factors that control surface AT is becoming increasingly important for understanding the effects of ocean acidification resulting from the addition of anthropogenic carbon dioxide to surface waters. The flow of carbon to the oceans, without biological bias, occurs when atmospheric pCO2 prevails over pCO2 in the water. According to Kheshgi HS [14], for seawater in a state of equilibrium with the atmosphere, the increase in the introduction of CO2 since the pre-industrial era (in terms of partial pressure, from 285 to 350 μatm), (and recently ~400 ) would have caused the pH of seawater decreased by 0.079bit. Therefore, concern about the fate of anthropogenic CO2 in the atmosphere-ocean interface is warranted by scientists, who have been examining the distributions of dissolved inorganic carbon (DIC) and total alkalinity (TA) in the oceans, as well as, the processes that increase TA on the surface and facilitate the sequestration of anthropogenic CO2 from the atmosphere.
High TA values are associated with organic matter decomposition processes and the high respiratory rate of microorganisms, which release CO2 dissolved in seawater and, consequently, alter the chemical balance of the carbonate system. Thus, the synthesis and decomposition of organic matter also plays an important role in the TA balance. Phytoplankton blooms that occur during seasonal increases in temperature are key factors that can lead to measurable decreases in TA, also in tropical areas [15, 16]
The dissolution of marine carbonates, including magnesium calcites (from coralline algae), aragonite (from corals and pteropods) and calcite (from coccolithophorids and foraminifera), for example, neutralizes anthropogenic CO2 and also contributes to TA via the reaction [17]:
2 2 3 2 3 2 CO CaCO H O HCO Ca − + + + ↔ + (eqn.2) Therefore, changes in alkalinity cause changes in the partial pressure of carbon dioxide. When carbon dioxide stored in the oceans comes into contact with the atmosphere again, the partial pressure of carbon dioxide altered via alkalinity has implications for the long-term sequestration of this carbon (so that there is a decrease in the partial pressure of CO2 in the water, allowing a flow of carbon from the atmosphere to the ocean, increasing the ability of water to sequester CO2, there must be an increase in alkalinity). As the carbon sequestered via changes in alkalinity remains in the form of inorganic carbon and its cycling takes place over hundreds of years, this is considered a form of permanent storage.
Therefore, the oceans represent an important sink for CO2 released by the burning of fossil fuels and the uptake of this gas by the oceans causes impacts on alkalinity. There are several strategies for sequestering CO2 by the oceans, for example, changes in alkalinity and nutrient availability. These changes are always related to changes in the partial pressure of CO2, with the aim of causing this gas to flow from the atmosphere to the ocean.
Considering that even pristine areas can suffer differences between the sectors of their system due not only to anthropogenic interference, but also due to the system’s metabolism associated with different environmental factors and also seasonal and annual variation that, this study aimed to understand the behavior of the carbonate system in the Cananéia-Iguape Estuarine-Lagoon Complex (CIELC) to evaluate its potential as a sink for atmospheric CO2.
Material and Methods
Study Area
The region of the Cananéia-Iguape Estuarine-Lagunar Complex (CIELC) is located between the mouth of the Ribeira de Iguape river in the northern and the frontier of the states of São Paulo and Paraná, between latitudes 24° 40′ S and 25° 05’ S, longitudes 47° 25’ W and 48° 10’W and consists of the main estuarine-lagoon complex on the coast of São Paulo, a part of the Ramsar site [18, 19] which, added to the lower valley of the Ribeira de Iguape River, forms the largest plain coast of the state of São Paulo, the Cananéia-Iguape Coastal Plain, covering an area of around 2500 km2 [20]. The geographical configuration of the region is represented by four islands (Cardoso, Cananéia, Comprida and Iguape) separated from each other by systems of lagoon channels and rivers (Canal de Ararapira, Baía de Trapandé, Mar de Cubatão, Mar de Cananéia and Mar Pequeno, Valo Grande and Rio Ribeira de Iguape) which communicate with the ocean through outlets named, from southern to northern regions, Ararapira, Cananéia, Icapara and Ribeira. The lagoon system is separated from the ocean by a quaternary barrier island, Ilha Comprida, it has approximately 70 km long and limited in the southern by Cardoso Island and the northern by Iguape Island. Ilha Comprida, in turn, is separated from the mainland by a lagoon named Mar Pequeno, which towards the southern is subdivided to form the Cubatão and Cananéia seas, separated by Cananéia Island [21]. These two seas communicate with each other in Trapandé Bay.
Precipitation Data
Precipitation time series for the two sample collection campaigns were obtained through the online platform of the National Institute of Meteorology (INMET) [22], which can be accessed at http://www.inmet.gov.br/portal/index. php?r=home/page&page=rede_estacoes_auto_graf, in order to highlight possible variations in nutrient concentrations associated with river input.
Water Temperature, Salinity, Dissolved Oxygen and pH.
Water temperature (T) was determined with protected reversing thermometers, with an accuracy of ± 0.01 °C. Salinity (S) samples were collected using van Dorn sampler in 250mL amber bottles and then processed by inductive method, using a salinometer model Beckman® RS-10, according to the method described by Grasshoff K, et al. [23]. For dissolved oxygen (DO) samples, calibrated bottles with diving caps were used, which were filled with water from the Go-Flo Hydrobios® bottle using a flow reducer to avoid the formation of bubbles. The oxygen samples were the first to be collected, the addition of reagents was done on board (fixation) and the analyzes took up to 8 hours following the method of Winkler (1888) as described by Grasshoff K, et al. [23]. The method has an accuracy of ±0.04 mL/L, for levels greater than 2.00 mL/L, and ±0.02 mL/L for levels lower than 2.00 mL/L. The pH samples were collected in wide-mouth bottles, with a ground lid, immediately after oxygen collection. The flow reducer was used to prevent the formation of bubbles. The pH was measured with the aid of a portable pH meter PHM 203 – RADIOMETER®, using a combined glass electrode, following the recommendations presented by Aminot A, et al. [24].
Total Alkalinity, Carbonate System, ∑CO2 and pCO2
To determine Total Alkalinity (TA), water samples were collected on board from Go-FloHydrobios® bottles in Erlenmeyer flasks with a nominal volume of 300 mL with a ground lid immediately after pH collection. A flow reducer was used to avoid the formation of bubbles and the bottle was filled entirely.
The samples were kept away from light and heat sources and analyzed within 8 hours using the potentiometric titration method, a methodology that has been adapted since 1965 to on-board analysis conditions as described in Grasshoff K, et al. [23]. In titrating the samples, the Methrom® Dosimat 700 doser and a Methrom® bench pH meter, model 827, were used, from which it was possible to extract pH, potential and temperature measurements, with precision of 0.001, 0.1mV and 0. 1st respectively. The accuracy of the method for TA is ±0.08%. Through this analysis, in addition to alkalinity, it is also possible to make estimates, with mathematical manipulation of theoretical chemistry, about total inorganic carbon (∑CO2), partial pressure of CO2 (pCO2), among other parameters of the Carbonate System. For this purpose, the CO2calc software developed by the “U.S. Geological Survey Florida Shelf Ecosystems Response to Climate Change [25] more information at http://pubs.usgs.gov/of/2010/1280/
Nutrients (P and Si)
Samples of dissolved phosphate and dissolved nitrogenous compounds (i.e. nitrite, nitrate and ammonium-N) were collected in a Van Dorn sampler and filtered through Whatman GF/F filters. The filtered water was kept frozen (-20°C) until analysis. The determination of dissolved phosphate was carried out following the colorimetric method described in Grasshoff K, et al. [23] using a Genesis II Bauch & Lomb® digital spectrophotometer and the analysis of dissolved nitrogen compounds was carried out on the Bran-Luebbe® AutoAnalyzer II following recommendations described in Grasshoff K, et al. [23], the precision of the methods is ± 0.02 µM and ± 0.2 µM respectively.
Data Treatment
Descriptive statistics as the calculation of mean, median, standard deviation, maximum and minimum, and also in relation to Paerson’s linear correlation coefficient (R), using Microsoft Office Excel®2010 software was performed. Scatter Diagrams, TA data were associated with estimates obtained via CO2calc Software (i.e., [HCO3 - ], [CO3 2-], [CO2] aq, ∑CO2, pCO2, among others) and pH data, nutrients, salinity, temperature, dissolved oxygen. Horizontal profiles of isolines using Surfer® 10.1.561 Software in the “Inverse Distance to a Power” interpolation mode was applied to obtain an overview of the spatial variability on the surface.
Results and Discussion
Due to the large extension of the CIELC (Figure 1) the sampling was sectorized taking into account the important differentiation of environments and hydrobiogeochemical forces. Thus, the study sectors were divided into southern stations (Cananéia and Ararapira regions) and northern stations (Iguape and the Valo Grande Canal regions) (Table 1). Two sampling campaigns were performed, one in winter (August, 2012) and another in summer (February, 2013).
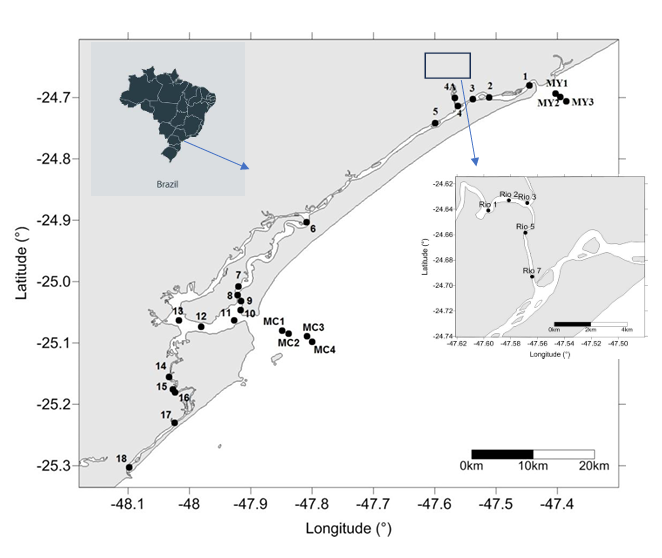
Water samples were collected using Go-Flo bottles from Hydrobios ® and van Dorn. The sampling periods considered the same tidal regime (syzygy). There were some stations in the estuarine-lagoon waters and others in the Ribeira de Iguape river. This study made a part of a FEBIOGEOQUIM Project with an assemblage of 18 stations and the stations used in this work (Tables 1 & 2) rivers stations (Rio 3 and Rio 5) and exceptionally, 3 station out of the Ycapara bar (MY1- MY3) and 4 stations out of the Cananéia bar (MC1, 2, 3 and 5) in the summer period.
| Regions | Sub-regions | Stations |
|---|---|---|
| Northern | Valo Grande | RIO 3 |
| RIO 5 | ||
| 4A | ||
| Iguape | 3 | |
| 4 | ||
| 5 | ||
| Southern | Intermediate | 6 |
| Cananéia | 7 | |
| 8 | ||
| 9 | ||
| Ararapira | 14 | |
| 16 | ||
| 18 |
Table 1: Sectors with the stations located in each sectors in internal part of CIELC.
In the winter campaign, in general, temperature varied from 20.25 and 22.18 °C, salinity values varied from 0.03 to 32.41 and pH showed values from 6.23 to 8.61. Nutrients presented concentrations from 0.23 to 12.08 µmol/KgSW for phosphate and silicate from 7.96 and 261.44 µmol/kgSW. These values are similar to the data reports some years after showing the Ribeira river influence in the northern part of the system and low temperatures <23°C in the winter period associated to low values of pH and high nutrient concentrations distinguishing the northern and southern sectors with range limits presented in Table 2 [26, 27].
| Sub-regions | Stations | T (°C) | S | DO (mL/L) | Total P (µmol/kgSW) | Total Si (µmol/kgSW) |
|---|---|---|---|---|---|---|
| Valo-Grande | RIO 3 | 21.3 | 0.49 | 5.72 | 12.08 | 240.49 |
| RIO 5 | ||||||
| 4A | 21.1 | 0.03 | 5.52 | 6.13 | 220.21 | |
| Iguape | 3 | 22 | 0.16 | 5.09 | 9.01 | 261.44 |
| 4 | ||||||
| 5 | 20.75 | 0.03 | 2.03 | 7.69 | 228.18 | |
| Intermediate | 6 | 21.7 | 13.2 | 4.19 | 3.11 | 54.54 |
| Cananéia | 7 | 22.18 | 27.4 | 5.62 | 2.03 | 20.23 |
| 8 | ||||||
| 9 | 21.2 | 20.2 | 4.7 | 1.31 | 13.52 | |
| Ararapira | 21.1 | 32.4 | 5.36 | 0.48 | 16.88 | |
| 14 | ||||||
| 16 | 20.3 | 28.9 | 4.09 | 0.23 | 7.96 | |
| 18 |
Table 2: Hydrological and biogeochemical parameters (T, S, DO, P and Si). Range in different sectors of the system obtained in th
It is clearly noted that the hydrochemical data represent an increasing variance that must be reflected similarly in the carbonate system, due to the fact that the sampling followed very different parts of this environment. Salinity was an important factor to distinguish the sectors as low saline waters from river influence were sampled and brackish and marine waters in regions with greater water exchange between the sea and the estuary (Table 3). The importance of salinity variation in estuarine system associated to the nutrients and others hydrological modifications were reported by Carstensen J, et al. [28] in three Danish coastal systems with reflection in the carbonate system.
| Sub-regions | St. | TA (micromol/ kgSW) | TCO 2 (micromol/ kgSW) | pH | fCO 2 (microatm) | pCO 2 (microatm) | HCO 3 (micromol/ kgSW) | CO 3 (micromol/ kgSW) | CO 2 (micromol/ kgSW) |
|---|---|---|---|---|---|---|---|---|---|
| Valo-Grande | RIO 3 | 1,057.55 | 1,262.00 | 7.09 | 5,573 | 5,591.69 | 1,049.07 | 3.35 | 210.8 |
| RIO 5 | |||||||||
| 4A | 898.56 | 9,94.27 | 6.84 | 2,656 | 2,665.61 | 890.14 | 2.03 | 100.2 | |
| Iguape | 3 | 1,312.45 | 1,707.00 | 7.11 | 20,146 | 2,021.,84 | 1,297.67 | 4.87 | 771.96 |
| 4 | |||||||||
| 5 | 935.81 | 1,170.93 | 6.23 | 3,013 | 3,023.08 | 934.56 | 0.47 | 111.14 | |
| Intermediate | 6 | 2,023.65 | 1,920.04 | 8 | 523 | 525.7 | 1,808.35 | 93.47 | 18.21 |
| Cananéia | 7 | 2,770.46 | 2,385.52 | 8.36 | 487 | 489,60 | 2,097.88 | 346.58 | 16.25 |
| 8 | |||||||||
| 9 | 2,217.59 | 2,001.25 | 8.04 | 217 | 218.4 | 1,820.15 | 144.78 | 7.1 | |
| Ararapira | 14 | 2,823.21 | 2,475.68 | 8.61 | 432 | 434.02 | 2,233.82 | 2,233.82 | 14.26 |
| 16 | |||||||||
| 18 | 2,707.00 | 2,072.65 | 8.1 | 88 | 88.78 | 1,524.19 | 1,524.19 | 2.88 |
Table 3: Values of pH and carbonate system (TA, TCO2, fCO2, pCO2, HCO3 -,CO3 -- and CO2) in the different sectors of the system i
These large variation is in agreement to a large environmental variations as salinity, pH and nutrients from terrestrial source as phosphate and silicate showing the river influence in this estuarine system, evidenced in the northern sector with a minor seawater influence as showed by Bastos ATCC, et al. [26] for this region. The highest values of pCO2, fCO2 and pH <8 for example, and lowest values of TA and TCO2 from the river water at Valo Grande and Iguape until the intermediate station (st.6) showed the highest potential as a source of CO2 to the atmosphere of this area in relation to the southern sectors submitted to a most important change with the seawater, as observed by Chen CTA, et al. [29]. In this case, it is possible to consider that the winter period, with lowest temperatures and wind effects surely acts most effectively in the atmosphere-water change. In general, in winter sampling, the TA varied from 898.56 to 2,823.21_/kg_SW) with a median of 2,279.82; TCO2 varied from 994.27 to 2,475.69_/kg_SW) (median 2,036.95_/ _kgSW)); _f_CO2 varied from 88.49 to 20,146.91(µatm); pCO2 varied from 88.79 to 2,0214.84 (µatm) (median 484.27); HCO3 varied from 890.14 to 2,233.83 (µmol/kgSW) (median
1797.34), CO3 varied from 0.48 to 545.58 (µmol/kgSW) (median 151.45) and CO2 varied from 2.89 to 771.96 (µmol/ kgSW)( median 16.15).
In summer, values of temperature varied 25.10 and 33.47 °C indicating a warmer period, salinity varied from 0.02 to 35.17; pH varied between 7.02 and 8.12 confirming the greater presence of saline water in function of the data os marine water near the bars. Nutrients showed concentrations between 0.22 and 6.47 µmol/kgSW reflecting the assimilation by phytoplankton most intense in this period; silicate varied from 3.90 to 227.73 µmol/kgSW showing the drainage effect in this rainy period [26]. The high variance continuous in this season and the lowest salinity rest in the northern sector increasing toward the southern and out of the bars, in the seawater (reaching salinity >30). The hydrological and nutrients values by sectors are presented in Table 4 continuing to show variation in phosphate and highest silicate values, both decreasing in a salinity enhance as observed by Bastos ATCC, et al. [26], Sutti BO, et al. [27].
| Sub regions | Sts. | T (°C) | S | DO (mL/L) | Total P (µmol/kgSW) | Total Si (µmol/kgSW) |
|---|---|---|---|---|---|---|
| Valo-Grande | RIO 3 | 27.4 | 0.03 | 4.19 | 6.45 | 250.96 |
| RIO 5 | ||||||
| 4A | 27.08 | 0.02 | 4.06 | 5.15 | 193.3 | |
| Barra de Iguape | MY1 | 30.25 | 35.2 | 5.14 | 0.85 | 101.44 |
| MY2 | ||||||
| MY3 | 25.6 | 21.5 | 3.11 | 0.34 | 8.99 | |
| Iguape | 3 | 27.77 | 0.13 | 4.14 | 5.13 | 211.16 |
| 4 | ||||||
| 5 | 27.1 | 0.02 | 3.7 | 3.17 | 177.68 | |
| Intermediate | 6 | 27.87 | 4.26 | 4.19 | 3.63 | 15 |
| 27.5 | 3.94 | 3.7 | 3.44 | 14.73 | ||
| Cananéia | 7 | 31.52 | 28.6 | 4.9 | 0.88 | 39.13 |
| 8 | ||||||
| 9 | 28.35 | 22.7 | 3.41 | 0.5 | 11.78 | |
| Barra de Cananéia | MC1 | |||||
| MC2 | 33.47 | 34.6 | 4.84 | 0.58 | 14.9 | |
| MC3 | 25.4 | 27.5 | 3.28 | 0.22 | 5 | |
| MC5 | ||||||
| Ararapira | 14 | 26.7 | 31.5 | 4.84 | 3.04 | 40 |
| 16 | ||||||
| 18 | 25.1 | 13.9 | 3.31 | 0.41 | 5.8 |
Table 4: Water biogeochemical parameters (T, S, DO, P, Si). Range in different sectors of the system obtained in the summer sampl
Carbonate system Table 5 presented also a large variation of the parameters in this seasonal period considering the environmental sectors sampled. The pH values reaching lowest values in the southern sector in relation to the winter. Observing the pCO2, fCO2 and pH <8 for example, and lowest values of TA and TCO2 from the river water at Valo Grande and Iguape until the intermediate station (st.6) it was not so extreme as showed in winter, but also showing as a source of CO2 to the atmosphere most intense in this area in relation to the southern sectors due to the change with the seawater is most evident. In this case, the seawater (stations M), received an influence of the estuarine water associated to the marine hydrodynamic that contributed to the low values of pCO2 and, fCO2 most similar to the southern region of this system. High TA and TCO2 in these areas correspond to the confluence behavior [27].
A general data for the summer sampling followed the ranges: TA varied from 61.09 and 2935.18 µmol/kgSW; TCO2 (µmol/kgSW) varied from 63.10 to 2,701.49 (µmol/ kgSW)with a median of 1,406.45); fCO2 (µatm) varied from 142.41 to 3,135.44 (µatm) (median 305.22); pCO2 varied from 142.85 to 3,145.2 (µatm) ( median 306.17 ); HCO3 - from 57.43 to 2,481.24 (µmol/kgSW) (median 1,242.82), CO3 2- varied from 0.29 to 289.51 (µmol/kgSW) (median 148.87) and CO2 varied from 4.28 to 101.09 (µmol/kgSW) (median 8.72), reflecting buffering capacity, lightly minor than the observed in the before period due to the presence of mainly brackish water in this sampling, except in the stations out of the bar, in the salt water (M).
| Sub-regions | Sts | TA (µmol/ kgSW) | TCO (µmol/ 2 kgSW) | pH | fCO 2 (µatm) | pCO 2 (µatm) | HCO (µmol/ 3 kgSW) | CO (µmol/ 3 kgSW) | CO (µmol/ 2 kgSW) |
|---|---|---|---|---|---|---|---|---|---|
| Valo-Grande | RIO 3 | 875.21 | 1,021.55 | 7.38 | 4,612.76 | 4,627.15 | 870.46 | 2.37 | 148.72 |
| RIO 5 | |||||||||
| 4A | 61.09 | 69.15 | 7.02 | 258.54 | 259.35 | 60.63 | 0.2 | 8.31 | |
| Iguape Bar | MY1 | 2,054.32 | 1,921.75 | 8.09 | 802.26 | 804.78 | 1,793.59 | 140.75 | 22.38 |
| MY2 | 1,506.24 | 1,358.08 | 7.89 | 360.9 | 362.01 | 1,247.30 | 92.19 | 9.43 | |
| MY3 | |||||||||
| Iguape | 3 | 467.47 | 519.85 | 7.79 | 1,716.62 | 1,721.94 | 463.63 | 4.43 | 54.34 |
| 4 | |||||||||
| 5 | 164.35 | 177.89 | 7.17 | 255.99 | 256.79 | 162.49 | 0.79 | 8.24 | |
| Intermediate | 6 | 495.26 | 524.44 | 7.45 | 1,095.32 | 1,098.71 | 487.01 | 3.5 | 33.92 |
| 136.28 | 141 | 7.36 | 241.01 | 241.76 | 132.32 | 1.16 | 7.52 | ||
| Cananéia | 7 | 2,935.18 | 2,784.55 | 8.1 | 1,173.39 | 1,176.99 | 2,607.98 | 145.38 | 32.3 |
| 8 | |||||||||
| 9 | 1,439.04 | 1,287.80 | 7.74 | 367.13 | 368.23 | 1,168.96 | 44.94 | 9.47 | |
| Cananéia Bar | MC1 | 2,755.68 | 2,473.79 | 8.12 | 670.45 | 672.53 | 2,236.44 | 219.46 | 17.87 |
| MC2 | |||||||||
| MC3 | |||||||||
| MC5 | 1,661.95 | 1,472.19 | 8 | 379.97 | 381.13 | 1,336.62 | 111.67 | 9.94 | |
| Ararapira | 14 | 1,925.87 | 1,717.99 | 8.1 | 991.22 | 994.39 | 1,563.14 | 145.91 | 31.29 |
| 16 | |||||||||
| 18 | 192.38 | 187.04 | 7.43 | 215.19 | 215.86 | 177.71 | 2.86 | 6.47 |
Table 5: Values of pH and carbonate system (TA, TCO2, fCO2, pCO2, HCO3 -,CO3 -- and CO2) in the different sectors of the system i
Observing a Pearson treatment (p<0.001) it is clear, in the winter campaign, that there are more significant positive correlations between TA and S (r=0.98) and pH (r=0.95), and negative correlation between Total P (r=-0.95) and Total Si (r=-0.97). In the summer, which present most significant relation between TA and TCO2 (r=0.99) and HCO3 -(r=0.99) and negative correlation not so strong with Total P (r=-0.77) and Si (r= -0.73).
It can be seen, in the summer campaign, that there are the same positive correlations and the same negative correlations as in the winter, however it is noted that the r values tended to decrease in the summer compared to the values in the winter, with the exception of the correlations TCO2 and HCO3 -, which in summer demonstrated higher r values. The link with the biological process as production and organic matter decomposition play a role in this values besides the temperature and the wind forcing as discussed by Lefèvre N, et al. [30]. The primary production increasing with the availability of nutrients at the winter time, encouraging the assimilation decreasing them consuming CO2 but in the other points of the water column the inverse process, as decomposition eliminate CO2 and there are different processes acting in the system as discussed by Cai WJ, et al. [31, 32], Hagens M, et al. [33].
Observing a seasonal change, it is possible to verify a median difference of 0.05 in pH, naturally pH changes are so complex due to the nutrient, total alkalinity (TA) and organic matter inputs from land, productivity, and respiration, mainly in a system with an important salinity gradient with a median 20.27 in a winter 2012 and 28.53 in summer 2013. Melzner F, et al. [34] communicate seasonal changes in pH around 0.6 pH unit for a coastal bay in the western Baltic Sea, enormous when considered the median values obtained here, but not so effective when we observe the minimum and maximum values along the salinity gradient in a estuarine waters. Saderne V, et al. [35] reported diel pH variations in a range of 0.3–0.4 pH nearshore macrophyte bank in Baltic Sea.
In relation to nutrients with terrestrial source (P and Si), P is regenerate in winter time and present the highest values in winter with a median value of 1.22 (µmol/kgSW) in relation to 0.56 (µmol/kgSW) in summer when the primary production consume it [26, 27]. Silicate also present the same behaviour, but the river influence associated to sediment resuspension diminished the difference of the seasonal median showing highest values in both periods 20.23 and 15.57 (µmol/kgSW) in winter and summer periods respectively.
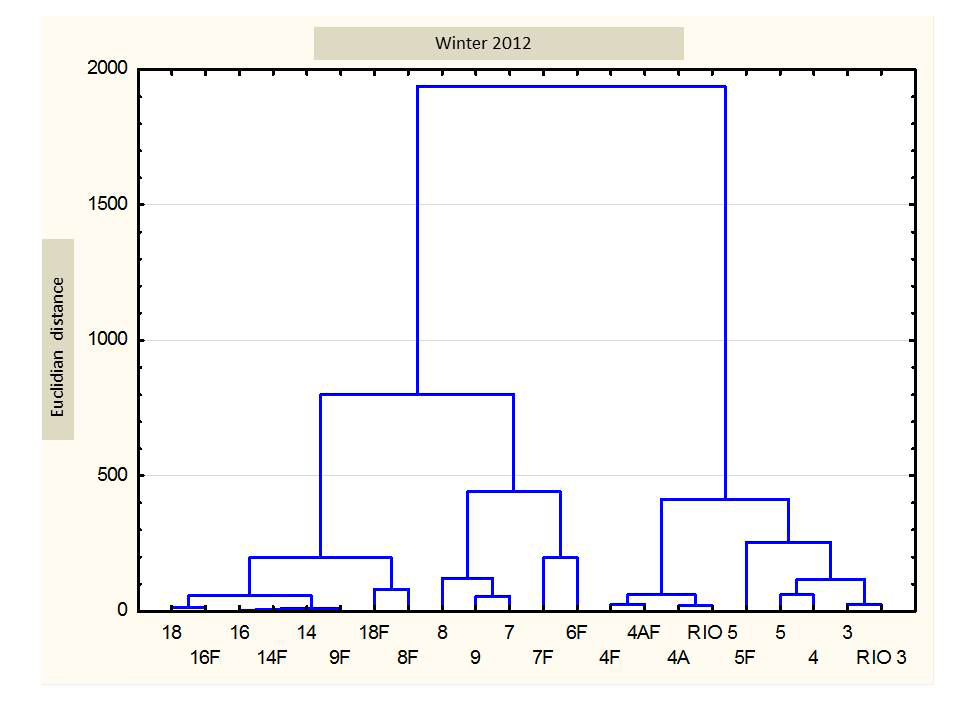
When it comes to similarities between the stations sampled considering the analyzed parameters in the winter campaign, it can be seen from the dendrogram Figure 2, that there are two main groups, one of the main that groups the stations closest to the region where freshwater enters the system (which is subdivided into two subgroups), one that groups the stations closest to the mouth of the Valo Grande channel and another that group together the stations closest to the Ribeira de Iguape River. The another main group put together the stations furthest from the entry of freshwater into the system, being subdivided into two subgroups, one characterized by the stations closest to Cananéia and the other by the stations closest to the Ararapira channel.
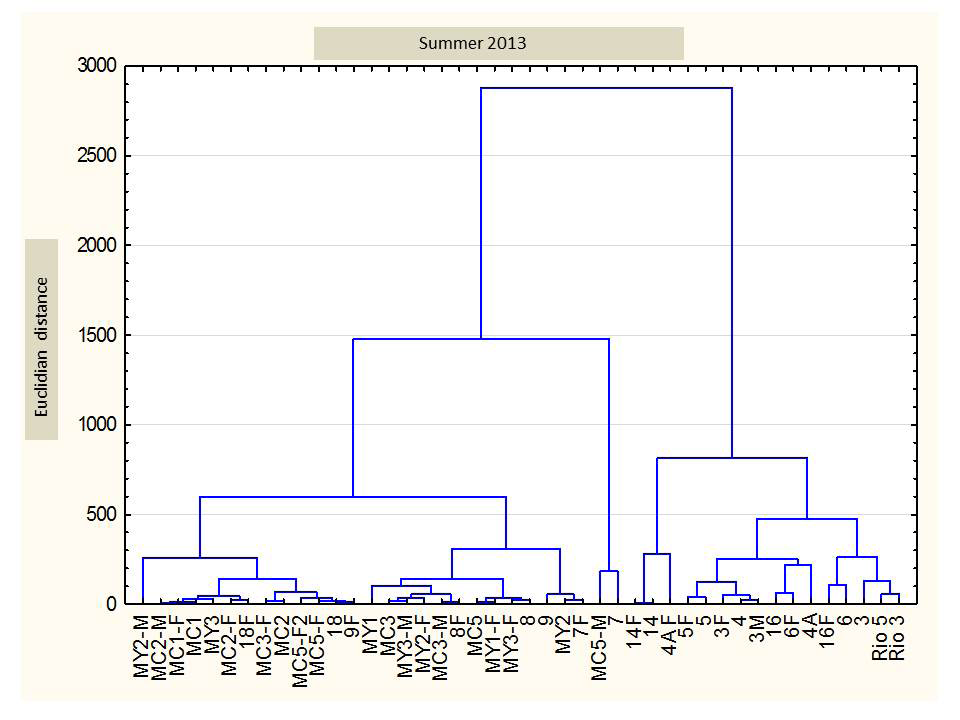
When it comes to similarities between the stations sampled in the summer campaign, it can be seen from the dendrogram (Figure 3) that there are two main groups, one that group the stations most internal to the estuarine-lagoon system, that is, those located in its channels, being this group is subdivided into others that are characterized mainly by their proximity to the region where freshwater enters the system, the other main group brings together the stations external to the estuarine-lagoon system, that is, those that are located in a predominantly marine environment, that is, in front of the openings of the Cananéia Sea and the Icapara Sea, to the south and north, respectively. In this case the stations “M” imposed some characteristics.
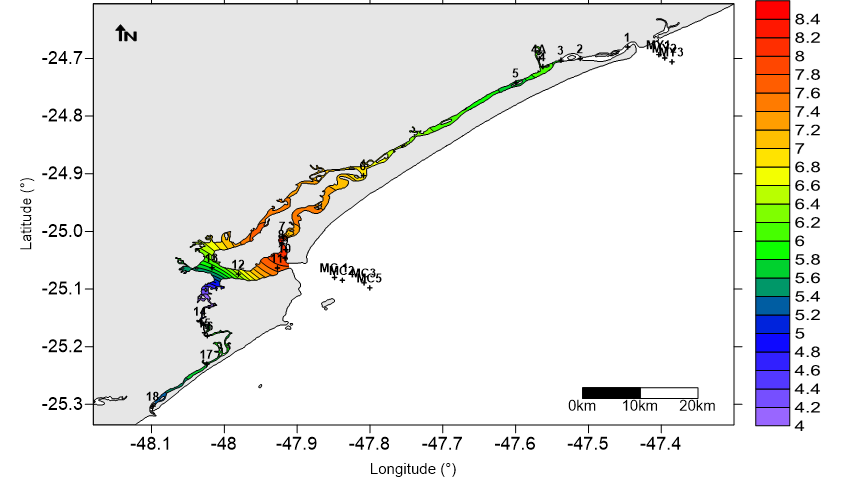
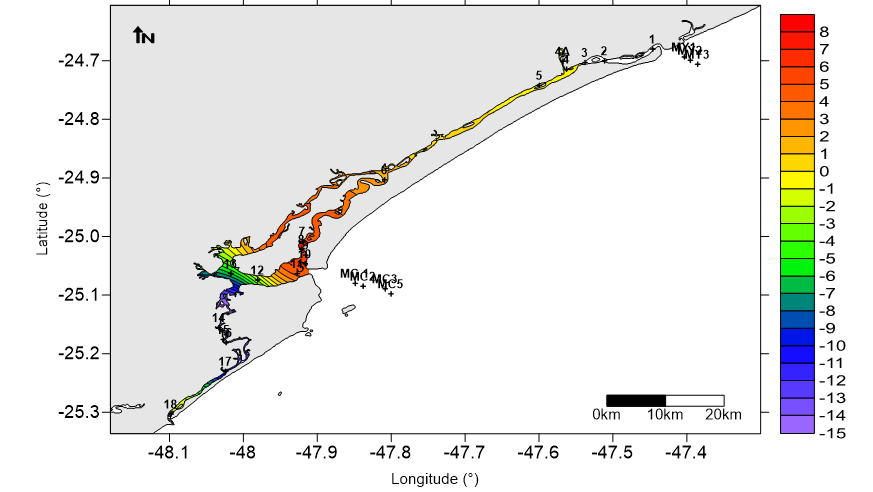
To try evidencing the difference between the seasonal periods in each sector of study, as assemblage of isolines was prepared. In relation to temperature Figure 4 it is showed a positive variation, without exception, of surface water temperatures in summer were higher than those recorded in winter. The regions with the lowest increases from winter to summer were those in the Ararapira sector, and those with the greatest increases were in Cananéia. This probably shows that the tide’s ability to renew the estuary’s water is more efficient near Cananéia than near to the mouth of the Ararapira, that is, the tidal prism volume in the two regions is probably quite different. The temperature is important to distinguish the winter and summer period in this region [26, 27, 36].
In relation to the difference in salinity (Figure 5) between summer and winter, a pattern similar to that of temperature can be noted with regard to the greater and lesser variations in the regions of Cananéia and Ararapira respectively. However, it is observed that there was a negative variation in the regions furthest from Ararapira, which shows that the waters in winter were more saline than in summer, even though in winter the seasons carried out in this region were carried out during a rainy period of consecutive days , a fact that reinforces the hypothesis that water exchange in the estuary region within the Ararapira is not very dynamic in relation to that which occurs closer to the mouth regions of the Ararapira and Cananéia.
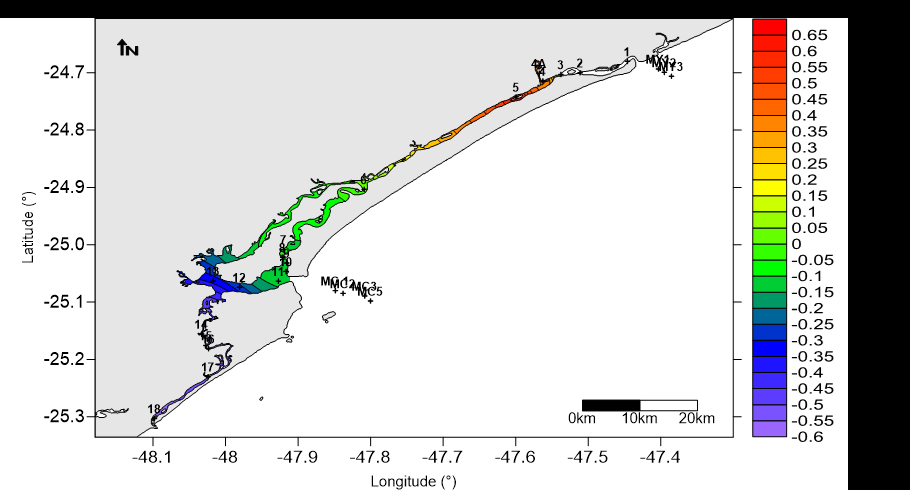
Regarding the differences between summer and winter for pH (Figure 6), it can be seen that the Ararapira region is characterized by negative variations, the Cananéia and Intermediate regions by minimal variations and the Iguape region by positive variations. The presence of saline water in the southern region maintain the high values of pH associated to low temperatures and wind action favouring the solubility of dissolved oxygen.
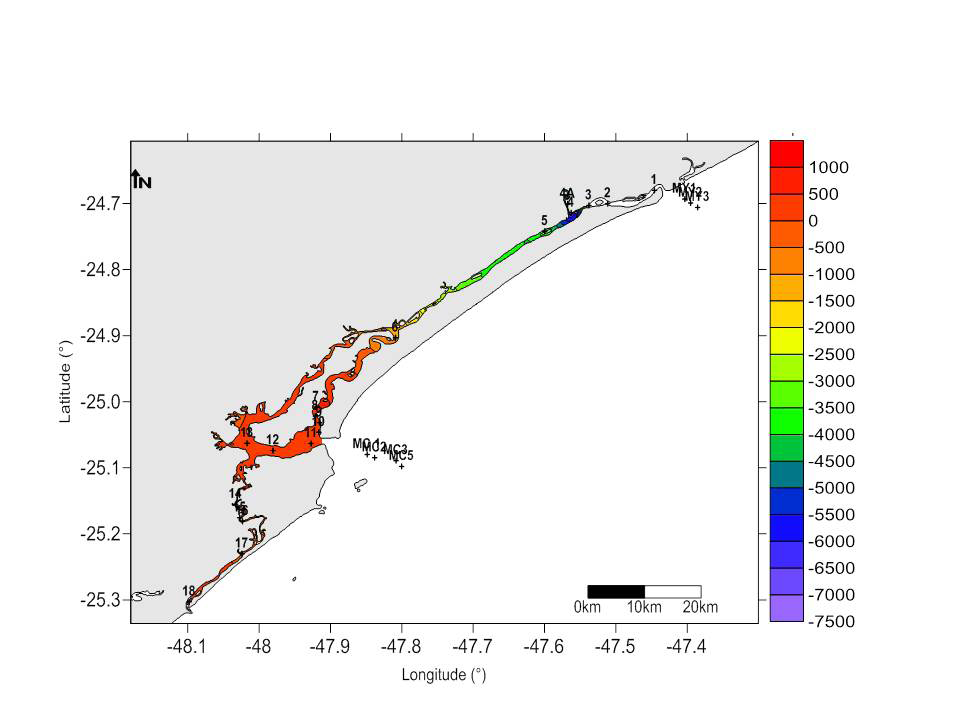
Observing the difference in TA between summer and winter (Figure 7), it is notable that the scales of variation in the negative direction are much greater than those in the positive direction, with a positive variation only being observed in the Cananéia region, close to stations 7 and 8. The most intense negative variations were concentrated in the southern portion of the complex, precisely in the central region of Ararapira and towards the interior of Trapandé Bay, in Cananéia, negative variations of smaller orders were also recorded in the region of Iguape. This variation in AT is mainly linked to two previously mentioned variation scenarios: temperature and salinity. It is possible to identify that TA follows regions with higher salinities and that have greater mixing, that is, smaller temperature variations, a situation that is reflected in the data for the Ararapira and Cananéia regions, where salinity variations of smaller magnitudes and the of temperature are associated with variations of smaller magnitudes of TA and where variations of greater magnitudes of salinity and temperature are associated with variations of greater magnitudes of TA, respectively.
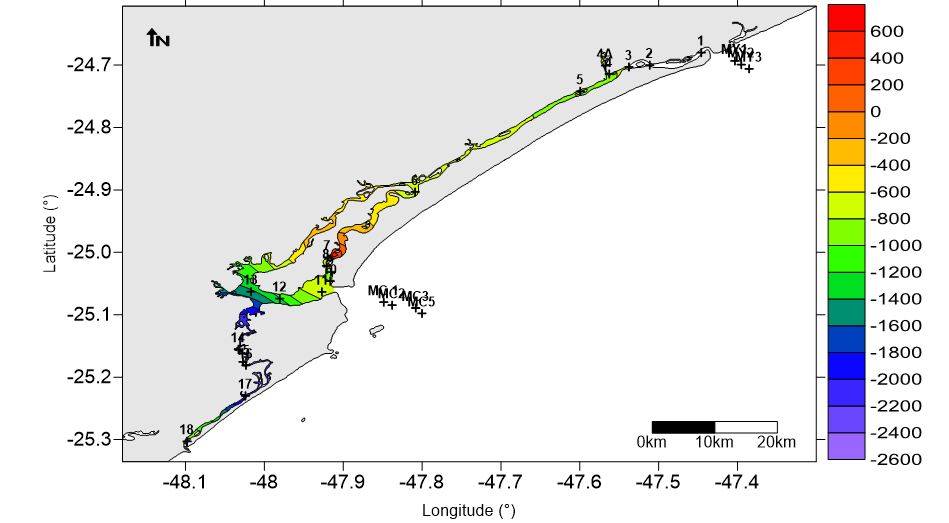
The fCO2 showed (Figure 8) mostly positive variations in the southern sector and mostly negative variations in the northern sector, with the order of magnitude of the negative variations being much greater than that of the positive variations. This panorama in the southern sector, i.e., Cananéia and Ararapira, shows that the process of releasing carbon dioxide to the atmosphere was facilitated in the summer in relation to the winter at the same place.
It is confirmed that sectors are influenced by rivers and sea with different intensities, with the southern being more marine and the northern being more fluvial, but both with distinct biogeochemical process submitted to the seasonal influence, observing that the primary production is most important in the intermediate and southern areas mainly considering the quality of waters and good transparency conditions to support it [32, 37, 38, 39]. However, the complex maintain the general tendency to be a source of CO2.
As discussed by some authors Cai, WJ [31], Laruelle GG, et al. [40], Chen CTA, et al. [29], Araujo M, et al. [41] about the role of the coastal system in relation to the behaviour as source or sink for CO2 in function of the variability of environmental data and this work show the variability of the carbon parameters in relation to the spatial and temporal conditions in a long estuarine-lagoon complex [42]. According to the present analyses the spatial distribution of biogeochemical parameters suggests a clear division in the study area into three biogeochemical domains considering the winter and summer seasonal aspects, and plus an area in summer considering the region out of the bars, in oceanic waters. The positive values of fCO2 reveal a predominant participation as a source of CO2 with important difference in intensity in sectors and seasons similar as observed in relation to the coastal distance by Bertini L, et al. [16] in the northeastern Brazilian estuary [43, 44].
Conclusion
Although the Cananéia-Iguape estuarine-lagoon complex is a contiguous body of water, there is a notable differentiation of the sub-regions in terms of hydrobiogeochemical aspects, with the northern region already considered impacted by human action, the intermediate region considered imminent impact and the southern region most preserved in terms of estuary, but subject to many erosion processes and bottom upheaval, especially in Cananéia and the Ararapira channel at the southern extreme. Therefore, the intermediate region is the one that is subject to the first effects of changes originating in the northern part.
Despite of more effective human intervention in the northern sector of this system, the southern part of this area is yet preserved and it is necessary a continuous observations of the anthropogenic influence on this system and the change in the carbon system by a monitoring program.
Acknowledgement
The authors thank the financial support from CNPq Proc. 478890/2011-7 and INCT-TMCOcean CNPq 573.601/2008-9 to the project development and FAPESP Proc.2012/16729-7 by the support to the student of scientific initiation. We also thank the team from LABNUT Laboratory in special Dr Vitor G. Chiozzini and Caio G. Hirakawa collaboration.
References
-
Sabine CS, Feely RA, Gruber N, Key RM, Lee K, et al. (2004) The oceanic sink for anthropogenic CO2. Science 305: 367-371.
-
Takahashi T, Sutherland SC, Sweeney C, Poisson A, Metzl N, et al. (2002) Global Sea-Air CO2 Flux Based on Climatological Surface Ocean pCO2, and Seasonal Biological and Temperature Effects. Deep Sea Research Part II: Topical Studies in Oceanography 49(9-10): 1601- 1622.
-
Takahashi T, Sutherland SC, Wanninkhof R, Sweeney C, Feely RA, et al. (2009) Climatological Mean and Decadal Change in Surface Ocean pCO2, and Net Sea-Air CO2 Flux over the Global Oceans. Deep Sea Research Part II: Topical Stu dies in Oceanography 56(8-10): 554-577.
-
Le Quéré C, Moriarty R, Andrew RM, Canadell JG, Sitch S, et al. (2015) Global Carbon Budget 2015. Earth System Science Data 7(2): 349-396.
-
Keller DP, Feng EY, Oschilies A (2014) Potential climate engineering effectiveness and side effects during a high carbon dioxide-emission scenario. Nat Communic 5: 3304.
-
Renforth P, Henderson G (2017) Assessing ocean alkalinity for carbon sequestration. Revue Geophysical 55(3): 636-674.
-
Lenton A, Matear RJ, Keller DP, Scott V, Vaughan NE (2018) Assessing carbon dioxide removal through global and regional ocean alkalinization under high and low emission pathways. Earth System. Dynamic 9(2): 339- 357.
-
Rau GH, Willauer HD, Ren ZJ (2018) The global potential for converting renewable electricity to negative-CO2- emissions hydrogen. Nature Clim Change 8: 621-625.
-
Caserine S, Pagano D, Campo F, Abaà A, De Marco S, et al. (2021) Potential of Maritime Transport for ocean liming and atmospheric CO2 removal. Frontiers Climate Carbon Dioxide Removal 3.
-
Albright R, Caldeira L, Hosfelt J, Kwiatkowski L, CMaclaren JK, et al. (2017) Reversal of ocean acidification enhances coral reef calcification. Nature 531: 362-365.
-
Le Quéré C, Andres RJ, Boden T, Conway T, Houghton RA, et al. (2013) The global carbon budget 1959-2011. Earth System Science Data 5(1): 165-185.
-
Friedlingstein P, Jones MW, O’Sullivan M, Andrew RM, Hauck J, et al. (2019) Global Carbon Budget. Earth Syst Sci Data 11(4): 1783-1838.
-
Takahashi T, Broecker WS, Brainbridge AE, Weiss RF (1980) Carbonate chemistry of the Atlantic, Pacific, and Indian Oceans: Results of the GEOSECS Expedition 1972- 1978. Lamont-Dohert, Geological Observatory Technical Report n° 1 CU-1-8.
-
Kheshgi HS (1995) Sequestering atmospheric carbon dioxide by increasing ocean alkalinity. Energy 20(9): 915-922.
-
Balch WM, Gordon HR, Bowler BC, Drapeau DT, Booth ES (2005) Calcium carbonate measurements in the surface global ocean based on moderate-resolution imaging spectroradiometer data. Journal of Geophysical Research 110(C7).
-
Bertini L, Braga ES (2022) The contribution of nutrients and water properties to the carbonate system in three particular areas of the Tropical Atlantic (NE-Brazil). Journal of Geoscience and Environment Protection 10(2): 135-161.
-
Feely RA, Sabine CL, Lee K, Berelson W, Kleypas J, et al. (2004) Impact of anthropogenic CO2 on the CaCO3 system in the oceans. Science 305(5682): 362-366.
-
RAMSAR (2017) Environmental Protection Area of Cananéia-Iguape-Peruíbe. Ramsar Sites Information Service.
-
Braga ES, Azevedo JS, Harari J, Castro CG (2023) Analysis of the 90º and 150º angles for increment counting in otoliths of estuarine catfish. In: Braga ES, Azevedo JS, et al. (Eds.), Research in a RAMSAR site: The Cananéia- Iguape-Peruibe estuarine-lagoon complex, Brazil. Special articles collection. Ocean and Coastal Research 71(1).
-
Suguio K, Tessler MG (1992) Quaternary deposits of the Cananéia-Iguape plain (SP) (1992). Roteiro de Excursões, Congresso Brasileiro de Geologia, Brazil 1(37): 37.
-
Suguio K, Martin NL (1978) Quaternary marine formations of the coast of São Paulo and southern Rio de Janeiro. International Symposium on Coastal Evolution in the Quaternary special publication n° 1 pp: 1-55.
-
INMET (2020) Portal Inmet: Weather Forecast for the Next 15 Days in Brazil - Weather Information No 22 IO- USP 2006.
-
Grasshoff K, Ehrhardt M, Kremling K (1983) Methods of seawater analysis. In: Weinhein CV (Ed.), 2nd (Edn). USA, pp: 419.
-
Aminot A, Chaussepied M (1983) Manual of chemical analyzes in the marine environment. In: National Center for Ocean Exploitation; prepared by Alain Aminot, Marcel Chaussepied, Paris. CNEXO 1: 395.
-
USGS (2010) Florida Shelf Ecosystems Response to Climate Change: from macro to micro scales U.S. Geological Survey.
-
Bastos ATCC, Braga ES (2023) Anthropogenic influence on silicon behavior in an estuary member of the Biosphere Reserve in Southeastern Brazil. In: Braga ES, Azevedo JS, et al. (Eds.), Research in a RAMSAR site: The Cananéia-Iguape-Peruibe estuarine-lagoon complex, Brazil. Special articles collection. Ocean and Coastal Research 71(1).
-
Sutti BO, Chiozzini VG, Carstro CG, Braga ES (2023) Sinking particles in the photic zone: relations with biogeochemical properties in different sectors of the Cananéia-Iguape Estuarine-Lagoon Complex (CIELC)- Brazil. In Braga ES, Azevedo JS, et al. (Eds.), Research in a RAMSAR site: The Cananéia-Iguape-Peruibe estuarine- lagoon complex, Brazil 71(1).
-
Carstensen J, Chierici M, Gustafsson BG, Gustafsson E (2018) Long-term and seasonal trends in estuarine and coastal carbonate systems. Global Biogeochemical Cycles 32(3): 497-513.
-
Chen CTA, Huang TH, Chen YC, Bai Y, He X, et al. (2013) Air–sea exchanges of CO2 in the world’s coastal seas. Biogeosciences 10(10): 6509-6544.
-
Lefévre N, Diverrés D, Gallois F (2017) Origin of CO2 Undersaturation in the Western Tropical Atlantic. Tellus B: Chemical and Physical Meteorology 62: 595-607.
-
Cai WJ (2003) Riverine inorganic carbon flux and rate of biological uptake in the Mississippi River plume. Geophysical Research Letters 30(2): 1032.
-
Cai WJ, Hu X, Huang WJ, Murrell MC, Lehrter JC, et al. (2011) Acidification of subsurface coastal waters enhanced by eutrophication. Nature Geoscience 4(11): 766-770.
-
Hagens M, Slomp CP, Meysman FJR, Seitaj D, Harlay J, et al. (2015) Biogeochemical processes and buffering capacity concurrently affect acidification in a seasonally hypoxic coastal marine basin_._ Biogeosciences 12(5): 1561-1583.
-
Melzner F, Thomsen J, Koeve W, Oschlies A, Gutowska MA, et al. (2013) Future ocean acidification will be amplified by hypoxia in coastal habitats. Marine Biology 160(8): 1875-1888.
-
Saderne V, Geraldi NR, Macreadie PI, Maher DT, Middelburg JJ, et al. (2019) Role of carbonate burial in Blue Carbon budgets. Nature Communications, 10(1): 1106
-
Aguiar VMdC, Baptista Neto JA, Braga ES (2013) Nutrient dynamics in a pristine subtropical lagoon - estuarine system. Lambert Academic Publishing, UK, pp: 60.
-
Akhand A, Chanda A, Watanabe K, Das S, Tokoro T, et al. (2021) Reduction in riverine freshwater supply changes inorganic and organic carbon dynamics and air‐water CO2 fluxes in a tropical mangrove dominated estuary. Journal of Geophysical Research: Biogeosciences 126(5): e2020JG006144.
-
Guo X, Cai WJ, Zhai W, Dai M, Wang Y, et al. (2008) Seasonal Variationsin the Inorganic Carbon System in the Pearl River (Zhujiang) Estuary. Continental Shelf Research 28(12): 1424-1434.
-
Braga EDS, Lucena LM, Almeida AJM, Pires MLT, Nascimento JEFD, et al. (2023) The estuarine environment and pH variation: natural limts and experimental observation of the acidification effect on phosphorus bioavailability. Quimica Nova 46: 591-607.
-
Laruelle GG, Durr HH, Slomp CP, Borges AV (2010) Evaluation of sinks and sources of CO2 in the global coastalocean using a spatially-explicit typology of estuaries and continental shelves. Geophysical Research Letters 37(15): L15607.
-
Araujo M, Noriega C, Veleda D, Lefevre N (2013) Nutrient input and CO2 flux of a tropical coastal fluvial system with high population density in the Northeast region of Brazil. Journal of Water Resource and Protection 5(3): 362-375.
-
Doney SC, Busch DS, Cooley SR, Kroekert KJ (2020) The impacts of ocean acidification on marine ecosystems and reliant human communities. Annals Revue of Environment Research 45: 82-112.
-
IPCC (2014) Summary for Policymakers. In: Field CB (Ed.), Climate Change 2014: Impacts, Adaptation, and Vulnerability. Part A: Global and Sectoral Aspects. Contribution of Working Group II to the Fifth Assessment Report of the Intergovernmental Panel on Climate Change, pp: 1-32.
-
Noriega C, Araujo M, Lefevre N, Montes MF, Gaspar F, et al. (2015) Spatial and temporal variability of CO2 fluxes in tropical estuarine systems near areas of high population density in Brazil. Regional Environmental Change 15: 619-630.
- Genetic Improvement of Nile Tilapia (Oreochromis niloticus): Advances in Selective Breeding and Genomic Approaches for Sustainable Aquaculture
- Microplastics, Contaminants, and Waste Hotspots: Divergences and Faults in Prioritizing Control Efforts
- Creating a Healthier, More Vibrant Open and Closed Aquatic Environment. A Submersible, Centrifugal Magnetically Affixed Current Changing Aquarium Pump
- An Attempt to Assess Alpha Diversity and Sample Size: Using the Ostracod Assemblages off Kumamoto Port, Japan
- Assessment of the Efficiency of Common Fishing Gears and Crafts Used at Mohananda River of Chapai Nawabganj, Bangladesh
- Fish Productivity and Biodiversity Status of Sundarban Mangrove in Bangladesh