Population Growth of Katsuwonus pelamis and Vulnerability to Fishing along the Syrian coast (Eastern Mediterranean Sea)
From May 2023 to September 2024, a total of 270 random samples of Katsuwonus pelamis were collected from the waters off the coast of Syria. Sophisticated analytical methods, including artificial neural networks and fuzzy logic, were utilized to examine these samples. The largest specimen recorded had a fork length of 85 cm and was estimated to be 8 years old. The von Bertalanffy growth equation derived from the fork length data (FLt = 140.72 (1-e-0.09 (t + 2.378))) shed light on the growth dynamics of this Katsuwonus pelamis population, indicating a trend of positive allometric growth, with a growth coefficient (b) of 3.29. The index of growth performance (Φ’) was calculated at 3.24, reflecting efficient growth rates. Estimates of mortality rates for Katsuwonus pelamis showed total mortality (Z) at 1.07 y⁻¹, fishing mortality (F) at 0.85 y⁻¹, natural mortality (M) at 0.22 y⁻¹, and exploitation ratio (E) at 0.79 y⁻¹, resulting in a survival coefficient (S) of 0.34 y⁻¹. The analysis indicated a large population growth (FP) of 56.6, while also revealing a high vulnerability to fishing (58.6 FV), which poses a considerable risk to the species. These findings underscore the necessity for conservation strategies aimed at sustainable management of the species, enhancing our understanding of the growth, mortality, and fishing vulnerability of Katsuwonus pelamis, and informing future research and management efforts.
Introduction
The skipjack tuna, scientifically classified as Katsuwonus pelamis, is a medium-sized fish belonging to the family Scombridae, making it the sole representative of the genus Katsuwonus. Commonly referred to by various names such as katsuo, mushmouth, arctic bonito, oceanic bonito, striped tuna, or victor fish, this species can reach lengths of up to 1 meter. It inhabits tropical and warm-temperate waters, demonstrating a cosmopolitan distribution. Skipjack tuna plays a significant role in global fisheries, highlighting its importance as a resource [1]. The most recent assessment of Katsuwonus pelamis for the Red List of Threatened Species by the IUCN occurred in 2021, where it was classified as Least Concern [2, 3].
Determining the age of fish is essential for effective fisheries management and conservation efforts. Traditional methods typically rely on skilled readers to carefully examine the annual growth rings in otoliths. However, recent advancements in artificial intelligence (AI) present a more efficient and accurate alternative. The multilayer perceptron artificial neural network model has emerged as a viable option compared to conventional deep learning approaches, demonstrating higher accuracy, reduced effort, and lower costs [4, 5, 6, 7, 8, 9, 10]. Importantly, this method contributes to fish conservation indirectly by minimizing mortality rates and enhancing opportunities for survival, reproduction, and distribution, particularly for endangered species or those facing population declines and habitat loss.
Expert systems, a form of artificial intelligence (AI) that simulates human expertise, are increasingly being utilized in fisheries research. These systems leverage fuzzy logic and other AI methodologies to address complex issues related to fish population dynamics, vulnerability assessments, and conservation efforts. Cheung, et al. [11] developed a fuzzy logic-based expert system for assessment the extinction vulnerability of marine fish due to fishing pressures. In a separate study, Cheung, et al. [12] employed an expert system to assess the vulnerabilities and conservation risks faced by marine species as a result of fishing activities. Additionally, Jones, et al. [13] applied fuzzy logic to determine the
susceptibility of marine species to climate change impacts. Hamwi, et al. [14] estimated the vulnerability of Sparidae fish species along the Syrian coast of the eastern Mediterranean Sea utilizing the fuzzy logic approach. Furthermore, Hamwi, et al. [15] proposed a model based on fuzzy logic expert systems to estimate fishery population growth.
Research on Katsuwonus pelamis in Syrian waters has been lacking. This initial study investigates growth patterns and the effects of fishing using advanced techniques such as neural networks and fuzzy logic within an expert system framework.
Materials and Methods
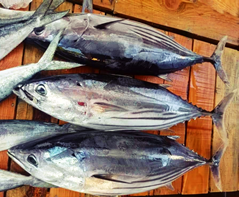
Between May 2023 and September 2024, a thorough collection of 270 specimens of Katsuwonus pelamis, also known as Skipjack tuna, was conducted along the Syrian coastline and its territorial waters. Various fishing techniques, such as purse seines, longlines, traps, and different manual methods, were utilized to gather these samples (Figure 1).
Age and Maturity
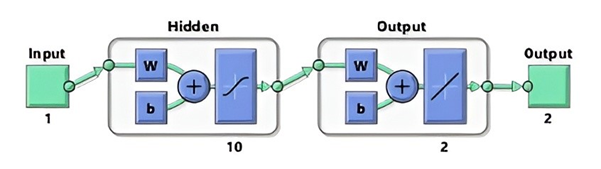
In the research carried out by Hamwi [4], a Multilayer Perceptron artificial neural network model was used to estimate the maturity and age of Katsuwonus pelamis. This network model was structured with a configuration of (1, 10, 2), representing the number of neurons in each layer. The fork length (FL) of the fish served as the input parameter for the revised network model (Figure 2).
Growth of Fishery Population (FP)
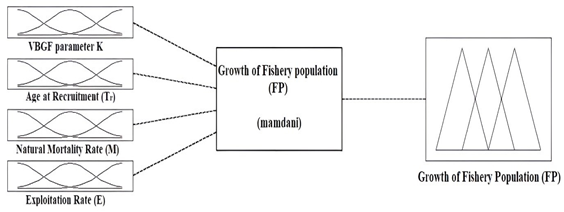
In their study, Hamwi, et al. [15] created an expert system model using fuzzy logic to estimate the growth of the Katsuwonus pelamis population in Syrian waters. The model utilized particular parameters (E, M, Tr, K) as input variables and employed fuzzy logic methods for data analysis and interpretation (Figure 3).
The von Bertalanffy equation was employed to calculate the parameters (K, FL∞), with the selection of the most suitable growth model guided by the Akaike Information Criterion (AIC) [AIC = N ln (WSS) + 2M]. In this context, N refers to the number of data points, WSS is the weighted sum of squares of residuals, and M indicates the number of model parameters. The objective of the research was to assess various growth models that describe the characteristics of the fish species [16]. The growth model can be represented as FLt = FL∞ / (1 + e-K(t-t0)), where FLt signifies the fork length of the fish at a given age (t), FL∞ represents the theoretical maximum fork length (in centimeters) the fish can attain, K is the growth coefficient, and t0 denotes the theoretical age when the length of the fish is presumed to be zero.
The Ricker method [17] was used to estimate the total mortality rate (Z). This method involved calculating the regression equation for the catch curve (ln Nt = a - Zt) for the entire population. The natural mortality rate (M) was estimated using a specific formula: Log M = -0.0066 - 0.279 log FL∞ + 0.6543 log K + 0.4634 log T [18], where the von Bertalanffy parameters FL∞ and K, along with the average surface water temperature (T) in the fishing area, were applied. During the study, the average surface water temperature was noted to be 24.84 °C.
The fishing mortality rate (F) was determined by subtracting the rate of natural mortality (M) from the total mortality rate (Z), following Ricker’s methodology [17]. Thus, F = Z - M. The exploitation rate (E) was calculated using the formula E = F / Z, as outlined by Sparre, et al. [19]. The survival rate (S) was derived from the equation S = e-Z, as suggested by Ricker [17]. To estimate the fork length (FLc) and age (Tc) at first capture, equations proposed by Beverton, et al. [20] were utilized: FLc = FL’ - [ K (FL∞ - FL’) / Z ]; Tc = - (1/K) * ln (1 - FLc / FL∞) + t0, where FL’ denotes the average fork length of the captured fish.
The fork length (FLr) and age at recruitment (Tr) were determined using the equations put forth by Beverton, et al. [20]: FLr = FL’ - [ K (FL∞ - FL0) / Z ]; Tr = - (1/K) * ln (1 - FLr / FL∞) + t0, where FL0 refers to the fork length of the fish at hatching or age zero.
The growth performance index (ΦFL`) can be calculated using the equation proposed by Pauly, et al. [21]: ΦFL` = logK + 2logFL∞.
The relative yield-per-recruit (Y’/R) model, based on the Beverton and Holt framework [22], is expressed as follows: Y’/R = [ E * U(M/K) ] * [ 1 – (3U / (1 + m) + (3U² / (1 + 2m) – (U³ / (1 + 3m) ], where U = 1 - (FLc/FL∞); m = (1-E) / (M/K) = (K/Z); and E = F/Z.
The relative biomass-per-recruit (B’/R) is calculated using the relationship established by Ricker [17]: B’/R = (Y’/R) / F.
Fishing Vulnerability (FV)
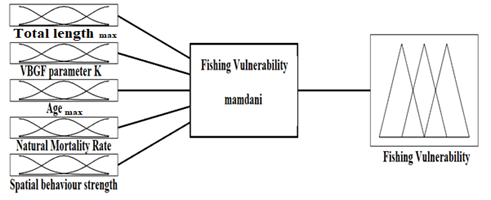
To evaluate the vulnerability of Katsuwonus pelamis to fishing, the model created by Hamwi, et al. [15] was utilized. This expert system incorporated specific parameters (FLmax, K, Tmax, M, S) as inputs and employed fuzzy logic techniques to analyze and assess the species’ susceptibility to fishing (Figure 4).
Results and Discussion
The analysis of the age structure of Katsuwonus pelamis identified eight distinct age groups. Notably, the five-age
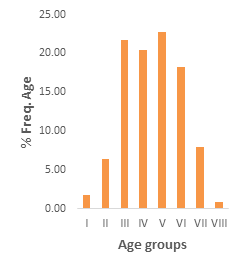
group was the most common, accounting for 22.82% of the total population. In contrast, the eighth age group made up only 0.85% of the overall catch, suggesting a long lifespan for this species in the seawaters of Syria (Figure 5).
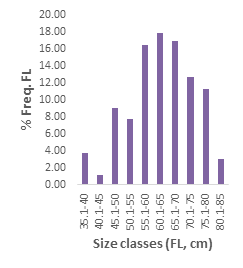
The analysis of fork length (FL) distribution revealed that the most abundant group had fork lengths between 60.1 and 65 cm, representing 17.89% of the population. Conversely, individuals with fork lengths ranging from 40.1 to 45 cm were the least common, comprising only 1.13% of the total population.
In this study, Katsuwonus pelamis specimens caught in Syrian seawaters displayed a maximum fork length of 85 cm at the age of 8+. The smallest recorded fork length for an individual was 35.2 cm at the age of 1+. da Cunha-Neto, et al. [23] reported that in the western equatorial Atlantic, fork lengths ranged from 25 cm to 74 cm at the age of 5+. Soares, et al. [24] documented a maximum observed length of 84.7 cm at the age of 7 in the Southwest Atlantic. In the eastern Atlantic Ocean, fork lengths recorded varied between 36 cm and 62 cm [25] (Table 1).
| Location and author | Age | Fork length(FL, cm) | |
|---|---|---|---|
| min | max | ||
| western equatorial Atlantic [23] | 5 | 25 | 74 |
| Syrian seawaters [present study] | 8 | 35 | 85 |
| southwest Atlantic [24] | 7 | 37 | 84.7 |
| eastern Atlantic Ocean [25] | 36 | 62 |
Table 1: Maximum-minimum fork length and age of _Katsuwonus pelamis_ from different water bodies.
The parameters of the von Bertalanffy growth equation for fork length were determined to be: FLt = 140.72 (1 - e-0.09 (t + 2.378)) with an AIC of 5705.02, a WSS of 2960.22, and a 95% confidence interval of 3.8261. Previous studies have reported varying estimates for the asymptotic fork length growth (FL∞) of Katsuwonus pelamis in different regions. Gaertner, et al. [25] reported an FL∞ value of 112.34 cm for the eastern Atlantic Ocean. da Cunha-Neto, et al. [23] found an FL∞ value of 122.50 cm in the western equatorial Atlantic. Soares, et al. [24] recorded an FL∞ value of 90.1 cm.
The growth coefficient (k) for Katsuwonus pelamis fork length was evaluated, yielding a value of 0.09. This value is lower compared to the eastern Atlantic Ocean (k = 0.14) [25], as well as the western equatorial Atlantic (k = 0.12) [23] and the Southwest Atlantic (k= 0.24) [24]. The study indicated a positive allometric growth pattern (b = 3.29 > 3) for fork length, suggesting that fork length increases more rapidly than other dimensions. Notably, this positive allometric growth pattern (b = 3.223) was specifically observed in the Prigi waters, Trenggalek East Java Indonesia [26] and in the western and central Pacific Ocean (b= 3.37) [27], as well as in Southwest Atlantic (b= 3.418) [24].
According to the findings of this study, the average age and fork length of Katsuwonus pelamis at first capture were found to be 3.51 years and 56.37 cm, respectively. Similarly, individuals at recruitment had an average age of 3.11 years and a fork length of 53.42 cm. The ratio of first capture length to asymptotic length (Lc/L∞) serves as an indicator of whether the harvested fish are mainly juveniles or mature individuals. A ratio below 0.5 suggests that the majority of the catch consists of juvenile fish species [28]. In this study, the estimated (FLc/FL∞) ratio was 0.40, indicating that most of the catch in the Katsuwonus pelamis fishery is primarily juvenile fish. The growth performance index (Φ’) for fork length growth was calculated and recorded as 3.24, which is comparable to that of the western equatorial Atlantic, where it was measured at 3.26 [23].
The total mortality coefficient (Z) for Katsuwonus pelamis was estimated at 1.07 y⁻¹. The fishing mortality coefficient (F) was calculated to be 0.85 y⁻¹, while the natural mortality (M) was estimated at 0.22 y⁻¹. The survival rate (S) was determined to be 0.34 y⁻¹. Additionally, the exploitation mortality coefficient (E) was found to be 0.79 per year. In comparison, the values for Z (1.42 y⁻¹), F (0.95 y⁻¹), M (0.47 y⁻¹), and E (0.67 y⁻¹) were reported in the southwest Atlantic [24].
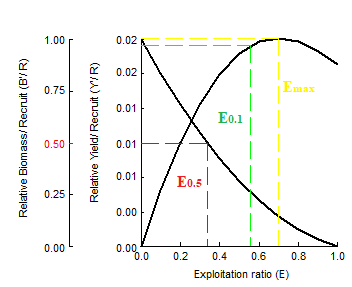
Figure 6 illustrates the relationship between exploitation rates (E) and the relative yield per recruit (Y’/R) as well as the relative biomass per recruit (B’/R). The analysis included exploitation rates ranging from 0.05 to 1.00 as variable input parameters. By examining the derivative of the yield function with respect to the exploitation rate, several significant values were identified. One key value is Emax, which represents the exploitation rate that maximizes yield per recruit; for Katsuwonus pelamis, the calculated Emax was 0.697 y⁻¹. Two additional important values were also determined. E0.1 corresponds to the exploitation rate when the marginal increase in relative yield-per-recruit reaches one-tenth of its value at E = 0; for Katsuwonus pelamis, this was calculated to be 0.556 y⁻¹. Furthermore, E0.5 indicates the exploitation rate at which the stock’s biomass is reduced to 50% of its unexploited level, with an estimated E0.5 of 0.337 y⁻¹ for Katsuwonus pelamis. These findings enhance our understanding of the interactions between exploitation rates, relative yield, and biomass per recruit for Katsuwonus pelamis, providing valuable insights into the population dynamics of this species and guidance for sustainable management practices. The results indicate that the current exploitation rate (E = 0.79) in Syrian seawaters exceeds Emax, suggesting that fishing pressure has surpassed critical levels, leading to overfishing of Katsuwonus pelamis populations. If intensive fishing continues without a resource management plan, the stocks of Katsuwonus pelamis are likely to decline significantly over time (Figure 6).
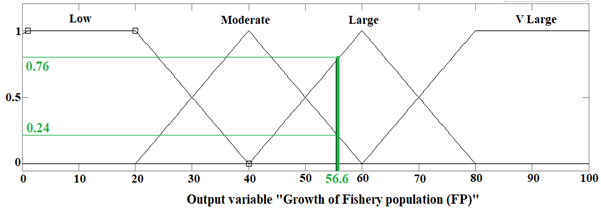
The fuzzy logic-based expert system developed by Hamwi, et al. [15] produced a growth value of 56.6 for the Katsuwonus pelamis population in the seawaters of Syria. This value reflects a large growth rate of 76 and a moderate growth rate of 24, based on a maximum fishery population growth (FP) value of 100 (Figure 7). It indicates a clear trend toward substantial growth within the environment of Syrian waters.
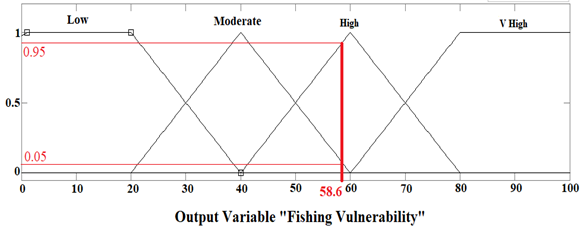
According to the fuzzy logic expert system created by Hamwi, et al. [14], Katsuwonus pelamis displayed a fishing vulnerability of 58.6 FV, with the value of maximum vulnerability (FV) set at 100. This score indicates a high vulnerability level of 95 and a moderate vulnerability level of 5 (Figure 8), suggesting a strong susceptibility to fishing pressures. As a result, these fish species are under significant threat in the seawaters of Syria. In contrast, Fishbase’s intrinsic vulnerability assessment classifies Katsuwonus pelamis as moderately vulnerable, with a rating of 38 out of 100 [29].
Conclusions
The current study offers valuable insights into the population dynamics of Katsuwonus pelamis in Syrian seawaters, emphasizing the need for conservation measures to ensure the sustainable management of this species. The findings enhance our understanding of the growth patterns, mortality rates, and fishing susceptibility of Katsuwonus pelamis, providing a foundation for future research and management strategies. The results have significant implications for managing the Katsuwonus pelamis fishery in Syrian seawaters. Overfishing can severely affect the population’s ability to sustain itself, resulting in a decline in abundance. Therefore, it is essential to implement management strategies that reduce the catch of Katsuwonus pelamis and promote the long-term sustainability of the fishery.
Acknowledgments
The author would like to express their gratitude to Tishreen University for their support and assistance in conducting this research, as well as extend a great appreciation to the artisanal fishermen, particularly the professional fisherman Abu Bassam.
References
-
Collette BB, Nauen CE (1983) FAO Species Catalogue. Scombrids of the world. An annotated and illustrated catalogue of tunas, mackerels, bonitos and related species known to date. Rome, FAO, FAO Fish Synop 125(2): 137.
-
Collette BB, Boustany A, Fox W, Graves J, Juan Jorda M, et al. (2021) Katsuwonus pelamis. The IUCN Red List of Threatened.
-
IUCN (2024) The IUCN Red List of Threatened Species.
-
Hamwi N (2024a) Predicting age and maturity of endangered Spiny butterfly ray, _Gymnura_ _altavela_ (Linnaues 1758) using artificial neural network (multilayer perceptron). Damascus University Journal for the basic sciences 40(1): 55-68.
-
Hamwi N (2024b) Population Growth of _Thunnus_ _thynnus_ and Vulnerability to Fishing along the Syrian Coast (Eastern Mediterranean Sea). International Journal of Oceanography & Aquaculture 8(2): 000311.
-
Hamwi N (2024c) Population Assessment of White Grouper _Epinephelus_ _aeneus_ Using Specialist Technical Methods Along Coastal Syrian Waters in The Eastern Mediterranean. Journal of Marine Science and Research 3(1).
-
Hamwi N, Ali-Basha N (2024) Growth of Spiny Butterfly Ray _Gymnura_ _altavela_ Population and Vulnerability to Fishing along the Syrian Coast (Eastern Mediterranean Sea). International Journal of Oceanography & Aquaculture 8(3): 000326.
-
Hamwi N, Ali-Basha N, Altajer H, Salem J (2024a) Assessment of Dusky Spinefoot _Siganus_ _luridus_ Population Dynamics along the Syrian Coast (Eastern Mediterranean Sea) Utilizing Different Expert System Techniques. International Journal of Oceanography & Aquaculture 8(3): 000329.
-
Hamwi N, Ali-Basha N, Altajer H, Salem J (2024b) Population assessment of greater amberjack _Seriola_ _dumerili_ along the Syrian waters in the eastern Mediterranean Sea using expert systems. Journal of Marine Science and Research 3(1).
-
Hamwi N, Ali-Basha N, Altajer H, Salem J (2024c) Assessment of Population Growth and Fishing Vulnerability of _Pomadasys_ _stridens_ along the Syrian Coast (Eastern Mediterranean Sea). International Journal of Oceanography & Aquaculture 8(3): 000333.
-
Cheung WWL, Pitcher T, Pauly D (2005) A fuzzy logic expert system to estimate intrinsic extinction vulnerabilities of marine fishes to fishing. Biological Conservation 124(1): 97-111.
-
Cheung WWL (2007) Vulnerability of marine fishes to fishing: from global overview to the northern south China sea. A Thesis in the University of British Columbia pp: 354.
-
Jones MC, Cheung WWL (2017) Using fuzzy logic to determine the vulnerability of marine species to climate change, Glob Change Biol pp: 1-13.
-
Hamwi N, Ali Basha N (2019) Estimation of the vulnerability of some Sparidae species to fishing in the Eastern Mediterranean Sea (Syrian coast) by fuzzy logic method. Journal of Al-Baath University 41(10): 129-160.
-
Hamwi N, Ali-Basha N, Altajer H, Farah T (2022) A proposed model to estimate the growth of the fishery populations by expert system. Journal of Hama University 5(9): 92-106.
-
Hamwi N (2018) Use Akaike (AIC) and Schwartz (SC) information criterions in the differentiation between nonlinear growth models of different fish species. Journal of Al-Baath University 40(3): 45-66.
-
Ricker WE (1975) Computation and interpretation of biological statistics of fish populations. Bulletin of the Fisheries Research Board of Canada 191: 382.
-
Pauly D (1980) A new methology for rapidly acquiring basic information on tropical fish stocks: growth, mortality and stock recruitment relationships. In: stock assessment for tropical small-scale fisheries. Saila SB, Roedel PM (Eds.), ICMRD, Univ. Rhode Island, Kinston, pp: 154-172.
-
Sparre P, Venema SC (1998) Introduction to tropical fish stock assessment-Part 1: Manual. FAO Fisheries Technical Paper 306/1: 407.
-
Beverton RJH, Holt SJ (1957) On the dynamics of exploited fish population. Fishery Investigations, Series II (London), 19: 1- 533.
-
Pauly D, Munro JL (1984) Once more on the comparison of growth in fish and invertebrates. FishByte 2(1): 21.
-
Beverton RJH, Holt SJ (1966) Manual of methods for fish stock assessment. Part II. Tables of yield function. FAO Fish Biol Tech Pap (38): 1.
-
da Cunha-Neto MA, Hazin HG, da Silva GB (2022) Age and growth of skipjack tuna (_Katsuwonus_ _pelamis_) in the western equatorial Atlantic based on dorsal spines analysis. _Boletim do Instituto de Pesca_ 48: e686.
-
Soares JB, Monteiro-Neto C, da Costa MR, Martins RRM, dos Santos Vieira FC, et al. (2019) Size structure, reproduction, and growth of skipjack tuna (_Katsuwonus_ _pelamis_) caught by the pole-and-line fleet in the southwest Atlantic. Fisheries Research 212: 136-145.
-
Gaertner D, de Molina AD, Ariz J, Pianet R, Hallier JP (2008) Variability of the growth parameters of the skipjack tuna (_Katsuwonus_ _pelamis_) among areas in the eastern Atlantic: analysis from tagging data within a meta-analysis approach. Aquatic Living Resources 21(4): 349-356.
-
Bintoro G, Lelono TD, Setyohadi D, Fadzilla U (2021) Growth patterns of skipjack tuna (_Katsuwonus_ _pelamis_, linnaeus 1758) caught by troll line in Prigi waters, Trenggalek East Java Indonesia. In IOP Conference Series: Earth and Environmental Science. IOP Publishing 890(1): 012047.
-
Jin S, Yan X, Zhang H, Fan W (2015) Weight–length relationships and Fulton’s condition factors of skipjack tuna (_Katsuwonus_ _pelamis_) in the western and central Pacific Ocean. Peer J 3: e758.
-
Pauly D, Soriano ML (1986) Some practical extensions to Beverton and Holt’s relative yield-per-recruit model. In The first Asian fisheries forum. Manila: Asian Fisheries Society pp: 491-496.
-
Froese R, Pauly D (2024) FishBase. World Wide Web electronic publication.
- Genetic Improvement of Nile Tilapia (Oreochromis niloticus): Advances in Selective Breeding and Genomic Approaches for Sustainable Aquaculture
- Microplastics, Contaminants, and Waste Hotspots: Divergences and Faults in Prioritizing Control Efforts
- Creating a Healthier, More Vibrant Open and Closed Aquatic Environment. A Submersible, Centrifugal Magnetically Affixed Current Changing Aquarium Pump
- An Attempt to Assess Alpha Diversity and Sample Size: Using the Ostracod Assemblages off Kumamoto Port, Japan
- Assessment of the Efficiency of Common Fishing Gears and Crafts Used at Mohananda River of Chapai Nawabganj, Bangladesh
- Fish Productivity and Biodiversity Status of Sundarban Mangrove in Bangladesh