Potential Effects of Climate Change on the Distribution of Endemic Lizards (Squamata: Sauria) in Cuba
Climate change has modified the distribution and abundance of numerous species. Being ectotherms, reptiles are especially susceptible to this phenomenon, which worldwide threatens almost 40 % of known species of lizards. Its impact on the herpetofauna of Cuba has been little studied. Therefore, we estimate the possible effects of climate change on the distribution of 46 endemic lizard species. To modelling the climatic niche of the species with the MaxEnt program, we used 3 698 presence records and 17 WorldClim bioclimatic variables. For transferring to the future, we used two climate scenarios with RCP 2.6 and RCP 8.5, at two times periods (2050 and 2070). We assumed vulnerability as the potential reduction of future areas of climatic suitability (ACS) compared to current ones. We superimposed the distributions to detect sites of greater potential richness and those of greater exposure to climate change. We evaluated the models obtained as useful and excellent according to the AUC values, reflecting their high predictive capacity. The most extensive current ACS corresponded to Anolis equestris (98 213 km2), and the smallest to A. quadriocellifer (3 074 km2). With the most alarming scenario (RCP 8.5), a loss of more than 30 % of the ACS and a greater probability of extinction in their current areas of occupation was predicted in almost 85 % of the species by 2070. Mesophilic species showed greater vulnerability, losing 30.8 to 100 % of their future ACS for the RCP 8.5 scenario. The trend in all projections was the reduction of ACS, mainly in the West and Center regions. The greater richness of lizards, and the greater gain and stability of future ACS, corresponded to the main mountainous massifs of the country, so that these regions could act as climatic refuges against the conditions of climate change. However, the little dispersal capacity of these species and low landscape connectivity resulting from anthropic activities could limit the future colonization of available habitats.
Introduction
In recent decades, climate change has produced changes in the distribution and abundance of numerous species in various regions of the planet [1], so it has received increasing attention [2]. It is predicted that its effects will get worse in the coming years, so it could contribute to the extinction of 18 % of all species by 2050 [3], and almost 40 % of all lizard species by 2080 [4]. Given their condition as ectotherms, the current distribution patterns and ecology of squamous reptiles (lizards, snakes and amphisbaenians) are a reflection of the temperature and rainfall regimes of the places where they live [5] which makes them especially vulnerable to warming, so their decline is predicted to occur at higher rates than those of other organisms [6]. However, the data to validate these predictions are still relatively scarce, since this group is one of the least studied in this regard, especially at the local level [7, 8].
The National Report to the Convention on Biological Diversity identifies climate change as one of the greatest threats to biodiversity in Cuba [9], and our region is among those with the highest concentration of species, both marine and terrestrial, vulnerable to this phenomenon on a global scale [8]. Among the predicted effects are: the increase in the mean annual temperature, the intensification and expansion of the periods of drought, the rise in the mean sea level and the increase in the frequency and intensity of hurricanes [10]. In our country, various actions have been carried out that address this issue and its impact on various aspects of society and the economy; however, for the Cuban land biota, studies focused on this issue are still scarce. For example, Rodríguez, et al. [11] and Blanco, et al. [12] analyzed the effect of sea level rise on the herpetofauna of Ciénaga de Zapata and coastal birds through the Cuban archipelago, respectively. Both studies suggest the loss of important habitats and the possible local disappearance of some reptile and amphibian species, as well as important nesting sites for birds. In the specific case of lizards, Velazco, et al. [13] uses Ecological Niche Models for the first time to assess the effect of climate change on the distribution of 13 species of the Sphaerodactylus genus.
Currently, 161 reptile species inhabit the Cuban archipelago, grouped into 32 genera and 21 families, with a high percentage of endemism (approximately 82.6 %) [14]. The Red Book of Vertebrates of Cuba [15] includes 87 of these species under different threat categories. The negative effects of climate change on the Cuban herpetofauna are not only related to the increase in temperatures, but also to a greater frequency of hurricanes and prolonged droughts, and with penetrations of the sea in low coastal areas and keys of the island groups, to which adds the very restricted distribution of many of the species [15, 16]. For all this, it is vitally important to identify which species or groups of these may be at greater risk in the face of this phenomenon.
This research aims to estimate the possible impact of anthropogenic climate change on the distribution of 46 endemic lizard species in Cuba by using Ecological Niche Models and spatial analysis for the years 2050 and 2070 in two different emission scenarios. In addition, potentially more exposed groups and biogeographic regions will be identified, as well as potential climatic refuges of importance for the conservation of Cuban lizards. These predictions would help guide monitoring to detect unrecognized populations of these species, re- evaluate their threat categories and implement measures for their conservation.
Methods
Description of the Study Area
The Cuban archipelago is located in the northwest end of the Caribbean basin, specifically between 74°08′03 ″(Punta de Quemado, Maisí) and 85°57′07″ (Cape of San Antonio) west longitude, and the 19°43′38″ (Punta del Inglés) and 23°17′09″ (Cruz del Padre Key) of north latitude [17]. The main island has about 107 466 km2 of extension, and its maximum width is 191 km between the north coast of Camagüey and the southeast portion of Granma.
The proximity of Cuba to the North American continent, its relatively little rugged terrain, its island status, and the amount of solar radiation that affects its surface, determine its moderate tropical climate [17]. The mean annual temperature values range from 24°C in the plains, to 26°C and more in the eastern coasts, with a decrease in the values of this variable of 0.6°C for every 100 m of ascent in the main mountainous systems of the country [18]. The element of greatest variability in the climate of Cuba is rainfall. In most of the territory, the year is divided into two seasonal periods: the rainy season, from May to October, where approximately 80 % of the total annual rainfall (1375 mm) is recorded; and the dry one, from November to April, with the remaining 20 % (344 mm). In the mountainous regions, the largest accumulated are recorded, with an increase of 150 – 170 mm for every 100 m of ascent in the west, and of 100 to 120 mm for every 100 m of ascent in the rest of the archipelago. From 400–500 m above sea level, these gradients decrease (Figure 1).
![Figure 1: Climate regions of Cuba. Modified from Díaz and Cádiz [19].](/fulltextimages/4478/fig_1.jpeg)
Obtaining Presence Data
For modeling the climatic niche, we compiled information from 3 698 localities with records of the presence of 46 endemic lizard species belonging to five genera included in the same amount of families (Table 1), from 239 different sources, including publications, management plans, data from Cuban (BIOECO, CZACC, MNHNCU) and foreign (AMNH, MCZ, USNM) zoological collections, personal communications and field data. The compilation of Rodríguez, et al. [22] was the main source of consultation. Each of these presence records was georeferenced in decimal coordinates according to the description of the sampling sites, for which cartographic sheets were used in the WGS84 projection, with a scale of 1:50 000. To reduce the effect of spatial autocorrelation in the presence data, all duplicate data was eliminated for each 1 km2 cell per species, as recommended by Phillips, et al. [23]. The whole process was carried out in the ArcMap 10.2 GIS program [24].
- Taxa localities
- Taxa localities
- Family Dactyloidae
- A. porcus
- 40
- Anolis ahli
- 16
- A. pumilus
- 52
- A. alayoni
- 33
- A. quadriocellifer
- 39
- A. allogus
- 221
- A. rubribarbus
- 28
- A. alutaceus
- 193
- A. smallwoodi
- 57
- A. argenteolus
- 158
- A. vanidicus
- 15
- A. argillaceus
- 86
- A. vermiculatus
- 52
- A. bartschi
- 25
- Family Xantusiidae
- A. bremeri
- 46
- Cricosaura typica
- 24
- A. centralis
- 33
- Family Diploglossidae
- A. chamaeleonides
- 69
- Diploglossus delasagra
- 64
- A. clivicola
- 15
- D. nigropunctatus
- 22
- A. cyanopleurus
- 34
- Family Leiocephalidae
- A. equestris
- 201
- Leiocephalus cubensis
- 202
- A. homolechis
- 405
- L. macropus
- 158
- A. inexpectatus
- 16
- L. raviceps
- 56
- A. isolepis
- 53
- L. stictigater
- 121
- A. jubar
- 138
- Family Sphaerodactylidae
- A. loysianus
- 62
- Sphaerodactylus celicara
- 20
- A. lucius
- 131
- S. intermedius
- 12
- A. luteogularis
- 92
- S. oliveri
- 11
- A. mestrei
- 35
- S. ramsdeni
- 21
- A. noblei
- 36
- S. ruibali
- 22
- A. ophiolepis
- 82
- S. scaber
- 22
- A. paternus
- 23
- S. torrei
- 22
- A. porcatus
- 435
- Total
- 3698
Table 1: List of Cuban endemic lizard species (Squamata: Sauria) whose climate niche was modeled and number of
During the modeling process, presence points are compared to random points within calibration areas (background), to detect the conditions under which a species can potentially live. With this in mind, 0.5 km equidistant random points were generated throughout the area occupied by the Cuban territory. In the case of pancuban species, this entire area was used for modeling their ecological niche, while only the Western, Central or Eastern region was used for species that had restricted distribution to those respective regions, to avoid increases in the rate of commission errors (i.e. false positives) [25, 26].
Obtaining the Environmental Data
The bioclimatic variables used in the processing were extracted from the WorldClim database [27] with a spatial
| Species | Variables | ||||
|---|---|---|---|---|---|
| Anolis ahli | BIO 6, BIO 11, BIO 1, BIO 5, BIO 13, BIO 10 | ||||
| A. alayoni | BIO 14, BIO 17, BIO 15, BIO 7, BIO 4 | ||||
| A. allogus | BIO 14, BIO 17, BIO 15, BIO 7, BIO 12 | ||||
| A. alutaceus | BIO 5, BIO 17, BIO 11, BIO 10, BIO 1 | ||||
| A. argenteolus | BIO 4, BIO 7, BIO 15, BIO 11, BIO 14 | ||||
| A. argillaceus | BIO 7, BIO 14, BIO 17, BIO 15, BIO 4 | ||||
| A. bartschi | BIO 4, BIO 17, BIO 14, BIO 5, BIO 11, BIO 12 | ||||
| A. bremeri | BIO 3, BIO 2, BIO 17, BIO 5, BIO 4, BIO 7 | ||||
| A. centralis | BIO 13, BIO 16, BIO 12, BIO 1, BIO 10, BIO 6 | ||||
| A. chamaeleonides | BIO 5, BIO 1, BIO 10, BIO 11, BIO 16 | ||||
| A. clivicola | BIO 4, BIO 10, BIO 5, BIO 1, BIO 6, BIO 11 | ||||
| A. cyanopleurus | BIO 14, BIO 17, BIO 7, BIO 15, BIO 4, BIO 5 | ||||
| A. equestris | BIO 4, BIO 3, BIO 5, BIO 17, BIO 15, BIO 14 | ||||
| A. homolechis | BIO 17, BIO 14, BIO 2, BIO 7, BIO 5 | ||||
| A. inexpectatus | BIO 15, BIO 17, BIO 14, BIO 12, BIO 7 | ||||
| A. isolepis | BIO 10, BIO 1, BIO 5, BIO 7, BIO 15, BIO 17 | ||||
| A. jubar | BIO 6, BIO 11, BIO 7, BIO 16, BIO 2, BIO 4 | ||||
| A. loysianus | BIO 5, BIO 17, BIO 10, BIO 14, BIO 1, BIO 6 | ||||
| A. lucius | BIO 7, BIO 4, BIO 3, BIO 2, BIO 17 | ||||
| A. luteogularis | BIO 17, BIO 5, BIO 3, BIO 2, BIO 4, BIO 14 | ||||
| A. mestrei | BIO 17, BIO 14, BIO 4, BIO 11, BIO 12, BIO 5 | ||||
| A. noblei | BIO 4, BIO 3, BIO 15, BIO 10, BIO 14 | ||||
| A. ophiolepis | BIO 14, BIO 17, BIO 15, BIO 7, BIO 12 | ||||
| A. paternus | BIO 3, BIO 2, BIO 7, BIO 17, BIO 4, BIO 13 | ||||
| A. porcatus | BIO 17, BIO 5, BIO 2, BIO 7, BIO 14, BIO 15 | ||||
| A. porcus | BIO 4, BIO 7, BIO 15, BIO 14, BIO 6, BIO 2 | ||||
| A. pumilus | BIO 3, BIO 4, BIO 5, BIO 17, BIO 2, BIO 14 | ||||
| A. quadriocellifer | BIO 6, BIO 7, BIO 4, BIO 11, BIO 2 | ||||
| A. rubribarbus | BIO 17, BIO 14, BIO 15, BIO 7, BIO 4, BIO 12 | ||||
| A. smallwoodi | BIO 4, BIO 7, BIO 11, BIO 14, BIO 15 | ||||
| A. vanidicus | BIO 6, BIO 11, BIO 1, BIO 5, BIO 10 | ||||
| A. vermiculatus | BIO 17, BIO 4, BIO 14, BIO 11, BIO 5, BIO 7 | ||||
| Cricosaura typica | BIO 4, BIO 16, BIO 7, BIO 12, BIO 3 | ||||
| Diploglossus delasagra | BIO 3, BIO 4, BIO 5, BIO 17, BIO 2, BIO 7 | ||||
| D. nigropunctatus | BIO 17, BIO 14, BIO 15, BIO 5, BIO 7 | ||||
| Leiocephalus cubensis | BIO 10, BIO 5, BIO 1, BIO 11, BIO 7, BIO 2 | ||||
| L. macropus | BIO 7, BIO 15, BIO 14, BIO 4, BIO 17, BIO 6 | ||||
| L. raviceps | BIO 4, BIO 7, BIO 6, BIO 11, BIO 2 | ||||
| L. stictigater | BIO 2, BIO 7, BIO 3, BIO 6, BIO 5, BIO 15 | ||||
| Sphaerodactylus celicara | BIO 14, BIO 17, BIO 15, BIO 7, BIO 2 | ||||
| S. intermedius | BIO 4, BIO 3, BIO 2, BIO 6, BIO 14 | ||||
| S. oliveri | BIO 14, BIO 15, BIO 2, BIO 7, BIO 5 | ||||
| S. ramsdeni | BIO 7, BIO 5, BIO 10, BIO 4, BIO 1 | ||||
| S. ruibali | BIO 6, BIO 11, BIO 4, BIO 12, BIO 16, BIO 7 | ||||
| S. scaber | BIO 3, BIO 4, BIO 14, BIO 17, BIO 11 | ||||
| S. torrei | BIO 4, BIO 11, BIO 6, BIO 16, BIO 3, BIO 12 |
Table 2: Bioclimatic variables used in the modeling of the climatic niche of 46 species of endemic lizards (Squamata: Sauria) of
To explore the potential effect of climate change on the distribution of the areas of climatic suitability (ACS), we used the bioclimatic variables generated by 10 Global Circulation Models (GCM) for the period of 2050 (interval 2041-2060) and 2070 (2061 -2080) with the same resolution as the variables for the present. The GCM used were: BCC-CM1.1, CCSM4, CNRM-CM5.1, GISS-E2-R, HadGEM-ES, IPSL-CM5A, MIROC5, MPI-ESM, MRI-CGCM3 and NorESM1-M. These models represent physical processes of the atmosphere, the ocean, the cryosphere and the earth's surface, and they are considered the most advanced tools available to simulate the response of the global climate system based on the emission and concentration of greenhouse gases [30]. The use of several GCM allows incorporating the variability produced by the different models [31]. For each one, two corresponding scenarios were used with the Representative Concentration Paths (RCP) 2.6 W/m2 (mitigation scenario) and 8.5 W/m2 (high emission values scenario), both representing the two extreme circumstances of the possible concentration in the atmosphere of greenhouse gases in the future [32]. In the mitigation scenario the greenhouse gases will have a maximum peak in 2040 and for the scenario of 8.5 W/m2 these gases will continue to increase until after 2100 [30].
Obtaining Current and Future Climate Suitability Models
The climate niche was modeled with the Maxent 3.3.3k program [28] that estimates the uniform distribution of the species based on presence-only records based on the principle of maximum entropy and their relationship with predictive variables. Maxent carries out a posterior transformation of the results in a logistic output with assumptions about the prevalence and sampling effort to get a better estimate of the suitability of the environment for the presence of the species rather than its probability of occurrence [28]. For the current work, we used the filtered presence records (Table 1) and the environmental variables that were selected based on the previous analysis (Table 2). As background, the same random points were used within the calibration areas generated in the previous process of evaluation of the variables.
For each of the species analyzed, the final models (current and those of future projections) were the average of 50 replicates. As training sample, 75 % of the presence data was used to generate the models and the remaining 25 % as test data to validate them. To obtain each model 500 iterations were performed and Bootstrap was used as a resampling method, which is very useful when there are not large sample sizes [33]. The rest of the parameters remained with their characteristics and recommended values by default [28]. Then the average outputs of the 50 replicates of the 10 GCM were averaged each other per year and per emission scenario, which resulted in a total of four projections per species.
For the creation of presence-absence outputs (binary), the minimum training presence threshold was used as the cut-off threshold, because it is the least restrictive. Peterson, et al. [34] suggest that Maxent generates better models at low threshold values, while raising them causes an over-adjustment to training data. Reclassification in binary maps was performed with the ArcGis ver program 10.1 [24].
Validation of Ecological Niche Models
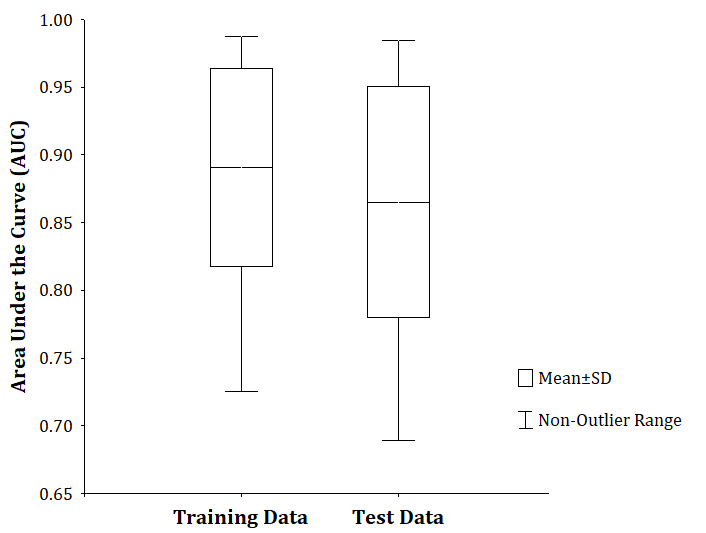
The effectiveness of the models was analyzed using the value of the AUC index (area under the curve) calculated from the ROC (Receiver Operating Characteristic) curve, which measures the ability of the model to discriminate between locations where the species is present or absent. To assess the predictive value of the models, the AUC of the training and test data was used and the two were compared to assess their differences [35]. For the classification of the models, we followed the criteria of Broennimann, et al. [36] who propose that models with AUC <0.7 must be considered as poor, between 0.7 ≤ AUC <0.9 as useful, and excellent those with AUC ≥ 0.9.
Data Analysis
The areas of climatic suitability (ACS) of the studied species were described, based on binary presence- absence maps and trend maps, both for the present and for future projections. To estimate the ACS the area of each of the pixels of presence of the species in the final models was added. The species were classified using the PPD (percentage of potential distribution), defined as _(_number of pixels of presence of the species × 100)/total number of pixels of Cuba, in: species with restricted distribution (0-30 %), species with intermediate distribution (31-59 %) and species with wide distribution (60-100 %).
Exposure to climate change at the species level was evaluated as the percentage of change in their ACS as: Vulnerability = 100 × (future area - current area) / current area; where current area represents the extension of the ACS in the current model and future area the ACS in the models projected in the climate change scenarios [37]. From these results, the possible threat status at present and in the future for each species was estimated, according to criterion A3(c) (projected reduction towards the future of the area of occupation) of the International Union for the Conservation of the Nature [74]. A direct relationship of the ACS with the extension of presence was assumed, so that the reduction of the ACS in the future could indicate a continuous reduction and fragmentation of the area of occupation of the species. For a loss ≥ 30 % the species were considered as Vulnerable, ≥ 50 % as Endangered, ≥ 80 % as Critically Endangered and = 100 % as Extinct. All statistical procedures were performed in the Past 2.17 program [38].
To explore changes in the patterns of current and future potential richness, the model stacking method was used [39]. This method consists of the sum of the binary models (presence-absence) of each individual species to generate raster maps where the value of each pixel corresponds to the species ACS richness. Exposure to climate change was estimated as: Percentage of extinction=100 × (future richness- current richness)/current richness; richness values were obtained using ArcGis ver. 10.1.
Results
Evaluation of the Models and Contribution of the Variables
The ecological niche models obtained for all species were significantly better than random predictions. The highest value of training AUC corresponded to Anolis quadriocellifer (0.9875), while the lowest was that of Leicephalus cubensis (0.7252), for a general average of 0.8909 (Figure 2). According to these values, the models of 24 species had excellent performance, and for the remaining 22 species, we obtained useful models, according to the classification proposed by Broenniman, et al. [40]. Test AUC values behaved in the same way as training. The differences between the training and test AUC values were between -0.0073 and 0.0691, which shows that the models were not over-adjusted to the data [41].
The contribution of the bioclimatic variables to the models varied among taxa, in line with their species – specific selection (Table 2) and with the differences between the presence records. In all cases, the variables derived from temperature were the ones with the greatest contribution, since they behave in a more homogeneous way in the sites that served to train the obtained models, given the climatic conditions of the country. The temperature annual range (BIO 7) and temperature seasonality (BIO 4), which were selected for their importance in the construction of the models in 30 and 29 of the 46 species, respectively (Table 2), were also the variables that reached the highest contribution percentages. They were followed by the precipitation of the driest quarter (BIO 17), the precipitation of the driest month (BIO 14) and the maximum temperature of the warmest month (BIO 5).
Areas of Climatic Suitability of the Cuban Endemic Lizards and Possible Future Changes
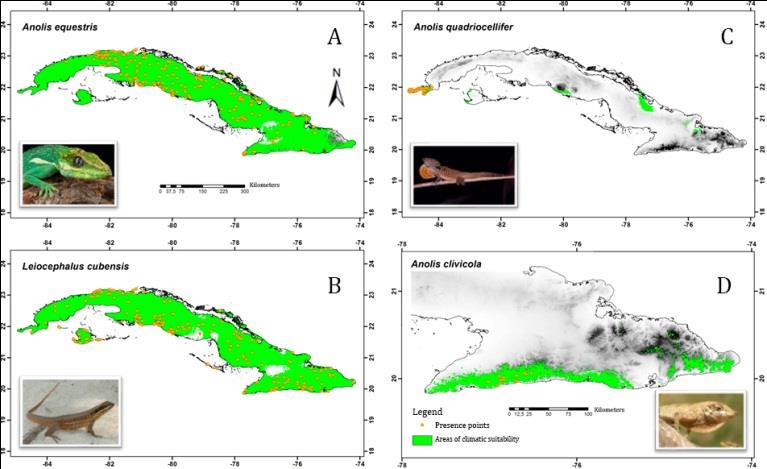
The current areas of climatic suitability (ACS) of the studied species coincide spatially with their presence records, and include other areas similar to those of training. The species with most restricted ACS were Anolis quadriocellifer (3 074 km2) and A. clivicola (3 726 km2), and those of greater extent were A. equestris (98 213 km2) and Leiocephalus cubensis (97 681 km2) ones (Figure 3). The current PPD values (percentage of potential distribution), showed that 56.5 % of the species presented restricted distribution, only 10.9 % had intermediate distribution, while the remaining 32.6% showed wide distribution.
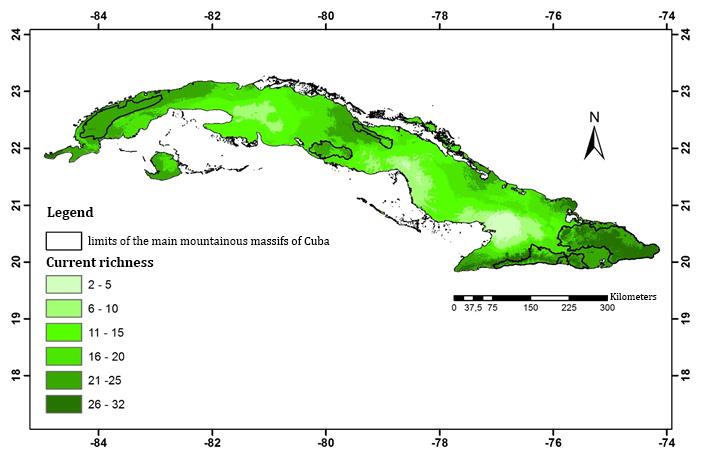
According to the climate niche models, in the Eastern region of the country lays the greatest concentration of Cuban lizards ACS (Figure 4). The entire Cuban archipelago has suitable climatic conditions for housing at least two species of this suborder, but never more than 32 species at a time. The areas of greatest suitability (26-32 species) are disjoint between and within regions, for a total area of 4 268.25 km2, which represents only 6.95 % of the national territory. The highest values of climatic suitability were obtained towards the most eastern end of Cuba and in the main mountainous massifs, principally in Sierra Maestra and Sierra de la Gran Piedra mountain ranges, and in Nipe-Sagua-Baracoa. They are followed in importance by other mountain systems such as Sierra de los Órganos, Sierra del Rosario, Alturas de Habana - Matanzas, Cordillera de Cubanacán, Sierra de Trinidad and Sierra de Sancti Spíritus, as well as the Guanahacabibes Peninsula in the West, much of the west and south of the Isla de la Juventud, Sabinal Key in the Center region, while in the East region of the country stands out the north coast of Holguin, and the Plateau of Cabo Cruz in the south (Figure 4).
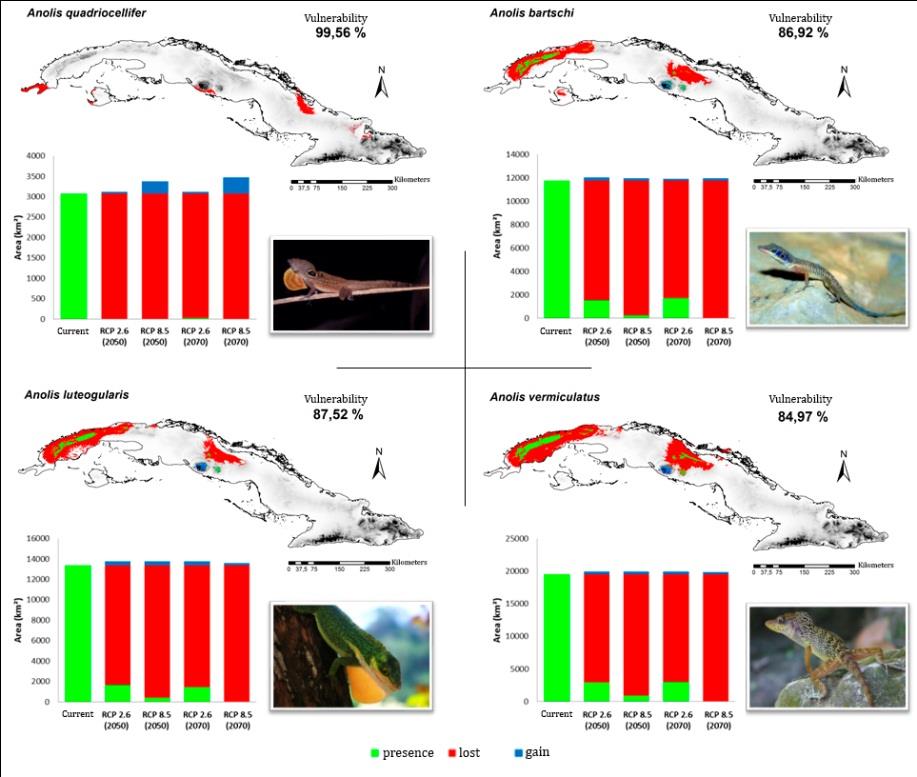
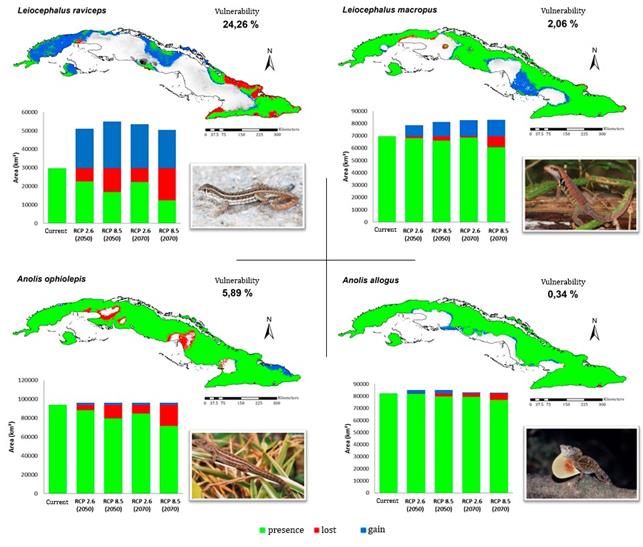
In all the species analyzed, the made projections indicate a decrease in the area corresponding to their climatic niches. In general, the most alarming scenario was RCP 8.5, in which there was a loss of more than 30 % of the current ACS and a greater probability of extinction in 39 of the species by 2070. When analyzing the possible loss of ACS in the future under a “null dispersion” approach, the most affected species would be Anolis quadriocellifer, A. mestrei, A. bartschi, A. luteogularis and A. vermiculatus, with a reduction close to or equal to 100 % for said projection (Figure 5). For the same approach, the climatic niches of A. allogus, Leiocephalus macropus and A. ophiolepis are predicted to suffer very little impact under any of the climate change scenarios (Figure 6). For the other hand, the ACS of L. raviceps (Figure 6) and Sphaerodactylus intermedius could even expand to more than 100 % of their current extent if their dispersal capacity would not be subject to restrictions (“full dispersion approach”).
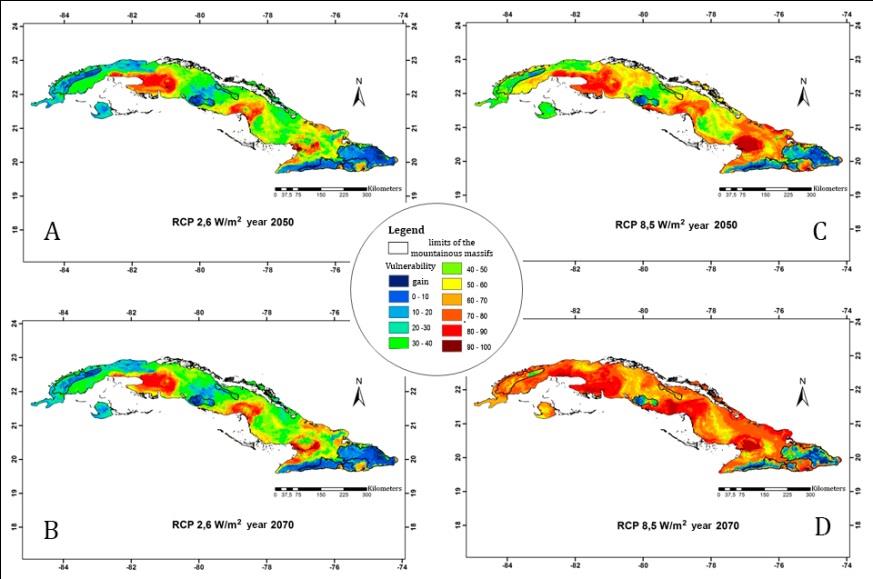
Although there are considerable differences between projections, the tendency in all future scenarios is to reduce the number of suitable areas for lizards (Figure 7). The Western and Central regions are the most affected (with more than 50 % loss of richness of ACS) in relation to the rest of the archipelago. The scenario RCP 8.5 is the most critical, especially for the year 2070, in which an even more drastic ACS loss is predicted (Figure 7D), and the area of greatest richness would be reduced to only 2791.5 km2. The scenario with the lowest exposure is the RCP 2.6, being its projection to 2070 in which the areas of greatest potential richness would not only be better preserved, but even could gain in extension (4 391.25 km2) (Figure 7B). In several regions, mainly in the plains and low coastal areas of the country, the climatic conditions for some of these species to exist in the future, could disappear completely. On the other hand, the higher ACS gain will tend to occur towards the main mountainous groups of western, central and eastern Cuba, which coincide with the areas of lowest losses too.
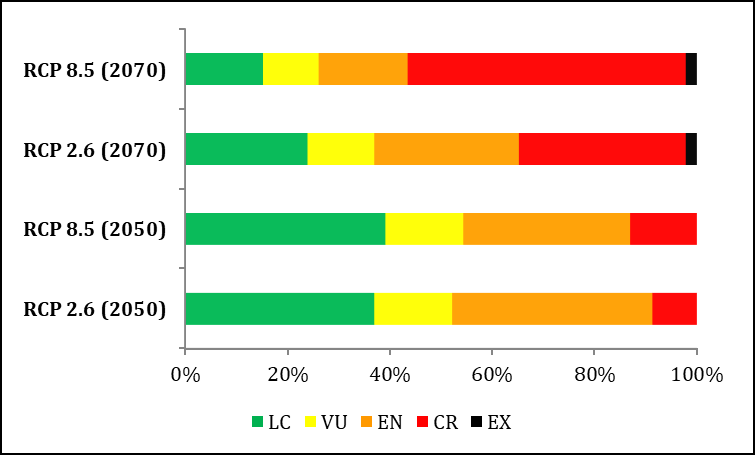
and / or years of study. It could be also predicted that, in the worst case scenario, more than 50 % of the species of Cuban lizards could be classified as CR by 2070, with A. bartschi, A. luteogularis and A. vermiculatus being the only species that could be placed under this category even taking into account the four future projections. In the case of A. quadriocellifer, it would reach the Extinct (EX) category by 2070 due to the loss of 100 % of its ACS, both for the scenario RCP 2.6 and for the RCP 8.5.
Discussion
Limitations
Current knowledge of the response of biodiversity to climate change is based on predictive models, so there is still great skepticism about the reliability of these forecasts and their application in conservation [42, 43]. In addition, biotic interactions could have an important effect at the local level, since the presence of preys, predators and competitors (both native and invasive) could radically transform the guilds and make it impossible to maintain the species despite the existence of adequate climatic environments [44]. The estimation of such factors is difficult and time consuming, so the ENM become an alternative conservative approach to predict changes in species distribution patterns due to climate change [42]. Although ENM are simplifications of the relationships between species and the environment, they allow us to determine how exposed they are to this phenomenon and assess their degree of vulnerability to the predicted conditions [43]. The development of more precise models seems to be the best strategy to improve the quality of the predictions and provide an appropriate response [37], mainly when the available biological knowledge about the species is scarce [45], as in the case of most of the Cuban members of suborder Sauria.
The distribution models of climatic niches are very dependent on the presence data of the modeled species [46]. One of the main limitations of the present study was the considerable variability in the quality of presence data by species (from 11 to 435). This was mainly due to the fact that each studied species has different ecological requirements and, therefore, different distribution areas, so in some cases they are present in small areas and have less data. Another cause could be poor field sampling, since many of these species have reserved behaviors, which imposes obstacles to the knowledge about their distribution and natural history. However, according to Groff, et al. [47], Maxent is capable of generating models with good quality even if the input data are scarce.
Another of the most common sources of uncertainty is related to the resolution of distribution data. In this work a fine spatial resolution was used (less than 1 km2), which should avoid underestimations related to the use of very thick resolutions e.g., 50 × 50 km [54], 10 × 10 km [48], which could exclude favorable locations for the persistence of the species in the future [49]. The resolution at which the maps were generated does not allow the study of microclimates, but it is sufficient for a study of the distribution of species at the country level [50].
Performance of Models and Bioclimatic Variables
The high values of AUC achieved show the good performance of the ENM obtained for all species, since the training values were above 0.7 in all cases, considered useful by Broennimann, et al. [36]. According to these authors, these values provide high reliability to the models obtained, as has been shown in similar studies [51]. The models generated for the specialist species tended to a greater predictive power with respect to those of the generalists, as it has been observed in other investigations, in which the precision of the model improves when the focal species has a small geographical range [47, 51]. In this study, small differences between both AUC (training and test) revealed that there was no over-adjustment in the results.
Another factor that may have also contributed to the lack of over-adjustment was the appropriate selection of the number of predictor variables (between five and six), resulting in transferable models, neither too simple nor too complex [41]. Considering that the objective of the current study required modeling the fundamental niche of the species [52, 53], no variables were used that could represent barriers to the occupation of other climate- appropriate sectors. Only climatic predictors were used, since it is not possible to project into the future with other types of variables due to the degree of complexity and uncertainty that would be expected to predict the response of biotic variables to climate change [54, 55]. However, it has been suggested that the exclusive use of climatic variables is not sufficient to identify the distribution of the species, since it is often strongly conditioned by geographical aspects [56]. The availability of perennial and annual plants, their density and richness, are key components of the realized niche of the species and, by transitivity, of their distribution. The topographical features, rainfall and temperatures, could then serve as analogs of these biotic resources, since they allow predicting soil moisture during periods of growth, which in turn conditions the characteristics of vegetation [57].
The fact that the variables derived from the temperature were the ones with the greatest contribution, was given by their more homogeneous behavior in the sites that served to train the models obtained, given the climatic conditions of our country. In this logic, the temperature annual range (BIO7) and the temperature seasonality (BIO 4) were the most important variables, followed in contribution by the precipitation of the driest quarter (BIO 17), the precipitation of the driest month (BIO 14) and the maximum temperature of the warmest month (BIO 5). According to other investigations in lizards of the genus Sphaerodactylus [13] and Diploglossus [58], BIO 7 is one of the variables with greatest contribution to the ENM of lizards species from the Eastern region of Cuba, which coincides with our results in 11 of the 15 eastern endemic species we included. This results could be related with the findings of Clusella-Trullas, et al. [59], which state that two of the fitness components of squamous ectotherms (mainly lizards and snakes), the maximum critical temperature and the optimum temperature, are more related to the variation in temperature and rainfall, respectively, than with the mean temperature conditions. For that reason, the variation in the temperature, whether in the diurnal or interannual range between the extreme values, is the biggest conditioning factor in the performance and, therefore, of the distribution of this zoological group, mainly under the conditions of the tropics.
Similarly, abundant rainfall and high cloudiness strongly affect the ability of these species to thermoregulate, so these variables are negatively related to the preferred body temperature of the species of humid regions; while in arid areas, dehydration and the scarcity of energy resources could result in a positive relationship [59]. This is corroborated by our current results, since the ENM of almost all the analyzed mesophilic species, which live in forests with cooler and less sunny environments, received a greater contribution of the variables related to rainfall than those of the xerophylic species.
Potential Distribution of the Climatic Niche of the Species of the Suborder Sauria In Cuba
The origin of the Cuban reptiles, the ways in which they arrived to our territory and the way they occupied the available habitats, are complex problems and not entirely clarified [60]. The characteristics of territoriality, low capacity for translation, and peculiar physiological requirements of this group, make it suitable as a model for zoogeographic studies. However, the lack of fossil evidence and the lack of ecological and phylogenetic studies on the Cuban herpetofauna, limit for the moment the analysis under the focus of historical biogeography [61].
The ENM of the lizards here analyzed predicted climate conditions in the localities where they currently live. Their great diversity in terms of biological and ecological characteristics is reflected in the potential distribution patterns of the ACS of these species. Twenty- six of them presented restricted ACS, which coincides with the classification in local (L) and regional (R) of Rodríguez, et al. [62]. The 15 species with ACS of wide distribution, included species considered pancubans (PC) and quasipancubans (CPC) as A. chamaeleonides, A. porcatus and A. homolechis; species categorized as PA (in isolated populations) such as A. loysianus, A. ophiolepis and A. paternus; and others considered as R (regionals) by these same authors, such as A. equestris, A. jubar and A. lucius, among others.
For all the species addressed, some regions appear far from the presence records with climatic conditions suitable for their establishment. The possible explanation of this phenomenon is that, at the scale in which the distributions of these species are being analyzed, the archipelago has a high climatic homogeneity in all its extension. However, the Eastern region is the least homogeneous, as it presents marked topographic differences that influence the diversity of the climate regime in the sector [20]. This is why we obtained fewer over-predictions for the species in this region. The fact that in all the studied species we obtained ACS greater than their actual distributions may be due to factors external to the models, such as their capacity for movement, historical constraints, inter-specific interactions, the presence of geographical barriers, and changes in land use [63]. However, this work supports the general trends of the group, so the results could be considered as a valid first approximation.
According to the ENM, the entire Cuban archipelago has climatic conditions suitable for housing at least two endemic lizard species; however, it should be bear in mind that the ENM predict areas that, on average, are climate-appropriate for the species, but not their real presence in those areas [36]. So, it is necessary to point out that the predicted overlap between climatic niches of these species does not necessarily imply areas of sympatry. The areas that predict the greatest richness of ACS appear disjoint throughout the country, and never overlap the climatic niches of more than 32 species at the same time. In the Eastern region, the greatest amount of ACS is concentrated mainly towards the Sierra de la Gran Piedra, the Sierra Maestra and the Sagua – Baracoa massif. It is followed in importance by both nucleus of the Guamuhaya massif, the Bamburanao massif and the Guaniguanico mountain range. Fong, et al. [64] recorded 36 endemic species of lizards in their checklist of Sagua- Baracoa Mountains. These results coincide mostly with the statements of Schwartz, et al. [65], who believe that the group's diversification center in Cuba is located in the Central - Eastern and Eastern regions, where more than half of the Cuban herpetofauna lives.
According to Rodríguez, et al. [60], the fact that areas that include mountainous and forested areas sustain a greater number of species, is a common pattern to all Cuban reptiles. The present study confirms the importance of these areas to maintain the diversity of endemic reptiles and their evolutionary processes. On the other hand, in the richness map generated from the ENM of the analyzed lizards, the Zapata Swamp, Guanahacabibes Peninsula and the smaller archipelagos are presented as areas with little number of ACS. In accordance with these results, Rodríguez, et al. [60] also pointed out that the peninsulas and keys have lower richness values, since they correspond to areas that, according to geological data, suffered periodic flooding and did not emerge fully until the end of the Quaternary, so which are less diverse from an ecological point of view.
Effect of Climate Change on the Distribution of Species of Suborder Sauria in Cuba
Even today there is a debate about how exactly populations will respond to climate change [66]. Unfortunately, most climate change models predict dire consequences for lizard populations [3, 4, 67]. The Cuban lizards constitute a group with different ecological requirements, life histories and distribution patterns, so different responses to climate change are to be expected. In all the species analyzed, the made projections indicate a decrease in the area corresponding to its climatic niche. In general, with the most alarming scenario (RCP 8.5) there was a loss of more than 30 % of the ACS and a greater probability of extinction in their current areas of occupation by 2070 in almost 85 % of the species.
When analyzing the potential loss of ACS in the future under a “null dispersion” approach, the most affected species would be A. luteogularis, A. bartschi, A. vermiculatus and A. quadriocellifer, with a reduction close to or equal to 100 % for said projection. Under the “full dispersion” approach, the models detect new ACS of small size, but geographically inaccessible to the four species. All these species have in common their restricted distribution to the west of the country and that they are mesophilics [16]. In relation to the latter, Huey, et al. [68] state that tropical lizards that live under the canopy within deeply shaded forests are the most vulnerable to climate change, since in these sites, with relatively cool and homogeneous ambient temperatures, lizards such as Anolis and Sphaerodactylus are generally thermoconformers, so they maintain their body temperature with values close to those of the air [69]. Faced with a slight increase in environment temperature, these lizards would have to take refuge, reducing the time they normally dedicate to foraging and reproduction, or they would have to deal with body temperatures above the optimal limit and close to the critical limit, causing them stress and less performance [4]. The results for A. vermiculatus are even more alarming if we take into account that this species is semiaquatic [16], so it strongly depends on fresh water availability a parameter that was not included in our analysis but that would further constrain its habitat requirements.
The highest proportion of new (gained) ACS in the future would be presented for L. raviceps, S. intermedius, S. torrei and S. ruibali. The geographical distributions of these species coincide with coastal areas of the west, center and east of the country. Gaston, et al. [70] predicted that the expansion of the areas of occupation of tropical ectotherms in response to climate change would be more pronounced for coastal species than for inland areas species. In the specific case of S. ruibali and S. torrei, although a great loss of their ACS is expected, some adjacent areas of greater height would be gained that the species could potentially colonize under the assumption of “full dispersion” if, as a consequence of climate change, the canopy will open at these sites, since these species are characteristic of xeric and open habitats [16]. The ability to invade these areas could also be limited by the interaction between both species, and / or by the presence of other species with similar ecological requirements, such as S. dimorphicus, S. nigropunctatus ocujal, S. schwartzi and S. siboney by the east, and S. armasi by the west.
It should be noted that most of the new ACS that would be won in the future for L. raviceps and S. intermedius, would be presented far from the coasts, which is the natural habitat of both species [16]. In addition, they would be separated from the current ones by large natural barriers, such as the Sierra Maestra mountain range for the first, and the Guaniguanico massif and the Gulf of Batabanó for the second. If a species is unable to migrate to an area due to the absence of suitable habitats or because that area is too far from the original population of that species, then the area in question is not available for the species and the most likely result would be local extinction (or excision). This means that, in the case of many of the species, the range contractions predicted by the current models could be sub-valuations.
The distribution of richness patterns, both in composition and spatial location, differs between the present and future scenarios. There are considerable differences between projections, but the tendency in all future scenarios is to reduce the most suitable areas for this group of ectotherms. Similar results have been observed for different groups of species in different latitudes [54]. The Western and Central regions are the most affected in relation to the rest of the archipelago, especially by the year 2070. The greatest gain will tend to occur towards greater heights, coinciding with the main mountain ranges of western, central and eastern Cuba, which also represent the most stable areas. These changes could result in reductions in population size and increased geographic isolation, or even in the extinction of restricted species. With general warming trends, and the extent to which dispersal capacity and resource availability permit, many species are expected to change their distributions to higher elevations [71]. Then, the higher regions could act as shelters against the conditions of climate change. However, the little dispersal capacity of these species and low landscape connectivity due to habitat transformation by anthropic activities could limit the colonization of available habitat patches.
Risk of Extinction Due to Climate Change
Because of the classification based on criterion A3 (c), it was obtained that Anolis quadriocellifer could be categorized as CR by 2050, and be extinguished (EX) by 2070 even with the mitigation scenario. This species has not been evaluated by the IUCN, and in the Red Book of Vertebrates of Cuba [15] is only considered as Near Threatened (NT) taking into account its limited geographical distribution to the Guanahacabibes Peninsula, the fragmentation and loss of habitat due to wood extraction, the inflow of tourism and the vulnerability of some of its localities to hurricanes and sea penetrations.
By 2070, 25 species of lizards could be included in the category CR according to the scenario RCP 8.5. Among them, A. bartschi, A. centralis, A. luteogularis, A. mestrei and A. vermiculatus were considered as CR also for the projection RCP 2.6 2070. Nine of the species analyzed have been included within some category of threat in the Red Book of Vertebrates of Cuba [15]: three of them within the category of EN (A. inexpectatus, S. intermedius and S. ruibali), six were proposed as VU (A. ahli, A. clivicola, A. rubribarbus, A. vanidicus, C. typica and S. oliveri), and two others (A. cyanopleurus and A. quadriocellifer) as NT. On the other hand, in the IUCN Red List [72], four of the species studied were classified as threatened, and three others were classified as LC (S. celicara, S. ramsdeni and S. scaber) [73]. The species S. intermedius, S. oliveri and S. ruibali are considered EN; and S. torrei is under the category of VU. In general, 34 species increase in category using the ENM for at least two projections, with respect to their current official classifications; for A. rubribarbus the classification is maintained; and with two other species (A. inexpectatus and C. typica) it is predicted a lower category [74, 75] (see Appendix 1).
Conclusion
The obtained models predict that the ACS for the 46 studied species of lizards will be reduced as a result of climate change. With the scenario RCP 8.5, the loss values exceed 30 % in most cases. By applying criterion A3(c), 34 species could be placed within a superior category for at least two of the projections. In the main mountain ranges of the country, the greatest gain and stability of ACS is expected, so these regions could act as climatic refuges in the face of climate change conditions for Cuban endemic lizards.
Acknowledgement
We wish to thank the anonymous referees for their review of the article and valuable suggestions.
Funding
This investigation was supported under the auspices of the project P211LH001-028 “Current and future potential distribution of species of flora and fauna of Cuba: exploring the effects of climate change on land biota”, and GEF-PNUD project "A landscape approach for the conservation of threatened mountainous ecosystems", by the Institute of Ecology and Systematics, Cuba.
References
-
IPCC (2014) Climate change 2014: impacts, adaptation, and vulnerability. Part A. Global and sectoral aspects. In: Field CB, Barros VR, Dokken DJ, Mach K J, Mastrandrea MD, Bilir TE, Chatterjee M,. Ebi KL, Estrada YO, Genova RC, Girma B, Kissel ES, Levy AN, MacCracken S, Mastrandrea PR, White LL, et al. (Eds.), Cambridge University Press, Cambridge 1: 1039-1101.
-
Li Y, Cohen JM, Rohr JR (2013) Review and synthesis of the effects of climate change on amphibians. Integr Zool 8(2): 145-161.
-
Thomas CD, Cameron A, Green RE, Bakkenes M, Beaumont LJ, et al. (2004) Extinction risk from climate change. Nature 427: 145-148.
-
Sinervo B, De La Cruz FM, Miles DF, Heulin B, Bastiaans E, et al. (2010) Erosion of lizard diversity by climate change and altered thermal niches. Science 328(5980): 894-899.
-
Bickford D, Howard SD, Ng DJJ, Sheridan JA (2010) Impacts of climate change on the amphibians and reptiles of Southeast Asia. Biodivers Conserv 19(4): 1043-1062.
-
Maes D N, Titeux J, Hortal A, Anselin K, Decleer GD, et al. (2010) Predicted insect diversity declines under climate change in an already impoverished region. J Insect Conserv 14(5): 485-498.
-
Harte J, Ostling A, Green JL, Kinzig A (2004) Biodiversity conservation: climate change and extinction risk. Nature 430(6995): 3-33.
-
Pacifici M (2015) Assessing species vulnerability to climate change. Nature Climate Change 5: 215-225.
-
CITMA (2014) V Informe Nacional al Convenio sobre la Diversidad Biológica de la República de Cuba. La Habana.
-
Planos Gutiérrez E, Rivero Vega R, Guevara Velazco V (2012) Impacto del cambio climático y medidas de adaptación en Cuba. Instituto de Meteorología, CITMA, La Habana pp: 430.
-
Rodríguez Schettino L, Rivalta V (2007) Efectos probables del aumento del nivel del mar sobre la herpetofauna de la Reserva de la Biosfera Ciénaga de Zapata, Matanzas, Cuba. Poeyana 495: 8-13.
-
Blanco P, Sánchez B (2008) Impacto del cambio climático sobre la avifauna cubana. Efecto de los cambios globales sobre la biodiversidad. In: Volpedo A, Fernández L, et al. (Eds.), Programa CYTED pp: 139-154.
-
Velazco K (2017) Valoración del efecto del cambio climático sobre la distribución de especies cubanas del género _Sphaerodactylus_ (Sauria: Sphaerodactylidae). Thesis in option of Master degree in Zoology and Animal Ecology. Havana University, Havana, Cuba pp: 136.
-
Torres J, Rodríguez Cabrera TM, Marrero R (2017) Reptiles. In: Mancina CA, Cruz DD, et al. (Eds.), Diversidad biológica de Cuba: métodos de inventario, monitoreo y colecciones biológicas, Editorial AMA, Havana, Cuba pp: 376-411.
-
González Alonso H, Rodríguez L, Rodríguez A, Mancina CA, Ramos García I (2012) Libro Rojo de los Vertebrados de Cuba. Editorial Academia pp: 304.
-
Henderson RW, Powell R (2009) Natural History of West Indian Reptiles and Amphibians. University Press of Florida, Gainesville, Florida pp: 487.
-
Gutiérrez RD, Rivero M (1997) Minigeography of Cuba. Scientific-Technical Editorial, Havana, Cuba pp: 142.
-
Díaz LR (1989) Nuevo Atlas Nacional de Cuba. In: Gutiérrez GO, Sánchez EA, Hernández JR, Propin E, Díaz LR, Rojo EL, Lorenzo AC, Mon M, Azcue A, Véliz A, Arévalo A, García A, Aranaz F, Rodríguez J, López JM, et al. (Eds.), Instituto Cubano de la Academia de ciencias de Cuba pp: 24.
-
Díaz LM, Cádiz A (2007) Guía taxonómica de los anfibios de Cuba. Abc Taxa 4: 1-294.
-
Mateo J, Acevedo M (1989) Regionalización físico- geográfica. In: Oliva G, Lluís E, Sánchez EA, et al. (Eds.), Nuevo Atlas Nacional de Cuba. Academia de Ciencias de Cuba. Instituto Cubano de Geodesia y Cartografía, Instituto Geográfico Nacional de España. Madrid, España pp: 12.
-
Capote RP, Berazaín R (1984) Clasificación de las formaciones vegetales de Cuba. Revista del Jardín Botánico Nacional 5(2): 27-75.
-
Rodríguez L, Mancina CA, Rivalta V (2013) Reptiles of Cuba: checklist and geographic distributions. Smithsonian Herpetological Information Service 144: 1-96.
-
Phillips SJ, Dudík M, Schapire RE (2004) A Maximum Entropy Approach to Species Distribution Modeling. Appearing in Proceedings of the 21st International Conference on Machine Learning pp: 655-662.
-
ESRI (2011) ArcGIS Desktop: Release 10. CA: Environmental Systems Research Institute, Redlands.
-
Anderson RP, Raza A (2010) The effect of the extent of the study region on GIS models of species geographic distributions and estimates of niche evolution: preliminary tests with montane rodents (genus Nephelomys) in Venezuela. Journal of Biogeography 37: 1378-1393.
-
Barve N, Barve V, Jiménez Valverde A, Lira Noriega A, Maher SP, et al. (2011) The crucial role of the accesible area in ecological niche modeling and species distribution modeling. Ecological Modelling 222(11): 1810-1819.
-
Hijmans RJ, Cameron SE, Parra JL, Jones PG, Jarvis A (2005) Very high resolution interpolated climate surfaces for global land areas. International Journal of Climatology 25(15): 1965-1978.
-
Phillips SJ, Anderson RP, Schapire RE (2006) Maximum entropy modeling of species geographic distributions. Ecol Model 190(3-4): 231-259.
-
StatSoft Inc (2007) Statistica Features Overview.
-
IPCC (2013) Resumen para responsables de políticas. In: Stocker TF, Qin D, Plattner GK, Tignor M, Allen SK, Boschung J, Nauels A, Xia Y, Bex V, Midgley PM, et al. (Eds.), Cambio Climático 2013: Bases físicas. Contribución del Grupo de trabajo I al Quinto Informe de Evaluación del Grupo Intergubernamental de Expertos sobre el Cambio Climático.Cambridge University Press, Cambridge, Reino Unido y Nueva York, NY, Estados Unidos de América pp:1-27.
-
Varela S, Lima Ribeiro MS, Terribile LC (2015) A Short Guide to the Climatic Variables of the Last Glacial Maximum for Biogeographers. PlosOne 10: e0129037.
-
Moss RH, Edmonds JA, Hibbard KA, Manning MR, Rose SK, et al. (2010) The next generation of scenarios for climate change research and assessment. Nature 463: 747-756.
-
Hardle W, Simar L (2007) Applied Multivariate Statistical Analysis. Springer Berlin Heidelberg New York.
-
Peterson AT, Papes M, Eaton M (2007) Transferability and model evaluation in ecological niche modeling: a comparison of GARP and Maxent. Ecography 30(4): 550-560.
-
Lobo JM, Jiménez Valverde A, Real R (2008) AUC: a misleading measure of the performance of predictive distribution models. Global Ecol Biogeogr 17: 145- 151.
-
Broennimann O, Thuiller W, Hughes G, Midgley GF, Alkemades JMR, et al. (2006) Do geographic distribution, niche property and life form explain plants’ vulnerability to global change?. Global Change Biol 12(6): 1079-1093.
-
Thuiller W, Lavorel S, Araujo MB, Sykes MT, Prentice IC (2005) Climate change threats to plant diversity in Europe. Proc Natl Acad Sci USA 102(23): 8245-8250.
-
Hammer O, Harper DAT, Ryan PD (2001) Past: Paleontological Statistics Software Package For Education and Data Analysis. Paleontologia Electronica 4 (1): 9.
-
Dubuis A, Pottier J, Rion V, Pellissier L, Theurillat JP, et al. (2011) Predicting spatial patterns of plant species richness: a comparison of direct macroecological and species stacking modelling approaches. Diversity and Distributions 17(6): 1122- 1131.
-
Broennimann O, Treier UA, Müller Schärer H, Thuiller W, Peterson AT, et al. (2007) Evidence of climatic niche shift during biological invasion. Ecology Letters 10(8): 701-709.
-
Warren DL, Seifert SN (2011) Ecological niche modeling in Maxent: the importance of model complexity and the performance of model selection criteria. Ecol Appl 21(2): 335-342.
-
Wiens JA, Stralberg D, Jongsomjit D, Howell CA, Snyder MA (2009) Niches, models, and climate change: assessing the assumptions and uncertainties. Proc Natl Acad Sci USA 106(S2): 19729-19736.
-
Dawson TP, Jackson ST, House JI, Prentice IC, Mace GM, et al. (2011) Beyond predictions: Biodiversity conservation in a changing climate. Science 332(6025): 53-58.
-
Kissling WD, Dormann CF, Groeneveld J, Hickler T, Kühn I, et al. (2012) Towards novel approaches to modelling biotic interactions in multispecies assemblages at large spatial extents. J Biogeogr 39(12): 2163-2178.
-
Nava SS, Lindsay CR, Henderson RW, Powell R (2001) Microhabitat, activity, and density of a dwarf gecko (_Sphaerodactylus parvus_) on Anguilla, West Indies. Amphibia Reptilia 22: 455-464.
-
Anderson RP (2015) Modeling niches and distributions: it’s not just “click, click, click”. Biogeografía 8: 4-27.
-
Groff LA, Marks SB, Hayes MP (2014) Using Ecological Niche Models to Direct Rare Amphibian Surveys: A Case Study Using Oregon Spotted Frog (_Rana_ _pretiosa_). Herpetological Conservation and Biology 9(2): 354-368.
-
Carvalho SB, Brito JC, Crespo EJ, Possingham HP (2010) From climate change predictions to actions- conserving vulnerable animal groups in hotspots at a regional scale. Global Change Biology 16(12): 3257- 3270.
-
Martínez Freiría F, Argaz H, Fahd S, Brito JC (2013) Climate change is predicted to negatively influence Moroccan endemic reptile richness. Implications for conservation in protected areas. Naturwissenschaften 100(9): 877-889.
-
Pearson RG, Dawson JW (2003) Predecing the impacts of climate change on the distribution of species: are bioclimate envelope models useful?. Global Ecology and Biogeography 12(5): 361-371.
-
Elith J, Leathwick JR (2009) Species distribution models: ecological explanation and prediction across space and time. Annu Rev Ecol Evol Syst 40: 677-697.
-
Guisan A, Petitpierre B, Broennimann O, Daehler C, Kueffer C (2014) Unifying niche shift studies: insights from biological invasions. Trends Ecol Evol 29(5): 260-269.
-
Strubbe D, Beauchar O, Matthysen E (2015) Niche conservatism among non-native vertebrates in Europe and North America. Ecography 38(3): 321- 329.
-
Araújo MB, Thuiller W, Pearson RG (2006) Climate warming and the decline of amphibians and reptiles in Europe. J Biogeogr 33(10): 1712-1728.
-
Zank C, Gertum A, Michelle A, Baldo D, Maneyro R, et al. (2014) Climate change and the distribution of Neotropical Red-Bellied Toad (_Melanophryniscus_, Anura, Amphibia): How to prioritize the species and populatios?. PLoS ONE 9: e94625.
-
Austin M, Van Niel KP (2010) Improving species distribution models for climate change studies: variable selection and scale. Journal of Biogeography 38(1): 1-8.
-
Barrows CW (2011) Sensitivity to climate change for two reptiles at the Mojavee-Sonoran Desert interface. Journal of Arid Environments 75(7): 629-635.
-
Velazco Pérez K, Estrada Piñero FN (2019) Analysis and Comparison of the Ecological Niche of Two Endemic Species of the Genus _Diploglossus_ (Sauria: Diploglossidae). Int J Zoo Animal Biol 2(5): 000157.
-
Clusella Trullas S, Blackburn TM, Chown SL (2011) Climatic predictors of temperature performance curve parameters in ectotherms imply complex responses to climate change. Am Nat 177(6): 738- 751.
-
Rodríguez L (1993) Áreas faunísticas de Cuba según la distribución ecogeográfica actual y el endemismo de los reptiles. Poeyana 436: 1-17.
-
Rodríguez L (1986) Algunos patrones distribucionales y ecológicos de los reptiles cubanos. Poeyana 305: 1-15.
-
Rodríguez L, Rivalta V (2003) List of species. In: Rodríguez Schettino L, et al. (Eds.), Anfibios y Reptiles de Cuba. UPC Print, Vaasa, Finlandia pp: 162-165.
-
Urban MC, Zarnetske PL, Skelly DK (2013) Moving forward: dispersal and species interactions determine biotic responses to climate change. Ann NY Acad Sci 1297: 44-60.
-
Fong A, Navarro N (2001) Checklist of amphibians and reptiles of the Sagua-Baracoa mountains, Eastern Cuba. Smithsonian Herpetological information service 130: 1-15.
-
Schwartz A, Henderson RW (1991) Amphibians and Reptiles of the West Indies: Descriptions, Distributions, and Natural History. University Press of Florida, Gainesville, Florida pp: 720.
-
Walters RJ, Blanckenhorn WU, Berger D (2012) Forecasting extinction risk of ectotherms under climate warming: an evolutionary perspective. Funct Ecol 26(6): 1324-1338.
-
Huey RB, Losos JB, Moritz C (2010) Are lizards toast?. Science 328(5980): 832-833.
-
Huey RB, Deutsch CA, Tewksbury JJ, Vitt LJ, Hertz PE, et al. (2009) Why tropical forest lizards are vulnerable to climate warming. Proceedings of the Royal Society of Biological Sciences 276(1664): 1939- 1948.
-
Brusch GA, Taylor EN, Whitfield SM (2016) Turn up the heat: thermal tolerances of lizards at La Selva, Costa Rica. Oecologia 180(2): 325-334.
-
Gaston KJ, Chown SL (1999) Exploring links between physiology and ecology at macro-scales: the role of respiratory metabolism in insects. Biol Rev 74(1): 87- 120.
-
Kannan R, James DA (2009) Effects of climate change on global biodiversity: a review of key literature. Tropical Ecology 50(1): 31-39.
-
IUCN (2017) The IUCN Red List of Threatened Species.
-
Thuiller W (2007) Climate change and the ecologist. Nature pp: 448-550.
-
IUCN (2012) Categories and Criteria of the IUCN Red List.
-
Elith J, Graham CH, Anderson RP, Dudyk M, Freer S, et al. (2006) Novel methods improve prediction of species’ distributions from occurrence data. Ecography 29: 129-151.
- Mitochondrial Bio-Logistics: Steering Co-Enzyme Q10 and Lycopene Synergies within the Science 4.0 Bio-OS Framework
- Hymenoptera Specimens from the Caño Negro Wetland, of the National Museum Collection, Costa Rica
- Science 4.0: Comprehensive Architecture of the Biological Operating System (Bio-OS) A Framework for Systemic Resilience and Industrialized Bio-Governance
- Rabbit on, or Hare Back? Understanding Climate Change
- Clinical Validation of Science 4.0: Flow Steering and Epigenetic Drift Inversion on a 76-Year-Old Hybrid System
- Seeds Planted by another Mind