Studies On the Physico-Chemical Parameters of Bore Well, Well, Pond and Tap Waters in Kambarajapuram Village of Vellore District, Tamil Nadu (India)
Present study was aimed to see the water quality of pond water, well water, bore well water and tap water of Kambarajapuram village, Thiruvalam, Vellore district. Water samples for the present study collected in Kambarajapuram village were analyzed for physical parameters such as Appearance, Odour, Turbidity, Total Dissolved Solids (TDS) and Electrical conductivity mic mho/cm and chemical parameters such as pH, Alkalinity, Total hardness, Mg, Fe, Na, K, Mn, NH3, NO2, NO3, Cl, F, So4, PO4 and Tidy’s test content using standard methods as given by APHA and their results are depicted in table 1. The acceptable limit mentioned in the text represents the standard for drinking water quality according to WHO. Among these four water samples compared, the TDS and electrical conductivity contents were seemed to be lower in pond water as 481 and 687 and in tap waters as 382 and 545 than other two waters of well water as 1128 and 1611 and bore well water as 1062 and 1517, respectively. Other parameters were found to be fluctuated. Result of the study indicated that pond and tap waters were seemed to be suitable for potable purpose. It is concluded from this study that the fluctuation of physico-chemical variations in all the four waters of Kambarajapuram village in Thiruvalam area showed suitable for irrigation and drinking purpose. In the present study, low level of fluoride content in a range of 0.02-0.04 showed harmful effect for dental caries and its related effects as reported by many investigators.
Introduction
India is a vast country, where a large number of people live in villages. A large number of villages and cities still do not have adequate and safe drinking water. In order to essential needs of the people, water comes at the second position of air. During the last decade, it has been realized that the time has come to pay more and more attention to the ground water resources and their adequate management by utilizing modern technique [1]. Numerous anthropogenic activities like disposal of sewage and industrial water, recreational activities, excessive usage of fertilizers to land and use pesticides have threatened environmental health of both surface and ground water. Water pollution has however, threatened to reduce the quantity available in ponds, lakes, rivers and reservoirs due to other human activities [2]. Roa, et al. [3] reported that due to increasing industrialization, urbanization and other developmental activities most of our water bodies such as ponds, lakes, streams and rivers have become polluted. Environmental effects of chromium (Cr)
have been extensively reviewed [4, 5, 6, 7, 8, 9, 10, 11, 12].
Tamil Nadu is situated at the South Eastern Extremity of the Indian peninsula and it is the southernmost state of mainland India. It is located between 8°05 and 13°34 at North Latitude, 76014’ and 8021’ at East Longitude, Andhra Pradesh in the north, Karnataka in the North-West, Kerala on the West, Bay of Bengal in the east. Vellore district has become not only the hub of educational institution and also for the tannery industry, chemical industry, sugar mills etc., Vellore water is in an alarming condition as it has been receiving domestic and industrial wastes. Collection place of Thiruvalam is a Town panchayat coming under the administrative territory of Vellore District. The Town Panchayat is Located at a distance of 13 Km from Vellore Corporation on the west side. On the East of 10 Km from Ranipet Municipality. On the North Vallimalai 8 km and South of Rathinagari 6 km. The present study is centered on the water quality assessment in well, bore, pond and lake waters of Arcot town and its surrounded area of Vellore District due to the water bodies located at Kamarajapuram village of Thiruvalam is suspected to be polluted by tannery industries around this village.
Materials and Methods
Description of the Study Area
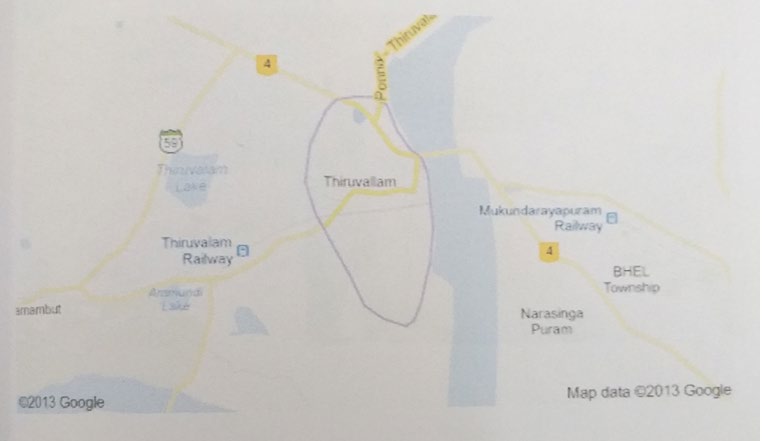
The sampling area of Kambarajapuram village of Thiruvalam (Figure 1) is located in 12.9725 Latitude and 79.1984 Longitude and 25 km away from Vellore city and just 4 km away from the Sipcot tannery industrial area. The Sipcot area is surrounded with 240 tannery industries along with ceramic, refractory, boiler auxiliaries and chromium chemicals, etc.
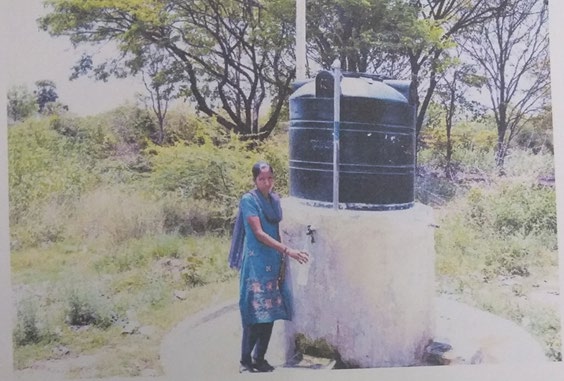
Water samples for the present study were collected from the tap, well, bore well (Figure 2) and pond waters. Since this area is located nearby to Sipcot tannery industrial area, the effects of tannery effluents in the water body are suspected to be more. The bore well water is not being utilized for drinking purpose since the color of water is found to be in yellow. But, it is utilized only for irrigation purpose. Tap water is being utilized for drinking purpose as this water comes down from Ponnai River through pipe line to this village. Well water collected for the present study is not being utilized for drinking purpose, but, it is utilized for irrigation purpose. Since the pond contains lesser quantity of water, it is not being utilized for any other purposes. However, it is so important to analyze the water quality of these four water bodies suitable for drinking and irrigation purposes. Water samples collected for the period three months from January to March , 2016 using each 1 liter of polyethylene bottle from these areas were subjected for the analysis of physical parameters such as Appearance, Odor, Turbidity, Total Dissolved Solids (TDS) and Electrical conductivity mic mho/ cm and chemical parameters such as pH, Alkalinity, Total hardness, Mg, Fe, Na, K, Mn, NH3, NO2, NO3, Cl, F, So4, PO4 and Tidy’s test content using standard methods as given by APHA [13] and their results are depicted in Table 1. Unit for each parameter is represented as mg/l except few parameters as given in the table.
Results and Discussion
In the present study, water samples collected from well water, bore well water, tap water and pond waters in Kambarajapuram village of Thiruvalam area of Vellore District were analyzed for physical parameters such as Appearance, Odour, Turbidity, Total Dissolved Solids (TDS) and Electrical conductivity mic mho/cm and chemical parameters such as pH, Alkalinity, Total hardness, Mg, Fe, Na, K, Mn, NH3, NO2, NO3, Cl, F, So4, PO4 and Tidy’s test content using standard methods as given by APHA [13] and their results are depicted in table 1. The acceptable limit mentioned in the text represents the standard for drinking water quality according to WHO [14].
Appearance of water samples collected from
Kambarajapuram village (well water, bore well water, tap water and pond waters) is clear and colorless. Odor or appearance may result from the presence of natural metallic ions like Iron and Manganese, human and peat material, plankton, Weeds and Industrial waste. Color is usually the first contaminant to be recognized in waste waters that affects the aesthetics, water transparency and gas solubility of water bodies [15]. In the present study, odor was none in Kambarajapuram
| S. No. | Parameters | Acceptable Limit WHO (1984) | Kambarajapuram (Bore well water) | Kambarajapuram (Pond) | Kambarajapuram (well water) | Kambarajapuram (Tap water) | |
|---|---|---|---|---|---|---|---|
| PHYSICAL EXAMINATIONS | |||||||
| 1 | Appearance | A | B | C & C | C & C | C & C | C & C |
| 2 | Odour | Unobjectionable | |||||
| 3 | Turbidity NTU | 1 | 10 | 0 | 0 | 2±03 | 0 |
| 4 | Total Dissolved Solids mg/l | 500 | 2000 | 1062±4.0 | 481±2.0 | 1128±5.0 | 382±09 |
| 5 | Electrical Conductivity (Mic mho/cm) | - | - | 1517±5.0 | 687±4.0 | 1611±4.0 | 545±6.0 |
| CHEMICAL EXAMINATIONS | |||||||
| 6 | pH | 6.5-8.5 | 6.5-9.2 | 7.15±0.15 | 7.44±0.50 | 7.08±0.1 | 7.44±0.5 |
| 7 | Alkalintiy pH as CaCO mg/l 3 | - | - | 0 | 0 | 0 | 0 |
| 8 | Alkalintiy Total as CaCO mg/l 3 | 200 | 600 | 244±3.0 | 208±4.0 | 348±4.0 | 172±5.0 |
| 9 | Total Hardness as CaCO mg/l 3 | 200 | 600 | 544±3.5 | 224±2.0 | 352±2.0 | 186±1.0 |
| 10 | Calcium as Ca mg/l | 75 | 200 | 184±2.5 | 65±0.9 | 101±2.7 | 54±1.0 |
| 11 | Magnesium as Mg mg/l | 30 | 150 | 20±1.0 | 15±1.0 | 24±1.5 | 12±05 |
| 12 | Sodium as Na | - | - | - | - | - | - |
| 13 | Potassium as K | - | - | - | - | - | - |
| 14 | Iron Total as Fe mg/l | 0.1 | 1 | 0 | 0.47±05 | 0 | 0 |
| 15 | Manganese as Mn | 30 | 150 | 0 | 0 | 0 | 0 |
| 16 | Free ammonia as NH mg/l 3 | - | - | 0 | 0.40±00 | 0 | 0 |
| 17 | Nitrite as NO 2 mg/l | - | - | 0 | 0.04±00 | 0 | 0 |
| 18 | Nitrate as NO 3 mg/l | 45 | 100 | 39±1.5 | 20±2.0 | 20±2.5 | 17±1.0 |
| 19 | Chloride as Cl mg/l | 200 | 1000 | 266±4.0 | 58±1.5 | 260±1.5 | 60±0.5 |
| 20 | Fluoride as F mg/l | 1 | 1.5 | 0.4±00 | 0.2±00 | 0.4±00 | 0.4±00 |
| 21 | Sulphate as SO 4 mg/l | 200 | 400 | 176±1.6 | 67±2.0 | 147±2.1 | 28±2.5 |
| 22 | Phosphate as PO 4 mg/l | - | - | 0 | 0.35±05 | 0 | 0 |
| 23 | Tidy’s Test | - | - | 0.1±00 | 0.3±00 | 0.1±00 | 0.1±00 |
| 24 | RC | - | 0.2 | -- | - | - | - |
| 25 | BACTERIOLOGICAL EXAMINATION (M.F Technique) | - | - | - | - | ||
| 26 | Fecal Coliform (100M) | 0 | 0 | -- | - | - | - |
Table 1: Result of Physico-Chemical parameters of the bore, pond, well and tap waters collected from Kambrajapuram village of
Note:
- A CPHEEO Std – Desirable Limit: B.CPHEEO/BIS Std – Permissible limit in the absence of alternative source.
- Results of Chemical Examination expressed in mg/l except pH.
- C & C – Clear & Colorless. Table 1: Result of Physico-Chemical parameters of the bore, pond, well and tap waters collected from Kambrajapuram village of Thiruvalam, Vellore District, Tamilnadu.
Bore well water, well water, pond water and tap water. When the odour is objectionable it indicates that the water has become deteriorated. Turbidity of bore well water, pond water and tap water was 0 and the turbidity of well water was 2. However, the turbidity level was found within the acceptable limit (30. Increase of turbidity content in the water may cause lack of productivity, reduction of O2 and increase of CO2 and thereby reduction of biomass including fish and other aquatic organisms will occur [16].
Total Dissolved Solids (TDS) content was found to be 1128 in well water, 382 in tap water, and 1062 in bore well water and 481 in pond water of Kambarajapuram village of Thiruvalam area of Vellore district. TDS contents were found to be within the acceptable limit in all the water samples. Total dissolved solids is one of the important measures of water quality. Waters with high solid content are of inferior palatability and may induce an unfavorable physiological reaction in the transient consumer. The desirable limit of TDS is 500 [14]. Hike of TDS values may cause harmful effects for the purpose of the Agriculture and drinking and this may be due to the release of tannery effluent discharge into the land area with uncontrolled levels.
For most of the natural waters, the main contributors for total dissolved solids are calcium, Magnesium, Sodium, Potassium, Chloride, Sulphates and bicarbonates. TDS reflect the increasing extent of industrial and domestic discharge in aquatic habitats [17]. High levels of TDS in the effluent render it unsuitable for irrigation and drinking purpose. According to Manivasakam, et al. [18] high amount of TDS recorded in tannery effluent could be attributed to processes like soaking, liming, dehairing, defleshing and deliming. Electrical conductivity content was found to be around 1611 in well water, 545 in tap water, 1517 in bore well water and 687 in pond water of Kambarajapuram village. Among these four waters compared the electrical conductivity content was found to be high only at well water of Kambarajapuram village.
Electrical conductivity is a useful tool to evaluate the purity of water. It is the property of water caused by the presence of various ionic species. The acceptable limit of Electrical Conductivity is 600 [14]. It is significantly noticed that the Electrical Conductivity content was likely to be increased only in the lake water carrying the sludge of tannery effluent discharge. High level of conductivity may be due to the presence of inorganic substances and salts which show good conductivity [19]. The electrical conductivity is a useful parameter of water quality for indicating salinity hazards. Among the physical parameters of the waters compared in four different water bodies like bore well water, well water, pond water and tap water of Kambarajapuram village, their levels were found to be within the desirable limit as prescribed by WHO [14] and it is indicated that the waters have no harmful effects due to the presence of these parameters and thus, this water is found suitable for drinking and irrigation purposes. It is suggested that these water bodies should be kept in a sustainable manner from free of intrusion of industrial waste into the water bodies by direct or indirect means.
The pH value of water is an important indication of its quality and it is dependent on the carbon dioxide, carbonate and bicarbonate equilibrium. PH of the present study was ranged between 7.08-7.44 in well water, tap water, bore well water and pond water. The result of pH showed that there is no harmful effect due to its presence varied between 7.08- 8.44. The discharge of waste water into water bodies may cause a drop or increase their pH affecting size and activities of microbial populations therein. Other workers also reported acidic [20, 21, 22] and alkaline tannery waste waters [23, 24, 25, 26].
The factors like photosynthesis, exposure to air, disposal of industrial wastes and domestic sewage affect pH [27]. WHO [14] prescribed beyond pH 8.5, the water can affect the mucous membrane. Discharge of untreated effluents with a low pH into ponds, rivers or on lands for any purpose may be detrimental to soil fauna and aquatic biota such as zooplankton and fishes, since low pH level may affect the physiology of fishes. Alkalinity is a total measure of the substances in water that have acid neutralizing ability. Total alkalinity was found to be 348 in well water, 272 in tap water, 244 in bore well water and 208 in pond waters of Kambarajapuram village of Thiruvalam area and these levels were found to be within permissible limit for drinking purpose.
Alkalinity is important for fish and aquatic life because it protects or buffers against pH changes (keep the pH fairly constant) and makes water less vulnerable to acid rain. High alkalinity values are indicative of the eutrophic nature of the water body. Total alkalinity values of water are important in calculating the dose of alum and biocides in water [2]. Hardness is advantageous in certain conditions. It prevents the corrosion in the pipes by forming a thin layer of scales and reduces the entry of heavy metals from the pipes to the water [28]. The hardness of water is an important consideration in determining the suitability of water for domestic and industrial uses. Hard water will precipitate soap and lathering does not take place satisfactory.
As revealed by many investigators, the presence of bicarbonates of calcium and magnesium indicate temporary hardness, which can be removed by boiling. Hard water is generally believed to have no harmful effect on human being. Cardiovascular diseases were reported to continue more to the areas of soft waters than to those having hard water [29]. Maximum value of hardness is observed in winter and minimum in summer [30]. Vijayaram, et al. [31] found that the concentrations of total hardness, chlorides, calcium, magnesium and sulphates were 2 to 20 times higher in the ground water of Thiruchirapalli city, Tamil Nadu due to the presence of tanneries.
Total hardness content was 352 in well water, 544 in bore well water, 244 in pond water and these values were found to be within permissible limit except the values of 186 noticed in tap water below the desirable limit. The results indicated that there is no harmful effect due to its content present in the water. Calcium is most important cation in the study of water quality. Hardness of water as calcium carbonate is an important measure of pollution. Calcium is one of the nutrients required by the organism and at low concentration calcium has no hazardous effect on human being health. Calcium is an essential constituent of human being. The low content of calcium is drinking water may cause rickets and defective teeth; it is essential for nervous system, cardiac function and in coagulation of blood. Being an important contributor to hardness in water it reduces the utility of water for domestic use [32].
Calcium content was noticed to be 101 in well water, 184 in bore water and these values were found to be within the permissible limit, whereas, slightly low values up to 54 in tap water and 65 in pond water were noticed. However, these waters were seemed to be suitable for drinking purpose. Geologically, magnesium rich minerals are associated with basic and ultrabasic rocks and ultramafic rocks of igneous and metamorphic percentage. When Magnesium is present above 200mg/l, it may produce gastrointestinal irritation. Magnesium is moderately toxic element if its concentration in drinking water is high. Calcium and Magnesium are of great neurochemical importance. Symptoms of cathartic and diuretic action are observed if excess of these ions are consumed [33]. They are also the source of the hardness.
Hike of magnesium could be noticed from the tannery effluent in Nagpur by Srinivas, et al. [34] and reported that the presence of calcium, magnesium and bicarbonates in excess makes water unfit for irrigation since its application increase problems of soil salinity and its permeability detrimental to crop plants. Magnesium content was seemed to be below the desirable limit in well water (24), tap water (12), bore water (20) and pond water (15). Generally, surface water contains < 1mg/l of Fe. Some ground water contains much higher level of Fe. The iron value > 2mg/l imparts bitter astringent taste to the water [35]. Concentration of Fe above the safe limit could lead to liver, lung, kidney, brain, heart, muscle and respiratory disorders [36]. Iron content was noticed to be 0.40 in pond water and nil value in bore well water, well water and tap water.
Free Ammonia content was noticed to be 0.40 in pond water and nil value in bore well water, well water and tap water. Wetzel, et al. [37] stated that ammonia is generated by heterotrophic microbes as a primary end product of decomposition of organic matter either directly from proteins or from the organic compounds. Nitrite poisoning causes fish mortality resulting in converting hemoglobin to form methemoglobin as indicated by Boyd, et al. [38]. Nitrite was noticed to be 0.04 in pond water and nil value in bore well water, well water and tap water. The acceptable limit of NO3 is 45-100. In excessive amounts it contributes to the illness of infant methemoglobinemia and to prevent this disorder a limit of 10mg dm3 of nitrate nitrogen is imposed on drinking water [39].
Nitrate represents the end product of oxidation of nitrogenous matter and its concentration is a presence of nitrification activities under progress in water [40]. Nitrate
is a prime plant nutrient and rising in its concentration might be expected to increase the eutrophication of water [41]. Nitrate is one of the several inorganic pollutants contributed by nitrogenous fertilizers, human and animal waste and industrial effluents through the biochemical activities of microorganisms [39]. Nitrate values was noticed to be 20 in pond and well waters and 17 in tap water and these values were below the desirable limit. There was an appreciable quantity was noticed only in bore well water.
Chloride level in water is a useful measure in water sample. High level is not known to be injurious to fresh water organism. The acceptable limit of Cl is 200-1000. Chloride content was found to be 266 in bore water and 260 in well water and these values were found to be within the permissible limit, whereas, chloride content noticed as 58 in pond water and 60 in tap water were seemed to be below the desirable limit. Chloride becomes more toxic when they combined with other toxic substances such as cyanides, phenols and ammonia [42].
The pollution from the industrial effluent will be a source of chloride concentration in the industrial area. High chlorides indicate organic pollution, particularly from domestic sewage. Discharge of industrial effluents in surface water bodies, presence of sodium and calcium, chloride in natural water and higher salinity are responsible for higher concentration of chloride in the area. Fluoride is also an important chemical constituent of the water. It generally present in small quantities. Its occurrences in higher amount in the order of 1 mg/l are safe and effective in reducing the dental decays. Fluoride content noticed 0.2 in pond water and 0.4 in bore water; well water and tap water were below the desirable limit. The result indicated that the low quantity of fluoride content present in the water may cause dental caries and its related effect. The low concentration of fluoride below 0.5 mg/l causes dental caries and when present in higher concentration it causes dental and skeletal fluorosis, mottling of teeth etc [39, 43].
Gujarat is one of the most worst affected state amongst the 15 states of India reported as endemic for fluorosis [44]. Fluoride is often referred to as two-edged sword. Fluoride is very much essential for healthy growth of teeth. However, levels higher than 1.5 mg/l causes dental and skeletal fluorosis, decalcification, mineralization of tendencies, digestive and nervous disorders [45]. The acceptable limit of sulphate is 200-400. Sulphate content was recorded to be very low in pond water (67) and in tap water (67) and these results was seemed to be below the desirable limit. Whereas, moderate quantity of sulphate content was also noticed in bore well and well waters. The presence of sulphate content in high salt water, sewage effluent, ceramic industry, etc. has been discussed in detail by many investigators [27, 34, 46].
Phosphate content was present as 0.35 in pond water and as nil values in bore well, well and tap waters. Generally, high content of PO4 in the water may be attributed to the inlet of sewage from the drainage of the city, which is rich in detergents are the contribute factors for phosphates. The excessive phosphate concentration evokes an algal bloom in the water. Since nitrate, nitrite and phosphate are nutrients for plankton growth, the water is rich in algal contents.
Tidy’s test is useful for testing organic pollution. The pollution may be due to sewage or industrial waste. When the organic load is high, the dissolved oxygen level in water decreased and affects the aquatic life. Sinha, et al. [47] studied the physic-chemical characteristics of underground drinking water at Maradabad industrial area in India. This result indicated that the drinking water was found to be highly contaminated with reference to most of the parameters. Their study suggested that people dependent on this water are prone to health hazards of contaminated drinking water and some effective measures are urgently needed for water quality management.
In a report of Government of Tamil Nadu it is stated that a water system head-work has to be virtually abandoned due to the high pollution level by tannery effluents. The water quality in and around Vaniyambadi, Ambur, Walajapet and Dindugal leave much to be desired. The need for tackling the tannery effluents on a serious footing has been raised from time to time.
According to Dhulasi Birundha, et al. [48], the sewage of a tannery discharged after treatment of one ton hide is equivalent to public sewage of little town inhabited with 5000 people. The effect that leather tanning industry has on the open water bodies is very greater often quite detrimental. The presence of sodium sulphate, chromium and some tanning agents remove oxygen from water, give it an unpleasant odour and completely stop the self-purification process in water bodies by killing the biota.
The tanning industry is a potential polluting industry of considerable importance. It is realized that the untreated waste waters when allowed to stagnate as is being done in most cases now, give rise to odour nuisance unseen appearance besides creating ground water and surface water pollution. Ramaswamy, et al. [49] studied the groundwater quality of Tamil Nadu in the premises of tanneries and observed that the total hardness, chlorides, calcium and magnesium were 3 to 28 times higher than the drinking water permissible limit prescribed by WHO [50]. The tannery effluent contains high concentration of metallic ions like chromium, potassium, sodium and magnesium and organic pollutants like oil, grease, tannin and lignin [51].
Khwaja, et al. [52] discussed about the influence of waste on the physic-chemical characteristics of the Ganga water and sediments vis-a-vis tannery at Kanpur (India) and revealed that increase values of parameters such as BOD, COD, chlorine and total solids could be due to the domestic wastes just as much as to the tannery wastes. However, chromium is one parameter, which can primarily be identified to originate from the tanneries. Sponza, et al. [53] stated that the waste water (industrial effluents) causes soil and ground water pollution besides causing a number of adverse effect on agricultural produce, animals and health of people living in the neighboring areas, since it contains waste chemicals and toxic heavy metals. An enormous increase in pollution due to discharge of effluents from industrial units into rivers and lakes is a matter of great concern in developing and developed countries which have water pollution problem due to industrial proliferation and modernization agricultural technologies, are now on the ways of combating the problems through improved waste water treatment technique. But, developing countries with lack of technical known how, weak implementation of environmental policies and with limited financial resources are still facing problems [54, 55].
Result of the present study indicated that the levels of most of the physico-chemical parameters were seemed to be below the permissible limit in all the bore well, pond, well and tap waters in Kambarajapuram village of Thiruvalam area. Among these four waters compared the TDS and electrical conductivity contents were seemed to be lower in pond and tap waters than the other two waters of well and bore well. The TDS and EC values were present in bore water as 1062 and 1517. TDS and EC values were found to be low in pond water as 481 and 687 and in tap water these values were found to be 382 and 545, respectively. Result of the study indicated that pond and tap waters were seemed to be suitable for drinking purpose.
It is concluded from this study that the fluctuation of physico-chemical variations in all the four waters of Kambarajapuram village in Thiruvalam area showed suitable for irrigation and drinking purpose, In the present study, low level of fluoride content in a range of 0.02-0.04 showed harmful effect for dental caries and its related effects as reported by many investigators.
References
-
Tiwari DR (1999) Some thought for water resource management for cihhatarpur city, India. Ecol Env and Cons 5(3): 289-291.
-
Trivedy RK, Goel PK (1988) An Introduction to Air Pollution, Techno. Science Publ, Jaipur, Pp: 216.
-
Rao SA, Rama Mohana P, Rao A, Rao SN (1999) Study on degradation of water quality of Kollerce lake I 41(4): 300-311.
-
NAS (1974) Medical and biological effects of environmental pollutants chromium. Recommended Dairy Dietary Allowances. 8th (Edn.), Food and Nutrition Board, National Academy Science, Division Medical Science, National Research Council, Washington DC, pp: 55.
-
Steven JD, Davies LJ, Stanley EK, Abbott RA, Thnad M, Bidstrup L, et al. (1976) Effects of Chromium in the Canadian environment. Nat. Res. Coun, Canada, NRCC No, 15017, pp: 168.
-
Synder AD, DeAngelis DG, Eimutus EC, Haile DM (1977) Environmental monitoring near industrial sites chromium plus Appendices U.S. Environ. Protection Agency Rep pp: 56.
-
Towill LE, Shriner CR, Drury JS, Hammons AS, Holleman JW (1978) Reviews of the environmental effects of pollutants : III Chromium. U.S. Environ. Protection Agency Rep pp: 287.
-
Taylor FG, Parr PD (1978) Distribution of Chromium in vegetation and small mammals adjacent to cooling towers. J Tenn Acad Sci 53: 87-91.
-
Langard S, Norseth T (1979) Handbook on the toxicology of metals-Chromium. In: Friberg L, Nordberg GF, et al. (Eds.), UB Vouk Elsevier/North Holland Biomedical Press, pp: 383-397.
-
Post MA, Campbell PG (1980) Lead chromate pigments-a literature survey on environmental and toxic effects. U.S. Dep. Comm Nat Bur Stand Rep NBSIR 809-1974, pp: 38.
-
Hatherill JR (1981) A review of the mutagenicity of Chromium. Drug Chem Toxicol 4: 185-195.
-
Ecological Analyst Inc (1981) The sources, chemistry, fate, and effects of chromium in aquatic environment. Available from American Petroleum Institute, 2101 L St., N.W., Washington, DC 20037, pp: 207.
-
APHA (2000) Standard methods for the examination of water and waste water. In: 23rd (Edn.), American Public Health Association, Washington DC.
-
WHO (1984) Guidelines for drinking water quality. 4th (Edn.), Geneva.
-
Yuxing, W, Jian Y (1999) Decolonization of synthetic dyes and wastewater from textile. Water Research 33(16): 3512-3520.
-
Akan JC, Abdul Rahman FI, Ogubuaja VO, Reuben KD (2009) Study of the physicochemical pollutants in Kano Industrial Areas, Kano State, Nigeria. Journal of Applied Sciences in Environmental Sanitation 4(2): 89-102.
-
Welcomme RL (1985) River fisheries. FAO Fisheries Technical Paper (262): 330.
-
Manivasakam N (1984) Physico-chemical examinationof water, sewage and industrial effluents. Pragati Prakasham, Meerut.
-
Robinson RA, Stokes RH (1959) Electrolyte Solutions. 2nd (Edn.), Academic Press, New York, pp: 466.
-
Pathe PP, Nandy T, Kaul SN (1995) Properties of chromium sludge from chrome tan wastewater. Indian Journal of Environmental Protection 15(2): 81-87.
-
Reddy PM, Subba Rao N (2001) Effects of industrial effluents on the groundwater regime in Vishakapatnam. Pollution Research 20(3): 383-386.
-
Mbuthia BM, Busaidy AHSE, Jonnalagadda SB (1989) Environmental protection- Treatment of tannery effluents. Indian Journal of Environmental Protection 9(6): 401-406.
-
Saravanan P, Saravanan A, Elangovan N, Kalaichelvan PT (1999) Decolourization of tannery effluent by Flavobacterium sp. EK 1. Indian Journal of Environmental Protection 19(1): 19-24.
-
Shukla A, Shukla NP (1994) Tannery and electroplating effluent treatment- Precipitation of Chromium and Nickel. Indian Journal of Environmental Protection 14(6): 457-461.
-
Kadam RV (1990) Treatment of tannery wastes. Indian Journal of Environmental.
-
Sastry CA (1986) Characteristics and treatment of wastewater from tanneries. Indian Journal of Environmental Protection 6(3): 159-168.
-
Sakthivel M, Sampath K (1990) Respiration, blood cells and food conversion efficiency in Cyprinus carpio exposed to sublethal concentrations of tannery effluents. In: Deshmukh PB, Mathai AT, Dalela RC, Pillai KS, et al. (Eds.), Environment and Experimental toxicology, Jai Research Foundation, Valvada pp: 139-150.
-
Saxena NM (1987) Environmental analysis of water, soil and air. Agro Botanical Publ. India pp: 184.
-
Praharaj AK, Mohanfa BK, Nanda NK (2002) Studies on ground water quality of Rourkela, Orissa, Poll Res 23(2): 399-402.
-
Crawford MD (1972) Hardness of Drinking and Cardiovascular diseases. Proc Nat Soci 31: 347-353.
-
Pandhe GM, Dhembarke AJ, Patil RP (1995) The physic- chemical characteristic and quality of water from the Pravarra area, Ahmednagar district, Maharashtra. Journal Aqua Biol 10(1): 43-43.
-
Vijayaram K, James L, Geraldine P, Varadarajan TS, Periaswamy K, et al. (1989) Pollution studies of ground water in Sempattu, Tiruchirapalli. India. J Env Prot 9(10): 746-750.
-
Purohit SS, Saxena MM (1990) Water life and pollution in Physical, Chemical and Biological characteristics of water. Agro Botanical Publishers (India), New Delhi pp: 19-29.
-
Brian JL, Berry ED (1977) The social burden of environmental pollution, a comparative metropolitan data source, Ballinger Publishing Company, Cambridge pp: 133.
-
Srinivas, Piska RS, Reddy RR (2002) Ground water pollution due to the Industrial effluents in Kothur Industrial Area, Mahboobnagar, Andhra Pradesh. Eco Env & Cons 8(4): 377-380.
-
Maiti SK (2002) Hand Book of methods in environmental studies In: volume 1. water and waste water Analysis. ABD publishers Jaipur, India.
-
Lark BS, Maharajan RK, Swalia TP (2002) Determination of metals of Toxicological significance in sewage irrigated vegetable by using atomic absorption spectrometry and anodic stripping voltametry. Indian J Environ Hlth 44(2): 164-167.
-
Wetzel RG (1983) Limnology. In: 2nd (Edn.), ICMR saunders college publication. USA, pp: 767.
-
Boyd CE (1990) Water Quality in Ponds for Aquaculture. Auburn University (Ala). Agriculture Experiment Station, Alabama pp: 482.
-
Agarwal AK (2005) Water pollution. APH Publication, New Delhi pp: 1-384.
-
Singh AK (2002) Quality Assessment of surface and subsurface water of Damodar River Basin, Indian J Environ Hlth 44(1): 41-49.
-
Goher ME (2002) Chemical studies on the precipitation and dissolution of some chemical elements in Lake Qarum, Ph.D., Thesis, Faculty of Science, Al-Azhar University. Cairo, Egypt.
-
Anonymous (1976) Quality Criteria for water, U.S. Environmental Protection Agency, 440-9-76-023.
-
Prajapati JR, Raol BV (2006) Physico-Chemical and bacteriological characteristics of drinking water samples of various railway stations located on western railway line from Kalol to Abu road, Gujarat. Ecol Env and Cons 12(3): 543-546.
-
Jain CK, Sharma MK, Bhatia KKS, Seth SM (2000) Ground water pollution endemic of fluorosis. Poll Res 19(4): 505-509.
-
Udhayakumar J, Natarajan D, Srinivasan CK, Mohanasundari, Balasubramani M (2006) Correlations among water quality parameters for ground waters in Chidambaram town. Ind J Environ Prot 18(10): 734-738.
-
Kaur H, Dhiloon SS, Bath KS, Mandar G (1996) Analysis of element polluting river Ghaggar in the region of Punjab. Journal of Environment and Pollution (2): 65-68.
-
Sinha DK, Rastogi GK (2007) Physico-chemical characteristics of underground drinking water at Moradabad. Poll Res 26(3): 345-349.
-
Birundha DV, Saradha K (1993) Environmental implications of leather tanneries. Ashish Publishing House, New Delhi, pp: 37-38.
-
Ramaswamy S, Sridharan S (1998) Physico-chemical characteristics of surface and ground waters in the tannery belt of Vaniyambadi and Ambur, North Arcot District, Tamil Nadu. Poll Res 17(2): 141-147.
-
WHO (1993) Guidelines for drinking water quality. World Health Organisation, Geneva.
-
Manonmani K, Wakumari J, Pongaliappan S, Swaminathan K (1991) Effects of tannery effluents on the quality of irrigation canal water. J Ind Pollu Contl 7(2): 87-91.
-
Khwaja AR, Singh R, Tandon SN (2001) Monitoring of Ganga water and sediments vis-à-vis tannery pollution at Kanpur (Inda): A case study. Environ Monit Assess 68(1): 19-35.
-
Sponza DT (2003) Application of toxicity tests into discharges of the pulp-paper-industry in Turkey. Ecotoxicology and Environmental Safety 54: 74-86.
-
Trivedi RK, Chandrasekar TR (1999) Sediment characteristics of fresh water bodies of Mangalore. Karnatak N Ecol Biol 11(1): 59-64.
- Natural Decline to Extinction of A New Zealand Rabbit Population
- Mitochondrial Bio-Logistics: Steering Co-Enzyme Q10 and Lycopene Synergies within the Science 4.0 Bio-OS Framework
- Hymenoptera Specimens from the Caño Negro Wetland, of the National Museum Collection, Costa Rica
- Science 4.0: Comprehensive Architecture of the Biological Operating System (Bio-OS) A Framework for Systemic Resilience and Industrialized Bio-Governance
- Rabbit on, or Hare Back? Understanding Climate Change
- Clinical Validation of Science 4.0: Flow Steering and Epigenetic Drift Inversion on a 76-Year-Old Hybrid System