Forecast of the Number of Shark Attacks Worldwide and in Florida, United States
A forecast is made until the year 2023 of shark attacks worldwide and in Florida, United States of America, for this the data corresponding to the period 2007 to 2016 were used according to the statistics reported in the newspaper Juventud Rebelde on Sunday 12 November 2017 that was taken from the International Shark Attack Archive (ISAF). For statistical modeling, the Regressive Objective Regression (ROR) was used due to its simplicity and speed to obtain the models. The average number of shark attacks is 77 cases with a standard deviation of 11 cases of them with fatal consequences 6 and a maximum of 13 fatal attacks have occurred in the history of this database, in the case of Florida the average of attacks is 24 attacks with a standard deviation of approximately 7. The analysis of variance cannot show Fisher's F nor its significance because the sum of squares of the residuals is zero, statistics that involve division by zero according to the authors of division by zero must be calculated. The coefficients of the model show a tendency to rise by 3.7 attacks, the model depends on the attacks 7 years ago at the Global level. In fatal attacks the trend is downward, although not significant. The model for shark attacks in the state of Florida explains 100% of the variance with an error of 0.42 cases. Measures must be taken both globally and in Florida to try to reduce both the number of shark attacks and the victims caused by these accidents, as well as protect people and these animals that play such an important role in the food chain.
Introduction
It seems that Police Chief Martin Brody, the shark hunter from Steven Spielberg’s film, is not running out of work. The United States is the country that has registered the most shark attacks in 2010 (36 incidents) according to an annual study carried out by the University of Florida10 and which was made public today. In this way, the US surpasses the number of countries such as Australia (14), South Africa (8), Vietnam (6) and Egypt (6), in the top of the regions that register the most attacks by this marine predator [1, 2, 3, 4, 5].
A total of 79 incidents occurred around the world last year, a number that nearly equals the 80 attacks that occurred in 2000. Of those attacks, six of them ended in death [6].
“Florida has reached its lowest number since 2004, which was 12 attacks,” explains George Burgess, shark expert from the University of Florida, despite the fact that the United States is the number one country in attacks by this species. Of the North American States, Florida continues to be the one that has registered the most emergencies due to shark attacks11, a total of 13 warnings, of the five registered by North Carolina or the four by California or Hawaii, among others. The explanation for the figure, which for the expert, reiterates, is one of the lowest in six years, is due to the economic crisis: “It may be the result of the reduction in the number of tourists who come to Florida or the weather that the natives spend in the coasts of the region and the money that they can spend in going to the beach “, emphasizes Burgess [7, 8].
According to the same study by the University of Florida, the increase in the last century of attacks by a shark on humans is not necessarily linked to a more aggressive behavior of these animals, but is a direct consequence of the greater time that humans spend in the sea and its coasts, which increases the risk of attack [9, 10]. Shark experts at the Florida Museum of Natural History12 advise swimming in groups, avoiding doing so in areas far from the coast and at night, where sharks are most active.
From this it follows that our work will be aimed at predicting shark attacks in the world and in Florida, which can be a way to raise awareness in people to take care of themselves on the beaches and collaterally preserve the life of People and animals [11, 12].
Materials and Methods
A forecast is made until the year 2023 of shark attacks worldwide and in Florida, United States of America, for this the data corresponding to the period 2007 to 2016 were used according to the statistics reported in the newspaper Juventud Rebelde on Sunday 12 November 2017 taken from the International Shark Attack Archive (ISAF, at www. floridamuseum.ufl.edu).
For statistical modeling, the Regressive Objective Regression (ROR) 1-8 was used due to its simplicity and speed in obtaining the models, for which dichotomous variables DS, DI and NoC are created in a first step where: NoC - Number of base cases, Trend DS = 1, if NoC is odd; DI = 0, if NoC is even, when DI = 1, DS = 0 and vice versa.
Subsequently, the module corresponding to the Regression analysis of the statistical package SPSS version 19.0 (IBM Company, 2010) was executed, specifically the ENTER method where the predicted variable and the ERROR are obtained.
Then the autocorrelagrams of the ERROR variable were obtained, paying attention to the maximums of the significant partial PACF autocorrelations. The new variables were then calculated taking into account the significant Lag of the PACF. Finally, these variables returned in a process of successive approximations were included in the new regression until a white noise was obtained in the errors of the regression.
Results
In table 1 it can be seen that worldwide the average number of shark attacks is 77 cases with a standard deviation of 11 cases of them with fatal consequences 6 and a maximum of 13 fatal attacks have occurred in the history of this database In the case of Florida, the average number of attacks is 24 attacks with a standard deviation of approximately 7.
| N | Mínimo | Máximo | Media | Desv. típ. | |
|---|---|---|---|---|---|
| Año | 20 | 2007 | 2026 | 2016,50 | 5,916 |
| TiburFlorida | 10 | 11 | 32 | 24,40 | 7,321 |
| TiburWorld | 10 | 55 | 98 | 76,60 | 11,306 |
| FatalesWorld | 10 | 1 | 13 | 6,10 | 3,479 |
| N válido (según lista) | 10 |
Table 1: Descriptive statistics of shark attacks in Florida and in the World.
The model obtained for the global attacks explains 100 percent of the variability, the standard errors cannot be appreciated (Table 2).
Resumen del modelo c, d
| Modelo | R | R cuadradob | R cuadrado corregida | Error típ. de la estimación | Durbin-Watson |
|---|---|---|---|---|---|
| 1 | 1,000a | 1,000 | . | . | ,986 |
Table 2: Summary of the model for Shark Attacks worldwide.
a. Predictor variables: Lag 7D, DI, NoC b. For regression through the origin (the model without intersection term), R squared measures the proportion of the variability of the dependent variable explained by the regression through the origin. CANNOT compare the above to R squared for models that include an intersection. c. Dependent variable: Tibur World d. Linear regression through the origin. Table 2: Summary of the model for Shark Attacks worldwide.
The analysis of variance cannot show Fisher’s F nor its significance because the sum of squares of the residuals is zero (Table 3). As the errors are Zero, the Fisher statistic ANOVA c, d cannot be calculated, for this, statistics that involve a division by zero according to the authors of division by zero must be calculated.
| Modelo | Suma de cuadrados | gl | Media cuadrática | F | Sig. |
|---|---|---|---|---|---|
| Regresión | 21,494,000 | 3 | 7,164,667 | . | .a |
| Residual | ,000 | 0 | . | ||
| Total | 21494,000b | 3 |
Table 3: Analysis of variance of the model for shark attacks worldwide.
a. Predictor variables: Lag7D, DI, NoC b. This total sum of squares has not been corrected for the constant because the constant is zero for the regression through the origin. c. Dependent variable: TiburWorld d. Linear regression through the origin Table 3: Analysis of variance of the model for shark attacks worldwide.
The coefficients of the model show a trend to rise in 3.7 attacks, the model depends on the attacks 7 years ago (Lag7D) Table 4.
Coeficientes a,b
| Modelo | Coeficientes no estandarizados | Coeficientes tipificados | t | Sig. | |
|---|---|---|---|---|---|
| B | Error típ. | Beta | |||
| DI | 17,021 | ,000 | ,116 | . | . |
| Trend | 3,716 | ,000 | 1,142 | . | . |
| Lag7D | -,284 | ,000 | -,217 | . | . |
Table 4: Model obtained for shark attacks worldwide.
a. Dependent variable: TiburWorld b. Linear regression through the origin Table 4: Model obtained for shark attacks worldwide.
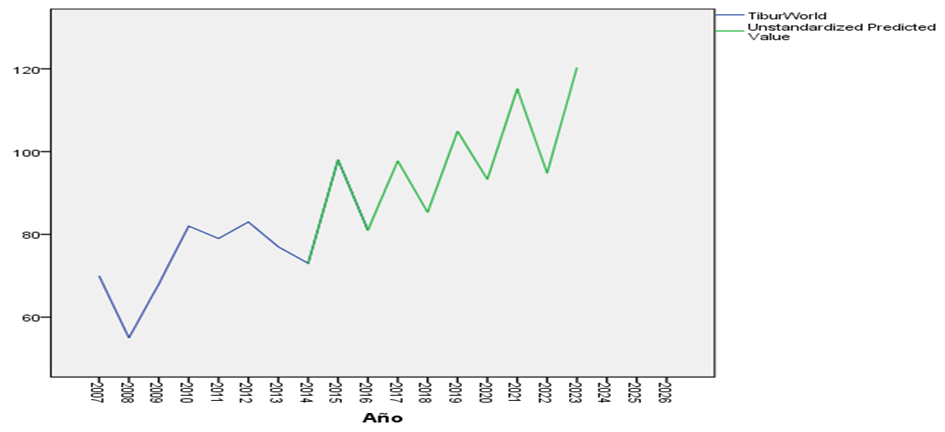
Figure 1 shows the real and predicted value according to the model, it can be seen how in the years 2014 to 2016 the coincidence of the predicted value and the real one is excellent.
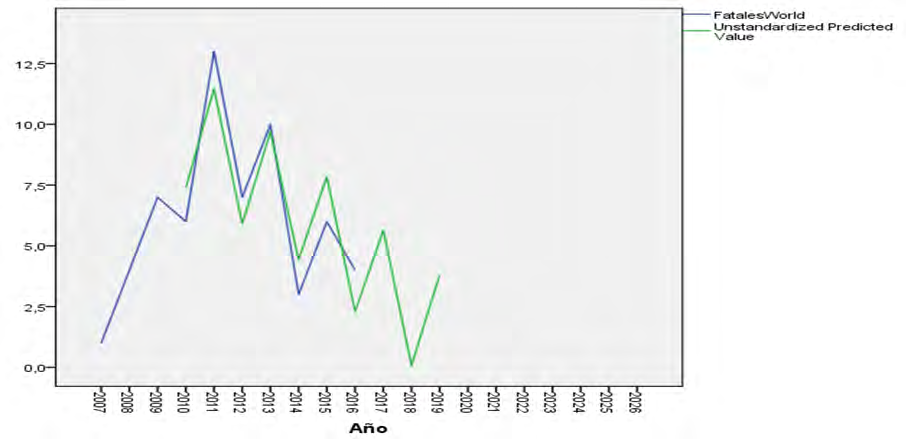
In the case of fatal attacks, 98% of the variance of the cases is explained with an error of 2.16 cases, Fisher’s F is 21.53 significant at 99%, the model obtained (Table 5) shows that no parameter was significant and that the trend is downward, although not significant, this should not discourage us since the fatal attacks variable (FatalesWorld) is a white noise, and the parameters obtained provide explained variance to the model. This model depends on the number of attacks 3 years ago (Lag3D).
Coeficientes a, b
| Modelo | Non-standardized coefficients | Typified coefficients | t | Sig. | |
|---|---|---|---|---|---|
| B | Error típ. | Beta | |||
| DS | 27,421 | 14,217 | 2,692 | 1,929 | ,149 |
| DI | 32,237 | 14,842 | 2,741 | 2,172 | ,118 |
| Trend | -,957 | ,690 | -2,995 | -1,388 | ,259 |
| Lag3D | ,072 | ,400 | ,072 | ,180 | ,869 |
Table 5: Model obtained for fatal shark attacks worldwide.
a. Dependent variable: FatalesWorld b. Linear regression through the origin Table 5: Model obtained for fatal shark attacks worldwide.
values are practically zero, so you should continue to alert by campaigning in favor of the protection against these accidents.
Also, a model was made for shark attacks in the state of Florida, obtaining a model that explains 100% of the variance with an error of 0.42 cases (Table 6). Fisher’s F is 6184 significant at 99%.
| Modelo | R | R cuadradob | R cuadrado corregida | Error típ. de la estimación | Durbin-Watson |
|---|---|---|---|---|---|
| 1 | 1,000a | 1,000 | 1,000 | ,424 | 3,420 |
Table 6: Summary of the model for shark attacks in Florida.
a. Predictor variables: Lag7D, DI, NoC, DS b. For regression through the origin (the model without intersection term), R squared measures the proportion of the variability of the dependent variable explained by the regression through the origin. CANNOT compare the above to R squared for models that include an intersection. c. Dependent variable: TiburFlorida d. Linear regression through the origin Table 6: Summary of the model for shark attacks in Florida.
The model obtained depends on 7 years ago (Lag7D) and the trend is negative and not significant. (Table 7).
Model Summary c, d
| Model | R | R Cuaraodob | R Cuaraodo Coresgida | Estimation error tip | Durbin watson | |
|---|---|---|---|---|---|---|
| 1 | 1000a | 1000 | 1000 | 424 | 3420 | |
| Modelo | Coeficientes no estandarizados | Coeficientes tipificados | t | Sig. | ||
| Modelo | B | Error típ. | t | Sig. | Beta | |
| DS | 54,400 | 4,068 | 1,412 | 13,372 | ,048 | |
| DI | 56,020 | 4,075 | 1,187 | 13,747 | ,046 | |
| Trend | -,520 | ,104 | -,406 | -5,004 | ,126 | |
| Lag7D | -,440 | ,060 | -,455 | -7,333 | ,086 |
Table 7: Florida Shark Attack Model. U.S.
Coeficientes a, b
a. Variable dependiente: TiburFlorida b. Regresión lineal a través del origen Table 7: Florida Shark Attack Model. U.S.
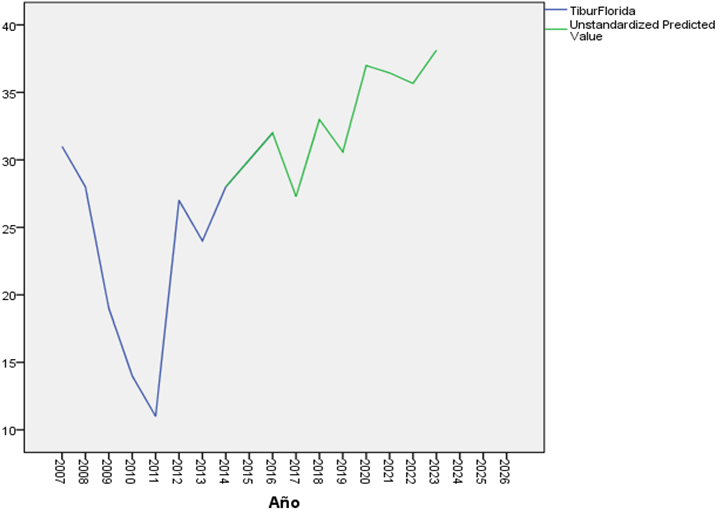
Figure 3 shows the real and predicted value according to the model, it can be seen in the years 2014 to 2016 the coincidence of the predicted value and the real one is excellent.
Conclusion
Measures must be taken both globally and in Florida to try to reduce both the number of shark attacks and the victims caused by these accidents, as well as protect these animals that play such an important role in the food chain.
References
-
Duarte RF, Rodríguez RO, Iannacone J, Ramírez AC, Fernández LD, et al. (2017) Modeling And Prediction For Molluscs With Angiostrongylosis In The Province Villa Clara, Cuba Using The Regressive Objective Regression (Ror). TheBiologist (Lima) 15(1): 16.
-
Sánchez Alvarez ML, Rodríguez RO, Duarte RF, Rodriguez BCG, Iannacone J, et al. (2017) Regressive Objective Regression Beyond A White Noise For Viruses Circulating In The Villa Clara Province, Cuba. The Biologist (Lima) 15(1): 127.
-
Rodríguez RO, Duarte RF, Cárdenas JWA, Oliver JI, Ferrer YZ, et al. (2018) Mathematical modeling of cholera by means of the regressive objective regression and its relationship with climate variables. Caibarién, villa clara, cuba. The Biologist (Lima) 15(S1): 128.
-
Duarte RF, Rodríguez RO, Ramirez AC, Iannacone J, González RG, et al. (2018) Modeling And Forecasting For Mollusk’s With Angiostrongilosis In The Province Villa Clara, Cuba Using Objective Regressive Regression (ROR).
-
Rodríguez O, Alemán B, Llanes O, Meylin OM, Duarte FC, et al. (2015) How Much Methodology ROR Explains The Rain Errors In Caibarién, Cuba.
-
Rodríguez RO (2014) MathematicalModeling (ROR) applied to theforecast of earthquakes in the global level. Revista Electronica de Veterinaria 15(8).
-
Rodríguez RO (2017) The ROR´ s Methodology and it´spossibility to findinformation in a White Noise. International Journal of Current Research 9(3): 47378- 47382.
-
Rodríguez RO, Ismabel DH, Félix Alfredo PM, Lorenzo FJ (2017) Modeling and Forecasting of Tri-hourly Atmospheric Pressure at sea level 11 years in advance of the Province of Villa Clara Cuba. Centro Meteorológico Provincial deVilla Clara. Inédito.
-
Oses (2015) Division by zero, of Cristosols to estimate universe longitude. Futurology and Regressive methodology finding information beyond awhite noise. Lambert Academic Publishing.
-
(2020) The International Shark Attack File.
-
(2018) Summer of the Shark.
-
(2020) Sharks Attacks relarisk reduce.
- Mitochondrial Bio-Logistics: Steering Co-Enzyme Q10 and Lycopene Synergies within the Science 4.0 Bio-OS Framework
- Hymenoptera Specimens from the Caño Negro Wetland, of the National Museum Collection, Costa Rica
- Science 4.0: Comprehensive Architecture of the Biological Operating System (Bio-OS) A Framework for Systemic Resilience and Industrialized Bio-Governance
- Rabbit on, or Hare Back? Understanding Climate Change
- Clinical Validation of Science 4.0: Flow Steering and Epigenetic Drift Inversion on a 76-Year-Old Hybrid System
- Seeds Planted by another Mind