Crystal induced Arthropathies A Comparative Study of 186 Patients with Gout, Apatite Rheumatism, Chondrocalcinosis and Primary Synovial Chondromatosis
Gout (G), apatite rheumatism (AR), chondrocalcinosis (Ch-C), and primary synovial chondromatosis (prSynCh) are regarded as distinct clinical entities. The introduction of the non-staining technique by Bély and Apáthy (2013) opened a new era in the microscopic diagnosis of crystal induced diseases, allowing demonstration of MSU, HA, CPPD, cholesterol, crystalline liquid lipid droplets, and several other non-identified crystals in unstained sections of conventionally processed (aqueous formaldehyde fixed, paraffinembedded) tissue samples. Aim of this study was to describe the characteristic histology of crystal deposits in G, AR, Ch-C, and prSynCh with traditional stains and histochemical reactions comparing with unstained tissue sections of Bély and Apáthy (2013). Patients and Methods: Tissue samples of 146 patients with clinically diagnosed gout, 4 with apatite rheumatism (Milwaukee syndrome), 16 with chondrocalcinosis, and 20 with clinically diagnosed primary synovial chondromatosis were analyzed. Results and Conclusions: Gout is a distinct metabolic disease with monomorphic MSU crystal deposits, while apatite rheumatism, chondrocalcinosis, and primary synovial chondromatosis are related metabolic disorders with HA and CPPD depositions. The authors assume that AR and Ch-C are different stages of the same metabolic disorder, which differ from prSynCh in amorphous mineral production, furthermore in the production of chondroid, osteoid and/or bone. prSynCh is a defective variant of HA and CPPD induced metabolic arthropathy with reduced mineralization which is replaced with chondroid and/or bone formation. The non-staining technique of Bély and Apáthy proved to be a much more effective method for the demonstration of crystals in metabolic diseases than conventional stains and histochemical reactions.
Bély M¹* and Apáthy A²
¹Department of Pathology, Hospital of the Order of the Brothers of Saint John of God in Budapest, Hungary ²Department of Rheumatology, St. Margaret Clinic, Budapest, Hungary
Abbreviations
G: Gout; AR: Apatite Rheumatism; Ch-C: Chondrocalcinosis; prSynCh: Primary Synovial Chondromatosis; MSU: Monosodium Urate Monohydrate; [NaC5H3N4O3·H2O] Crystal: Crystalline Monosodium Salt of Uric Acid [C5H4N4O3]; HA: Calcium hydroxyapatite [Ca5(PO4)3(OH)]; CPPD: Calcium Pyrophosphate Dehydrate [Ca2P2O7.2H2O]; CC: Cholesterol Crystals [C27H46O]; CL: Crystalline Liquid Lipid Spherules; HE: Hematoxylin Eosin; TS: Tissue Samples; Pr. n0/y – Protocol Number/Year.
Introduction
The non-staining technique of Bély and Apáthy (2013) proved to be a much more effective method for the demonstration of crystals in metabolic diseases than conventional stains and histochemical reactions [1, 2, 3, 4, 5].
The essence of this non-staining technique is avoidance of staining with water-based dyes, and viewing the deparaffinized unstained tissue sections with polarized light [1, 2, 3, 4, 5].
In unstained tissue sections of the conventionally processed (aqueous formaldehyde fixed, paraffin-embedded) surgical specimens the following are more often and in larger quantities are demonstrable: MSU – monosodium urate monohydrate [NaC5H3N4O3·H2O] (crystalline monosodium salt of uric acid [C5H4N4O3]), the HA – calcium hydroxyapatite [Ca5(PO4)3(OH)], the CPPD – calcium pyrophosphate dihydrate [Ca2P2O7.2H2O], the CC – cholesterol [C27H46O], and CL – crystalline liquid lipid droplets; beside these, several other unidentified crystals are more often visualized than with conventional stains and histochemical reactions [1, 2, 3, 4, 5].
Objective
The authors demonstrate the histological characteristics of gout (G), apatite rheumatism (AR), chondrocalcinosis (Ch-C), and primary synovial chondromatosis (prSynCh) in conventionally processed tissue samples, furthermore illustrate the sensitivity of their non-staining technique.
Materials and Methods
Between 1985 and 2010 surgical specimens of 101855 patients were processed in the Department of Pathology of the National Institute of Rheumatology (ORFI) and of the Hospital of the Order of Brothers of Saint John of God (BIK).
Among these, gout was diagnosed clinically in 146 (0.14 %), apatite rheumatism (Milwaukee syndrome) in 4 (0.0039 %), chondrocalcinosis in 16 (0.016 %), and primary synovial chondromatosis in 20 (0.020 %) patients.
Two hundred-eleven (211) paraffin embedded tissue blocks of 146 patients with gout, 16 of 4 patients with apatite rheumatism, 40 of 16 patients with chondrocalcinosis, and 37 blocks of 20 patients with prSynCh were available.
The tissue samples were fixed in an 8% aqueous solution of formaldehyde at pH 7.6 for at least 24 hours at room temperature (20 Co) and embedded in paraffin. Serial sections were examined without staining [1, 2, 3, 4, 5], with HE staining [6], as well as with special stains recommended in the literature, and were examined with the light microscope and under polarized light, respectively.
For identification of MSU crystals Gömöri’s methenamine-silver method [6, 7] and the staining method of Schultz [8, 9] were used.
Amorphous calcium phosphate [Ca3(PO4)2] and/or calcium carbonate [CaCO3] deposits – characteristically accompanying HA and CPPD crystal deposits – were identified with Alizarin red S staining (specific for calcium) [10, 11] and the von Kossa reaction (specific for phosphate and/or carbonate) [10, 12].
The amount of amorphous mineral deposits, chondroid, osteoid and/or bone formations were assessed by conventional stains and reactions [6, 7, 8, 9, 10, 11, 12, 13] using a semiquantitative score system: “0” – no mineral deposits, chondroid and/or bone formation, “1” – minimal mineral deposits, chondroid and/or bone formation, “2” – moderate mineral deposits, chondroid and/or bone formation, “3” – abundant (massive) mineral deposits, chondroid and/or bone formation [14]. The differences were calculated and compared with the Student (Welch) T-probe [15].
Demographics of the patients with the clinical diagnosis of gout, AR, Ch-C and prSynCh were compared with the Student (Welch) T-probe [15].
The effectivity of non-staining technique was characterized with Pearson’s chi-squared (χ2) test [15] comparing the prevalence of deposited crystals in unstained tissue sections with HE or with other recommended stains. The difference between two cohorts of samples was considered “significant” at an alpha level of 0.05.
Standard and unstained sections were examined with a professional high-brightness (100-Watt) microscope (Olympus BX51).
Conventionally stained tissue sections were compared with unstained sections according to Bély and Apáthy (2013) (description of method see below).
Appendix – Bély and Apáthy’s “non-staining” technique [1, 2, 3, 4, 5].
- Tissue blocks of surgically removed specimens are fixed in 8% neutral buffered formalin (at pH 7.6 for >24 hours at 20 Co room temperature).
- Tissue blocks are dehydrated in ethylalcohol, and are embedded in paraffin using acetone as well as xylene – 5 µm sections are cut.
- Prolonged deparaffinization (3-5 days) in a thermostat at 56°C (daily changing xylene)
- Chloroform – methanol I. (1:1) solution for 1 hour
- Chloroform – methanol II. (1:1) solution for 1 hour or overnight
- Dehydration in ethyl alcohol (two changes of 96% alcohol I-II. 30-30 min.), and using terpene xylene, as well as xylene, mounting in Canada balsam, cover slip.
Results: In deparaffinized tissue sections of formaldehyde fixed and paraffin embedded surgical specimens – not stained with aqueous dyes – the cholesterol crystals and crystalline lipids, furthermore the HA crystals are preserved, and are well detectable with polarized light.
In unstained sections MSU and CPPD crystals are more abundant than in sections stained with HE or with other dyes.
Results
Demographics of patients with clinically diagnosed gout, apatite rheumatism, chondrocalcinosis and primary synovial chondromatosis
The mean age of patients with the clinical diagnosis of gout (53.97 year) or prSynCh (50.20 year) was low at the time of surgery. The mean age of patients with AR was high at the time of surgery compared to the patients with the clinical diagnosis of G (74.0 year versus 53.97 year; p< 0.0117) or compared to the patients with the clinical diagnosis of prSynCh (74.0 year versus 50.20 year; p< 0.0018) (Tables 1 and 2). There was no significant difference in the mean age of patients with AR and Ch-C (74.0 year versus 63.67 year; p< 0.0840).
The mean age of females with AR was significantly higher compared to the mean age of females with G (76.67 year versus 61.79 year; p< 0.0332), like the mean age of females with Ch-C (76.67 year versus 62.08 year; p< 0.0361) or the mean age of females with prSynCh (76.67 year versus 53.15 year; p< 0.0061).
The mean age of males with G was significantly lower than the mean age of males with AR (53.11 year versus 66.00 year; p< 0.0000) or the mean age of males with Ch-C (53.11 year versus 74.00 year; p< 0.0000), and was significantly higher than the mean age of patients with prSynCh (53.11 year versus 44.71 year; p< 0.0000).
There was a significant difference in mean age of females and males with G (61.79 year versus 53.11 year; p< 0.0000), like in the mean age of females and males with Ch-C (62.08 year versus 74.00 year; p< 0.0151).
Comparing the mean age of females and males with prSynCh the difference was not significant (53.15 year versus 44.71 year; p< 0.2146).
Table 1 summarizes the demographics of patient cohorts with the clinical diagnosis of G (n=146), AR (n=4), Ch-C (n=16) or prSynCh (n=20).
| Clinical diagnosis | Number of patients | Mean age in years at surgery ± SD | Range |
|---|---|---|---|
| (Tissue samples) | (In years) | ||
| Gout (MSU) | 146 (211) | 53.97±10.12 | 32 – 85 |
| Female | 14 (9) | 61.79±10.18 | 36 – 76 |
| Male | 132 (202) | 53.11±9.78 | 32 – 85 |
| Apatite rheumatism (HA) | 4 (16) | 74.00±7.70 | 66 – 82 |
| Female | 3 (12) | 76.67±6.81 | 69 – 82 |
| Male | 1 (4) | 66 | 66 |
| Chondrocalcinosis (CPPD) | 16 (40) | 63.67±21.17 | 39 – 81 |
| Female | 14 (34) | 62.08±14.02 | 39 – 81 |
| Male | 2 (6) | 74.00±1.41 | 73 – 75 |
| Primary synovial chondromatosis | 20 (37) | 50.20±12.51 | 30 – 76 |
| Female | 13 (22) | 53.15±10.49 | 40 – 74 |
| Male | 7 (15) | 44.71±14.90 | 30 – 76 |
Table 1: Sex, mean age with SD and range (in years) of 186 patients with clinically diagnosed G, AR, Ch-C or prSynCh.
Remark to Table 1 Combined (co-existent) diseases did not occur in our patient cohorts with gout, apatite rheumatism, chondrocalcinosis, and primary synovial chondromatosis.
Table 2 summarizes the p” values of significance (at an alpha level of 0.05) comparing the mean age of patient cohorts with the clinical diagnosis of G (n=146), AR (n=4), Ch-C (n=16) or prSynCh (n=20).
| Mean age of patients | p<0.05 | Mean age of females | p<0.05 | Mean age of males | p<0.05 | |
|---|---|---|---|---|---|---|
| Gout n=146 vs AR n=4 | 53.97 vs 74.00 | 0,0117 | 61.79 vs 76.67 | 0,0332 | 53.11 vs 66.0 | 0 |
| Gout n=146 vs Ch-C n=16 | 53.97 vs 63.67 | 0,0225 | 61.79 vs 62.08 | 0,9536 | 53.11 vs 74.00 | 0 |
| Gout n=146 vs prSynCh n=20 | 53.97 vs 50.20 | 0,2102 | 61.79 vs 53.15 | 0,0401 | 53.11 vs 44.71 | 0 |
| AR n=4 vs Ch-C n=16 | 74.00 vs 63.67 | 0,8440 | 76.67 vs 62.08 | 0,0361 | 66.00 vs 74.00 | - |
| AR n=4 vs prSynCh n=20 | 74.00 vs 50.20 | 0,0018 | 76.67 vs 53.15 | 0,0061 | 66.00 vs 44.71 | - |
| Ch-C n=16 vs prSynCh n=20 | 63.67 vs 50.20 | 0,0074 | 62.08 vs 53.15 | 0,0920 | 74.00 vs 44.71 | 0,0018 |
Table 2: Level of significance (“p” value <0.05) comparing the mean age of 186 patients with clinically diagnosed G, AR, Ch-C or
Remark to Table 2 Differences were not calculated between male patients with the clinical diagnosis of AR and Ch-C, because of a zero divisor.
Microscopic Characteristics of Gout, Apatite Rheumatism, Chondrocalcinosis and Primary Synovial Chondromatosis
Microscopic characteristics of MSU (monosodium urate monohydrate [NaC5H3N4O3·H2O] – monosodium salt of uric acid [C5H4N4O3]) crystal deposits in patients with the clinical diagnosis of gout: Deposits of MSU crystals of gouty tophi were irregular intra- or extraarticular eosinophilic formations, stained with HE, which were surrounded by inflammatory cellular infiltrates and/or by fibrosis depending of the stage of the pathological process (Figure 1a-f).
In most cases the MSU crystals dissolved in 8% formaldehyde solution and in aqueous dyes, and were not present in traditionally fixed HE stained sections. Occasionally, especially in deeper layers of tissue samples or in case of large amounts of MSU deposits, the MSU crystals were preserved and remained demonstrable in aqueous formaldehyde solution fixed tissues, stained with HE.
In unstained sections viewed with polarized light the great amounts of MSU crystals of swart natural color retained (Figure 1g-i), and were arranged in characteristic bundles, or sporadically as globules (Figure 1j-o).
The size of needle-shaped MSU crystals ranged from smaller to 40 µm with the polarization microscope. Under polarized light using Red I compensator the needle shaped crystals showed an intensive negative birefringence according to the long axis (Figure 1j-o).
Typically, the MSU deposits in gouty tophi were not accompanied by amorphous calcium phosphate [Ca3(PO4)2] and/or calcium carbonate [CaCO3] deposits, in contrast to HA and/or CPPD crystal depositions. Chondroid-, osteoid- or new bone formation was not detected in association with MSU deposits.
In our patient cohort calcium pyrophosphate dihydrate (CPPD – [Ca2P2O7.2H2O]) crystal deposits were found in 1 patient with gout; histologically co-existent gout and chondrocalcinosis was diagnosed. Gout was associated with rheumatoid arthritis (rheumatoid nodules) in 3 patients.
MSU and calcium hydroxyapatite (HA – [Ca5(PO4)3(OH)]) crystal combination was not detected; co-existent metabolic diseases such as apatite rheumatism or primary synovial chondromatosis were not seen in combination with tophaceous gout.
Comparative Analysis of Conventional Methods and Non-Staining Technique
Comparative analysis of conventional methods with the non-staining technique was performed on 105 of 211 serially sectioned tissue samples of 146 patients with gout; only the formaldehyde fixed tissue samples were examined, the alcohol fixed tissue samples were excluded. Regarding the location of the surgical excision the elbow was the most common site (n=50), followed by the small joints of the hand (n=12), the hallux (n=5), and the heel (n=3). In 35 cases of 105 tissue samples, the location of the tissue samples could not be determined.
In HE stained tissue sections MSU crystals were detected in 24 (22.86 % of 105), and were absent in 81 sections (77.14 % of 105).
In these 81 “urate negative” sections stained with HE, MSU crystals were demonstrable in 59 unstained tissue sections (72.84 % of 81).
With Gömöri’s methenamine silver method MSU crystals were found in 59 tissue sections (56.19 % of 105), and were not seen in 46 (43.81 % of 105).
In these 46 Gömöri negative tissue sections MSU crystals were seen in 24 with the non-staining technique (52.17 % of 46).
With the Schultz staining, MSU crystals were identified in 66 (62.86 % of 105), and were not in 39 (37.14 % of 105) tissue sections.
In the 39 negative tissue section stained according to Schultz, MSU crystals were present in 17 unstained sections (43.59 % of 39).
According to Schultz’s staining the MSU crystals and/ or the not crystalline uric acid together were present n 81 tissue sections (77.14 % of 105), and were not in 24 (22.86 % of 105).
According to Schultz’s staining the 24 negative MSU and/ or not crystalline uric acid tissue sections (n=24) showed MSU positivity in 12 with non-staining technique (50.0 % of 24) (the non-crystalline uric acid without birefringence is not visible in unstained sections under polarized light).
In contrast with the classic stains and reactions the non- staining technic of Bély and Apáthy’s was more effective, MSU crystals were demonstrated in 83 (79.05 % of 105) tissue sections, and were absent only in 22 (20.95 % of 105).
In these negative unstained sections MSU crystals were not found by HE, according to Schultz staining or by Gömöri methenamine-silver method.
Table 3 summarizes the prevalence of MSU crystals in tissue sections of patients with gout, stained by conventional staining’s and reaction in comparison with Bély and Apáthy’s “non-staining” technique, furthermore the level of significance (“p” values) between different staining’s and techniques.
| MSU/Uric acid n (% of 105) | Gömöri MSU | Schultz MSU | Schultz MSU + Uric acid | Bély and Apáthy MSU | |
|---|---|---|---|---|---|
| HE MSU [6] versus | 24 (22.86 of 105) | c=1.0 χ2=22.004 p<0.0000 | c=1.0 χ2=16.379 p<0.0000 | c=1.0 χ2=7.614 p<0.0058 | c=1.0 χ2=6.688 p<0.0097 |
| Gömöri MSU [6,7] versus | 59 (56.19 of 105) | c=1.0 χ2=75.999 p<0.0000 | c=1.0 χ2=36.999 p<0.0000 | c=1.0 χ2=32.867 p<0.0000 | |
| Schultz MSU [8,9] versus | 66 (62.86 of 105) | c=1.0 χ2=43.7548 p<0.0000 | |||
| Schultz [8,9] MSU + Uric acid versus | 81 (77.14 of 105) | c=0.7531 χ2=15.849 p<0.0000 | |||
| Bély and Apáthy MSU [1-5] | 83 (79.05 of 105) |
Table 3: The prevalence of MSU crystals and uric acid in tissue sections of patients with gout and the statistical difference (“p
Remarks to Table 3 In the comparative study of patients with gout only 105 tissue samples was examined, and only the presence of crystals was registered; the amount of crystal deposits was not estimated, and was not compared.
All tissue samples were fixed in an 8% aqueous solution of formaldehyde at pH 7.6 for >24 hours at room temperature (20 Co) and embedded in paraffin, alcohol fixed tissue samples with known clinical diagnosis of gout were excluded).
Schultz’s staining is specific for MSU crystals [NaC5H3N4O3·H2O], non-crystalline uric acid [C5H4N4O3], and cholesterol crystals [C27H46O].
The Gömöri or Schultz stains were more effective in the detection of MSU than HE, and the non-staining technique of Bély and Apáthy’s was much more sensitive than all of these.
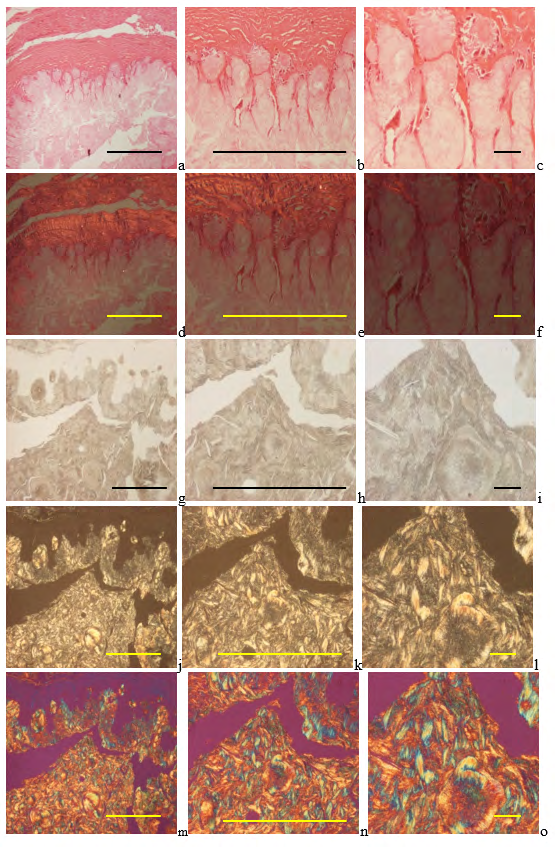
Figure 1a-o: Demonstrates a characteristic gouty tophus with MSU crystals deposits.
Gouty arthritis (tophaceous gout), MSU [NaC5H3N4O3·H2O] – monosodium salt of uric acid [C5H4N4O3] crystal deposits, surrounded by fibrous connective tissue, without remarkable inflammatory reaction.
Tissue samples were fixed in an 8% aqueous formaldehyde solution, stained with HE, and viewed with the light microscope, and under polarized light, respectively.
MSU crystals are not demonstrable.in this characteristic tophus of conventionally processed tissue sections, the crystals dissolved in the aqueous formaldehyde solution and/or during the water-based HE staining. (a) HE, viewed with the light microscope, scale bar: 1000 [µm], magnification: ×40, (b) same as (a) scale bar: 1000 [µm], magnification: ×100; (c) same as (a) scale bar: 100 [µm], magnification: ×200 (d) HE, viewed under polarized light, same as (a), scale bar: 1000 [µm], magnification: ×40, (e) same as (d) scale bar: 1000 [µm], magnification: ×100; (f) same as (d) scale bar: 100 [µm], magnification: ×200 MSU crystals are retained in unstained sections, viewed with the light microscope, showing a natural swart color.
(g) Unstained section, viewed under polarized light, same tissue sample as (a), scale bar: 1000 [µm], magnification: ×40, (h) same as (g) scale bar: 1000 [µm], magnification: ×100; (i) same as (g) scale bar: 100 [µm], magnification: ×200 MSU crystals in unstained sections viewed under polarized light without Red I. compensator, and using Red I. compensator, respectively.
MSU crystals show strong and negative birefringence. (j) MSU crystals, unstained section, viewed under polarized light, same field as (g) , scale bar: 1000 [µm], magnification: ×40, (k) same as (j) scale bar: 1000 [µm], magnification: ×100; (l) same as (j) scale bar: 100 [µm], magnification: ×200 (m) MSU crystals, unstained section, viewed under polarized light, using Red I compensator, same field as (g), scale bar: 1000 [µm], magnification: ×40, (n) same as (m) scale bar: 1000 [µm], magnification: ×100; (o) same as (m) scale bar: 100 [µm], magnification: ×200 The color of MSU crystals was green brown with the Schultz staining (Figure 2a-c), and were black (Figure 2g-i) with Gömöri’s methenamine-silver reaction.
In thin (2-3 µm) tissue sections the MSU crystals remained visible as birefringent needles under polarized light; the intensive staining did not cover completely the crystalline structure (Figure 2d-f and j-l).
![Figure 2: Gouty arthritis (tophaceous gout), MSU [NaC5H3N4O3·H2O] – monosodium salt of uric acid [C5H4N4O3] crystal deposits, surrounded by fibrous connective tissue, without remarkable inflammatory reaction.](/fulltextimages/13772/fig_2.png)
Tissue sample were fixed in an aqueous formaldehyde solution, and stained according to Schultz [8, 9]. (a) Schultz’s staining, viewed with the light microscope, scale bar: 1000 [µm], magnification: ×40, (b) same as (a) scale bar: 1000 [µm], magnification: ×100; (c) same as (a) scale bar: 100 [µm], magnification: ×200 (d) Schultz’s staining, viewed under polarized light, same as (a), scale bar: 1000 [µm], magnification: , scale bar: 1000 [µm], magnification: ×40, (e) same as (d) scale bar: 1000 [µm], magnification: ×100; (f) same as (d) scale bar: 100 [µm], magnification: ×200 Tissue sample fixed in an aqueous formaldehyde solution, and stained according to Gömöri [6, 7]. (g) Gömöri’s methenamine silver reaction, viewed with the light microscope, same field as (a), scale bar: 1000 [µm], magnification: ×40, (h) same as (g) scale bar: 1000 [µm], magnification: ×100; (i) same as (g) scale bar: 100 [µm], magnification: ×200 (j) Gömöri’s methenamine silver reaction, viewed under polarized light, same tissue sample as (g), scale bar: 1000 [µm], magnification: ×40, (k) same as (j) scale bar: 1000 [µm], magnification: ×100; (l) same as (j) scale bar: 100 [µm], magnification: ×200 Microscopic characteristics of HA (hydroxyapatite [Ca5(PO4)3(OH)]) crystal deposits in patients with clinically diagnosed apatite rheumatism (The chemical formula of HA is not uniform in the pertinent literature: [Ca5(PO4)3(OH)] or [Ca10(PO4)6OH2]) Nine (9) surgeries or joint interventions occurred in 4 patients with clinically diagnosed AR; the most commonly involved joint was the knee in 5 (55.55 %), followed by the shoulder in 3 (33.33 %) (including 2 punctions of the shoulder), and the hip in 1 (11.11 %) of the 9 cases.
During surgeries of these 4 patients 16 specimens were removed, the synovial membrane 7 of 16 samples (43.75), joint capsule 5 (31.25 %), bone and/or cartilage 2 (12.50 %), and bursa 2 (12.50 %) samples (Table 4).
The small and very soluble HA crystals with weak birefringence were not visible in HE stained tissue section (Figure 3).
HA crystals were accompanied typically with amorphous calcium phosphate [Ca3(PO4)2] and/or calcium carbonate [CaCO3] deposits, which were blue-violet with HE (Figure 3 a-c), orange with Alizarin red S staining (specific for calcium), and black with the von Kossa reaction (specific for phosphate and/or carbonate).
Evaluated by our semiobjective core system the average amount of amorphous mineral deposit was 1.063 per tissue samples.
Only minimal chondroid formation was detected (average 0.063 per tissue sample), osteoid or new bone was not found (Table 4).
![Figure 3: Hydroxyapatite arthropathy (Milwaukee syndrome, apatite rheumatism) induced by hydroxyapatite [Ca5(PO4)3(OH)] (HA) accompanied with amorphous calcium phosphate [Ca3(PO4)2] and/or calcium carbonate [CaCO3] deposits.](/fulltextimages/13772/fig_3.png)
The readily soluble weakly birefringent small HA crystals are not detected in conventionally fixed tissue specimens stained with HE, only the accompanying amorphous calcium phosphate [Ca3(PO4)2] and/or calcium carbonate [CaCO3] deposits are visible as blue-violet deposits.
(a) HE, viewed with the light microscope, scale bar: 1000 [µm], magnification: ×40, (b) same as (a) scale bar: 1000 [µm], magnification: ×100; (c) same as (a) scale bar: 100 [µm], magnification: ×200 (d) HE, viewed under polarized light, same as (a), scale bar: 1000 [µm], magnification: ×40, (e) same as (d) scale bar: 1000 [µm], magnification: ×100; (f) same as (d) scale bar:
100 [µm], magnification: ×200 In unstained tissue sections, using a professional polarizing microscope with high, at least 100-Watt brightness, the small and very soluble HA prisms were visible in 10 of 16 (62.50 %) tissue samples, accompanied with CPPD crystals in 9 (56.25 %) cases; the HA crystals were present without CPPD crystals in the joint capsule of one patient (Table 4).
HA crystal prisms showed a weak positive, CPPD crystals a strong positive birefringence viewed by polarized light with Red I compensator (100x) (Figure 4).
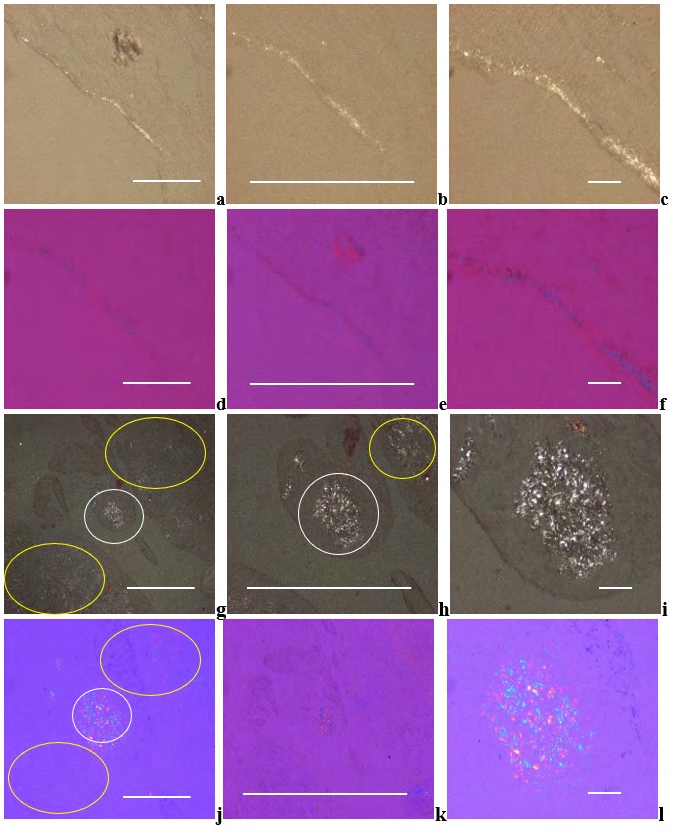
The HA crystals are colorless, translucent small (50-500 nm) rod-shaped prisms. Under polarized light the birefringence of HA crystals is weak.
(a) HA crystals, unstained sections, viewed under polarized light, scale bar: 1000 [µm], magnification: ×40, (b) same as (a) scale bar: 1000 [µm], magnification: ×100; (c) same as (a) scale bar: 100 [µm], magnification: ×200 (b) Under polarized light with Red I. compensator the birefringence of HA crystals is positive. (d) HE, viewed under polarized light, with Red I. compensator, same as (a), scale bar: 1000 [µm], magnification: ×40, (e) same as (d) scale bar: 1000 [µm], magnification: ×100; (f) same as (d) scale bar: 100 [µm], magnification: ×200 Apatite rheumatism, right shoulder, synovial membrane, HA (white ellipse) and CPPD (yellow ellipse) crystal deposits.
Under polarized light the birefringence of CPPD is stronger, compared to the HA crystals. (g) HA and CPPD crystals, unstained sections, viewed under polarized light, scale bar: 1000 [µm], magnification: ×40, (h) same as (g) scale bar: 1000 [µm], magnification: ×100; (i) same as (g) scale bar: 100 [µm], magnification: ×200 Under polarized light, with Red I. compensator, the direction of birefringence is positive according to the long axis of HA and CPPD crystals.
(j) HA and CPPD crystals, unstained sections, with Red I. compensator, same as (g), scale bar: 1000 [µm], magnification: ×40, (k) same as (j) scale bar: 1000 [µm], magnification: ×100; (l) same as (j) scale bar: 100 [µm], magnification: ×200 The individual small HA crystals formed clusters or aggregate of clusters. (in size of 100 µm or larger).
The 100 µm or larger clusters or aggregate of clusters were visible with an objective even of 40x magnification with non-staining techniques (Figure 5a-f).
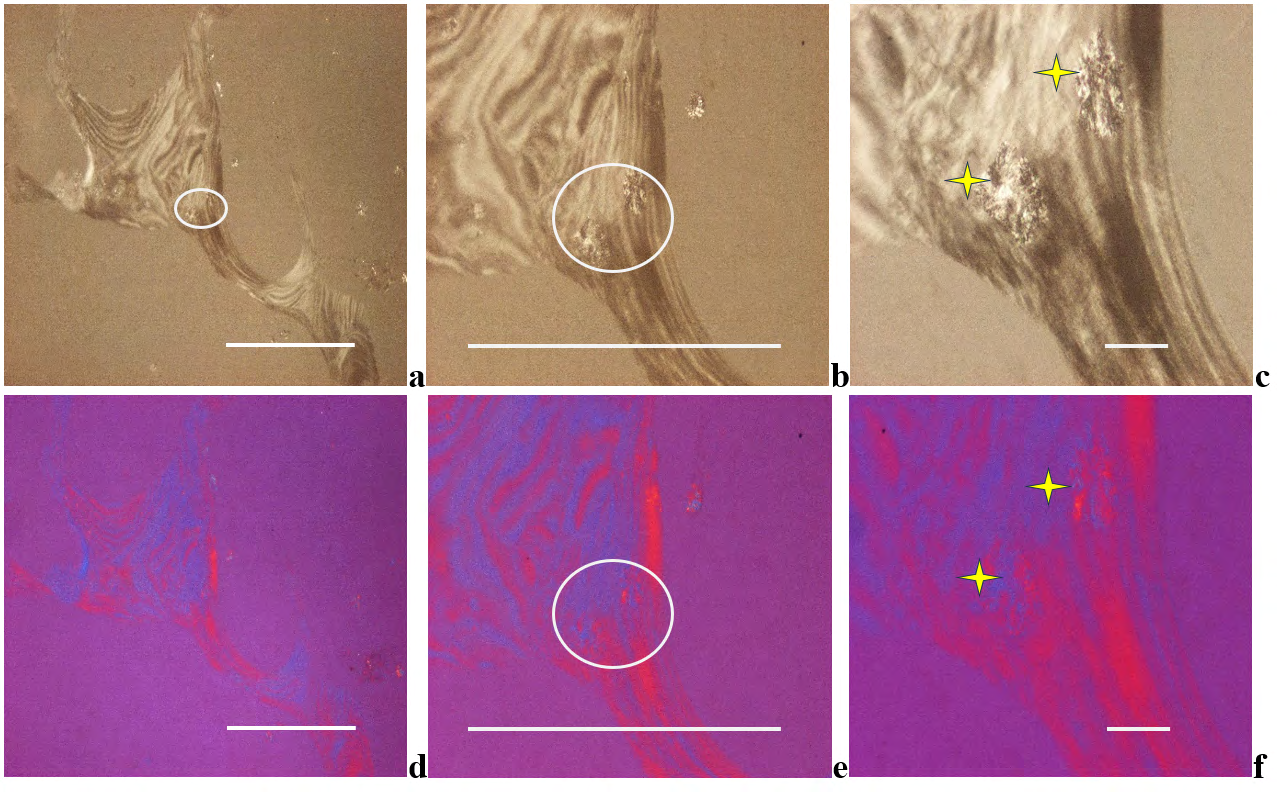
Figure 5a-f: Apatite rheumatism, right shoulder, subchondral bone.
The small prisms of HA crystals are arranged in larger spheroid microaggregates (white ellipses and yellow stars).
Under polarized light birefringence is positive according to the long axis of HA crystals, like that of collagen fibers.
(a) HA crystals, unstained sections, viewed under polarized light, scale bar: 1000 [µm], magnification: ×40, (b) same as (a) scale bar: 1000 [µm], magnification: ×100; (c) same as (a) scale bar: 100 [µm], magnification: ×200 Under polarized light with Red I. compensator the birefringence of HA crystals is positive. (d) HE, viewed under polarized light, with Red I. compensator, same as (a), scale bar: 1000 [µm], magnification: ×40, (e) same as (d) scale bar: 1000 [µm], magnification: ×100; (f) same as (d) scale bar: 100 [µm], magnification: ×200
Microscopic Characteristics of CPPD (calcium pyrophosphate dihydrate [Ca2P2O7.2H2O]) Crystal Deposits in Patients with Clinically Diagnosed Chondrocalcinosis
Sixteen (16) patients were operated with clinically diagnosed Ch-C; the most commonly involved joint was the knee in 8 (50.0 %), followed by the hip in 4 (25.0 %), wrist in 2 (12.50 %), elbow in 1 (6.25 %), and shoulder in 1 (6.25 %) of the 16 cases.
During surgeries of these 16 patients 40 specimens has been removed, synovial membrane 15 of 40 samples (37.50 %), joint capsule 15 (37.50 %), bone and/or cartilage 5 (12.50 %), bursa 3 (7.50 %), and tendon 2 (5.0 %) (Table 4).
CPPD crystals were less soluble in the 8%aqueous formaldehyde solution or water containing dyes than HA crystals, and occasionally remained back and were demonstrable with polarized light in tissue sections stained with HE, Alizarin red S or with the von Kossa reaction (Figure 6a-f and Figure 7a-l, Table 4).
CPPD crystals appeared typically as planes of hexagonal, rhomboid, trapezoid, parallelogram-shape or fragments of these (Figure 6g-l). Their size varied less than 40 µm.
In unstained tissue section the CPPD crystals showed a relative strong positive birefringence viewed by polarized light using Red I compensator, compared to the weak positive birefringence of the HA crystals (Figure 6g-l versus 4a-l and Figure 7xxxxl).
CPPD crystals were accompanied in all cases by more or lesser amounts of amorphous calcium phosphate [Ca3(PO4)2] and/or calcium carbonate [CaCO3] deposits, appeared blue-violet with HE (Figure 6a-f), orange with Alizarin red S staining (Figure 8a-f) and black with the von Kossa reaction (Figure 8g-l).
According to our semi-objective score system in Ch-C patients the average mineral deposition was 1.054 per tissue sections (Table 4). In some cases, the massive amorphous (non-birefringent) minerals masked the crystals, which remained intact with Alizarin red S stain or with von Kossa’s reaction (Figure 8a-f and Figure 8g-l).
Only minimal chondroid formation was detected (average 0.054 per tissue sample), osteoid or new bone was not found (Figure 6a-f and Table 4).
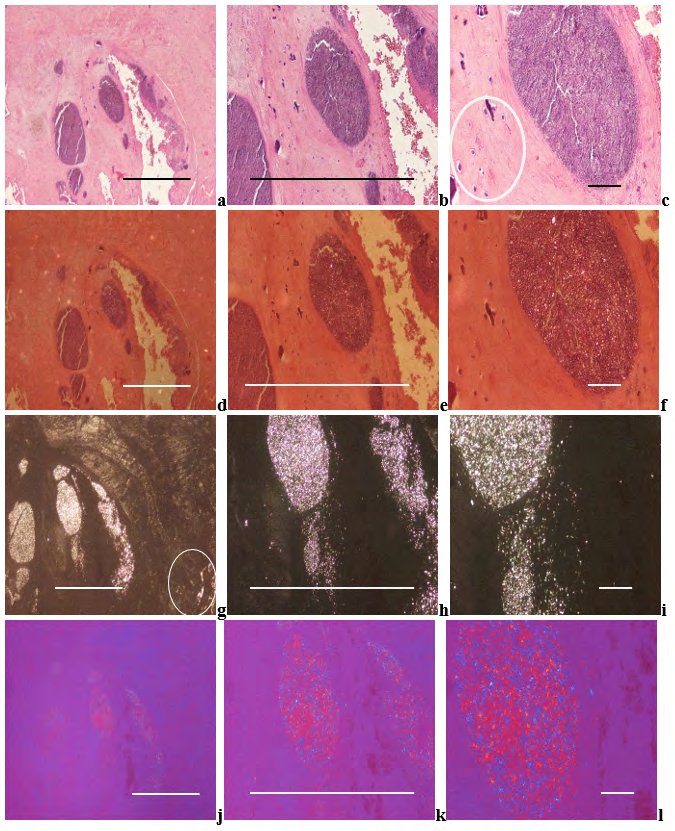
Figure 6a-l: Chondrocalcinosis (pseudogout, pyrophosphate arthropathy, calcium pyrophosphate dihydrate [Ca2P2O7.2H2O] (CPPD) crystal induced arthropathy, viewed with the light microscope and under polarized light, respectively.
CPPD crystals and crystal fragments are accompanied by amorphous calcium phosphate, or calcium carbonate deposits of blue-violet color of HE stained tissue sections. Minimal chondroid formation can be seen next to the amorphous mineral deposits (white ellipse) The less soluble CPPD crystals may remain back and are demonstrable with polarized light in tissue sections stained with HE (Figure 6a-f), Alizarin red S (see below Figure 7a-f) or with the von Kossa reaction (Figure 7g-l).
(a) HE, viewed with the light microscope, scale bar: 1000 [µm], magnification: ×40, (b) same as (a) scale bar: 1000 [µm], magnification: ×100; (c) same as (a) scale bar: 100 [µm], magnification: ×200 (d) HE, viewed under polarized light, same as (a), scale bar: 1000 [µm], magnification: ×40, (e) same as (d) scale bar: 1000 [µm], magnification: ×100; (f) same as (d) scale bar:
100 [µm], magnification: ×200 CPPD plane crystals are of hexagonal, rhomboid, trapezoid, parallelogram-shape or fragments of these, they range in size from smaller to 40μm, and show a relatively strong positive birefringence according to the long axis of the crystals with Red I. compensator.
(g) CPPD and HA (white ellipse) crystals, unstained sections, viewed under polarized light, same as (a), scale bar: 1000 [µm], magnification: ×40, (h) same as (g) scale bar: 1000 [µm], magnification: ×100; (i) same as (g) scale bar: 100 [µm], magnification: ×200 (j) CPPD and HA crystals, unstained sections, viewed under polarized light, with Red I. compensator, same as (g), scale bar: 1000 [µm], magnification: ×40, (k) same as (g) scale bar: 1000 [µm], magnification: ×100; (l) same as (g) scale bar: 100 [µm], magnification: ×200
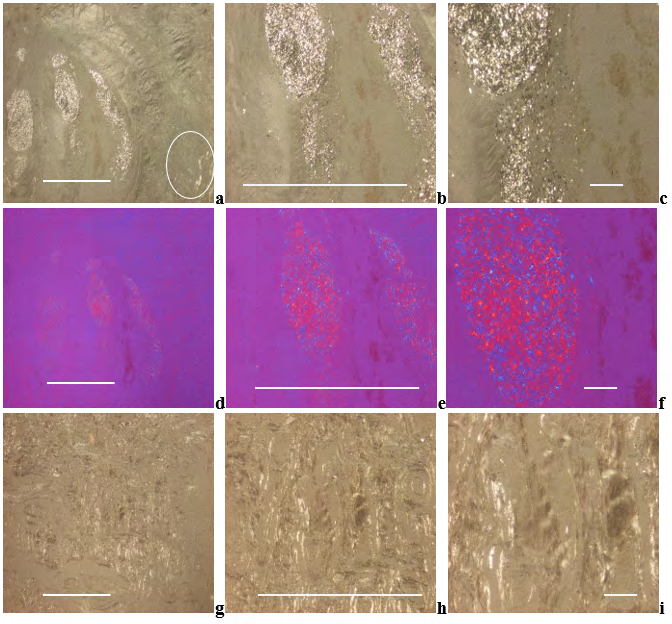
Figure 7a-l: Chondrocalcinosis, CPPD and HA crystal induced arthropathy, viewed with the light microscope and under polarized light, respectively.
(a) CPPD and HA (white ellipse) crystals, unstained sections, viewed under polarized light, scale bar: 1000 [µm], magnification: ×40, (b) same as (a) scale bar: 1000 [µm], magnification: ×100; (c) same as (a) scale bar: 100 [µm], magnification: ×200 (d) CPPD and HA crystals, unstained sections, viewed under polarized light, with Red I. compensator, same as (a), scale bar: 1000 [µm], magnification: ×40, (e) same as (d) scale bar: 1000 [µm], magnification: ×100; (f) same as (d) scale bar: 100 [µm], magnification: ×200
(g) HA crystals, unstained sections, viewed under polarized light, scale bar: 1000 [µm], magnification: ×40, (h) same as (g) scale bar: 1000 [µm], magnification: ×100; (i) same as (g) scale bar: 100 [µm], magnification: ×200
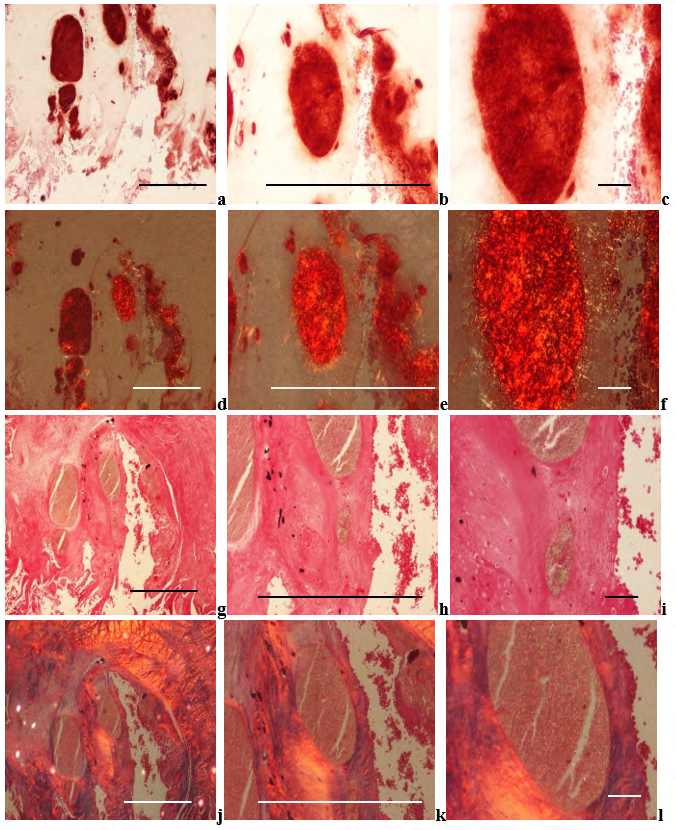
Figure 8a-l: Chondrocalcinosis (pseudogout, pyrophosphate arthropathy, calcium pyrophosphate dihydrate [Ca2P2O7.2H2O] (CPPD) crystal induced arthropathy), viewed with the light microscope and under polarized light, respectively.
Non-crystalline calcium containing mineral deposits are staining orange with calcium specific Alizarin red S. Alizarin red S does not stain the CPPD crystals, but staining of the massive deposits of amorphous minerals may mask the crystals, without detectable birefringence or only with weak intensity. (g) Alizarin red S, viewed with the light microscope, same as (a), scale bar: 1000 [µm], magnification: ×40, (h) same as (g) scale bar: 1000 [µm], magnification: ×100; (i) same as (g) scale bar: 100 [µm], magnification: ×200 (j) Alizarin red S, viewed under polarized light, same as (g), scale bar: 1000 [µm], magnification: ×40, (k) same as (j) scale bar: 1000 [µm], magnification: ×100; (l) same as (j) scale bar: 100 [µm], magnification: ×200 The non-crystalline amorphous mineral deposition starts with calcium, and the phosphate and/or carbonate appear later. In demonstrated (illustrated) stage the intensive orange color of calcium stained with the Alizarin red S is accompanied by negative or with minimal black staining with the von Kossa reaction.
(m) von Kossa reaction, viewed with the light microscope, same as (a), scale bar: 1000 [µm], magnification: ×40, (n) same as (m) scale bar: 1000 [µm], magnification: ×100; (o) same as (m) scale bar: 100 [µm], magnification: ×200 (p) Alizarin red S, viewed under polarized light, same as (m), scale bar: 1000 [µm], magnification: ×40, (q) same as (p) scale bar: 1000 [µm], magnification: ×100; (r) same as (p) scale bar: 100 [µm], magnification: ×200 In unstained tissue section, the large and less soluble CPPD crystals were visible in 22 of 40 (62.50 %) tissue samples, and were accompanied by HA crystals in all cases.
The HA crystals were present in 26 of 40 (56.25 %) cases; 4 of them without demonstrable CPPD crystals.
In 2 patients the HA crystals were not accompanied by CPPD crystals; in 2 joint capsules and in 2 bone and/or cartilage specimens CPPD crystals were not detected (Table 4).
Microscopic Characteristics of Clinically Diagnosed Primary Synovial Chondromatosis
Twenty-one (21) joints of 20 patients with clinically diagnosed and histologically confirmed prSynCh were operated; the most commonly involved joint was the knee in 14 (66.67 %), followed by the hip in 5 (23.81 %), and elbow in 2 (9.52 %) of the 21 cases (Table 4).
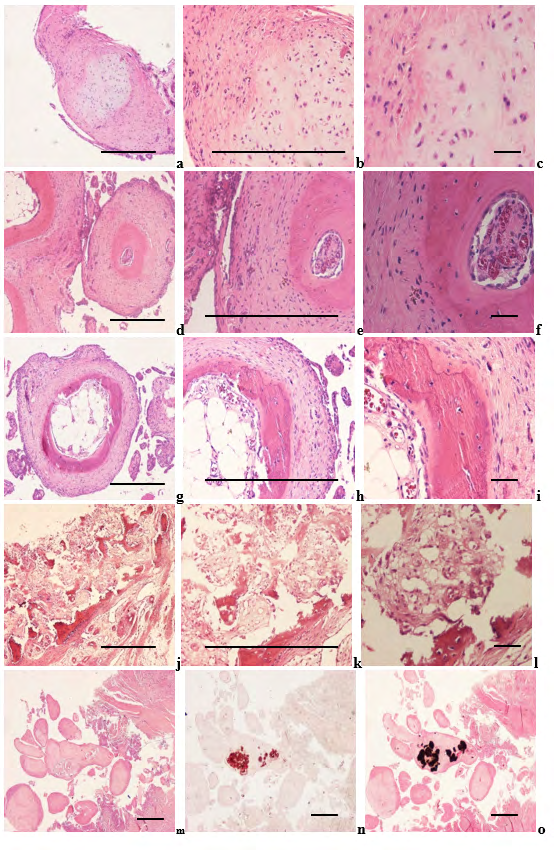
Figure 9a-l: Synovial osteo-chondromatosis, knee joint (2569-2008), synovial osteomatosis, elbow (1864-89), and synovial osteo-chondromatosis with minimal amorphous mineral deposits (1727-2016).
The histological diagnosis in 9 of 21 operated joints was chondromatosis (characterized by chondroid formation without osteoid or bone formation), in 11 osteo-chondromatosis (characterized by chondroid with osteoid and/or bone formation), and in 1 osteomatosis (characterized exclusively by bone formation) (Figure 9a-l).
True medullary spaces accompanied bone formation in 8 of 12 cases (with osteo-chondromatosis 11 or osteomatosis 1).
Different stages of chondroid, osteoid and/or bone formation existed side by side in the same histologic section.
During surgeries of these 21 joint 40 specimens has been removed, synovial membrane 15 of 40 samples (37.50 %), joint capsule 15 (37.50 %), bone and/or cartilage 5 (12.50 %), bursa 3 (7.50 %), and tendon 2 (5.0 %) (Table 4).
Chondroid and/or bone formation (with or without true medullary spaces) was abundant; calculated by our semi- objective score system the average chondroid and/or bone formation was 1.975 per tissue sections.
Chondroid and/or bone formation was accompanied by minimal amorphous mineral deposition (0.270 per tissue sections) Figure 9m-o.
In unstained sections of surgical specimens HA [Ca5(PO4)3(OH)] (Figure 10a-l), and CPPD [Ca2P2O7.2H2O] crystals were detected in all cases.
Synovial chondromatosis (a-c) osteo-chondromatosis with early stage of true medullary cavity formation (d-f), osteo-chondromatosis with advanced stage of true medullary cavity formation (g-i), and synovial osteomatosis, elbow (j-l).
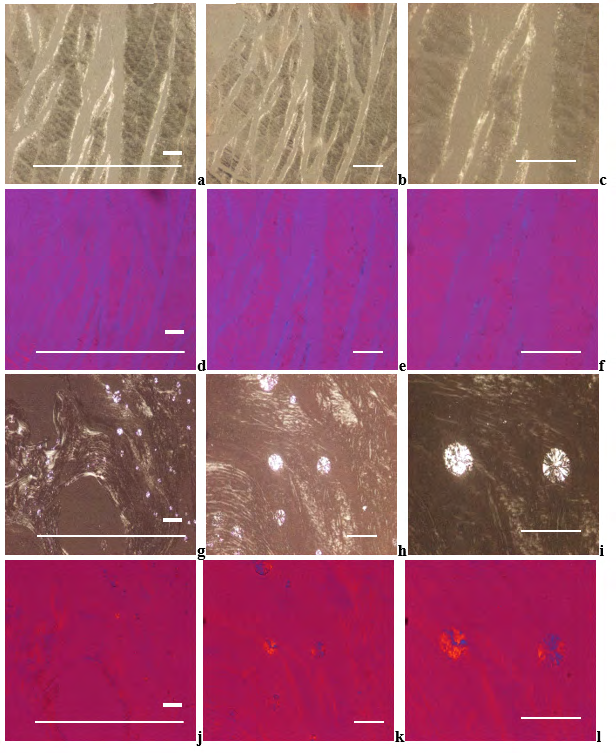
Figure 10a-l: Synovial osteo-chondromatosis, knee joint, joint capsule with HA crystal prisms, and pericapsular bone with HA crystal clusters.
(a) Synovial chondromatosis, HE, viewed with the light microscope, scale bar: 1000 [µm], magnification: ×40, (b) same as (a) scale bar: 1000 [µm], magnification: ×100; (c) same as (a) scale bar: 100 [µm], magnification: ×200 (d) Synovial osteo-chondromatosis with early stage of true medullary cavity formation HE, viewed with the light microscope, scale bar: 1000 [µm], magnification: ×40, (e) same as (d) scale bar: 1000 [µm], magnification: ×100; (f) same as (d) scale bar: 100 [µm], magnification: ×200 (g), Synovial osteo-chondromatosis with advanced stage of true medullary cavity formation HE, viewed with the light microscope, scale bar: 1000 [µm], magnification: ×40, (h) same as (g) scale bar: 1000 [µm], magnification: ×100; (i) same as (g) scale bar: 100 [µm], magnification: ×200 (j) Synovial osteomatosis, HE, viewed with the light microscope, scale bar: 1000 [µm], magnification: ×40, (k) same as (j) scale bar: 1000 [µm], magnification: ×100; (l) same as (j) scale bar: 100 [µm], magnification: ×200 Synovial osteo-chondromatosis with minimal amorphous mineral deposition, viewed with the light microscope. (m) HE, the section is practically negative, scale bar: 1000 [µm], magnification: ×20, (n) Alizarin red S, same as (m) scale bar: 1000 [µm], magnification: ×20; (o) von Kossa reaction, same as (m) scale bar: 100 [µm], magnification: ×20 The small prisms of HA crystals are arranged in larger spheroid microaggregates. Under polarized light the direction of birefringence is positive according to the long axis of HA crystals, like that of collagen fibers.
Joint capsule, the small prisms of HA crystals prisms are located on, and between collagen fibers. (a) HA crystals, unstained sections, viewed under polarized light, the ratio of scale bars: 100:1000 [µm], magnification: x100, (b) same as (a) scale bar: 100 [µm], magnification: x200, (c) same as (a), scale bar: 100 [µm], magnification: x400. (d) HA crystals, unstained sections, viewed under polarized light, using Red I compensator, same as (a), the ratio of scale bars: 100:1000 [µm], magnification: x100, (e) same as (d) scale bar: 100 [µm], magnification: x200, (f) same as (d), scale bar: 100 [µm], magnification: x400. (g) Pericapsular bone, HA crystal clusters, unstained sections, viewed with the light microscope, the ratio of scale bars: 100:1000 [µm], magnification: ×100; (h) same as (g) scale bar: 100 [µm], magnification: ×200, (i) same as (g), scale bar: 100 [µm], magnification: x400. (j) HA crystals, unstained sections, viewed under polarized light, using Red I compensator, same as (g), the ratio of scale bars: 100:1000 [µm], magnification: x100, (k) same as (j) scale bar: 100 [µm], magnification: x200, (l) same as (j), scale bar: 100 [µm], magnification: x400.
Comparative Analysis of Apatite Rheumatism, Chondrocalcinosis and Primary Synovial Chondromatosis with Non-Staining Technique and with Conventional Methods
The comparative analysis was performed on 73 unstained tissue samples of 28 patients with the clinical diagnosis of apatite rheumatism, chondrocalcinosis or primary synovial chondromatosis (Table 4) Amorphous calcium phosphate [Ca3(PO4)2], and/or calcium carbonate [CaCO3] deposits were appraised in 90 tissue sections of 40 patients (Table 4) The chondroid, osteoid and/or bone formation was evaluated in 96 tissue sections of 40 patients (Table 4).
Table 4 summarizes the prevalence of HA and CPPD crystals in 73 unstained sections, the amount of amorphous mineral deposits in 90 tissue sections stained by HE, Alizarin red S and/or von Kossa reaction furthermore the extent of chondroid, osteoid and/or bone formation in 96 HE stained tissue section of patients.
Table 4 Distribution of HA and CPPD crystals, amount of amorphous mineral deposits, furthermore extent of chondroid, osteoid and/or bone formation in patients with clinically diagnosed AR, Ch-C or prSynCh
| Clinical diagnosis | Synovial membrane | Capsule | Bursa | Tendon | Bone and/or Cartilage | ∑ of Ts | Calc | Calc / Ts | Ch/Bone | Ch/Bone / Ts |
|---|---|---|---|---|---|---|---|---|---|---|
| Surgical specimens | ||||||||||
| Apatite rheumatism | 17/16 | Jan-16 | ||||||||
| N of Ts of 4 pts. | 7 | 5 | 2 | 0 | 2 | 16 | 17 | 1,063 | 1 | 0,063 |
| HA positivity | 7 | 1 | 2 | 0 | 0 | 10 | ||||
| in % | 100,00 | 20,00 | 100,00 | 0,00 | 0,00 | 62,50 | ||||
| CPPD positivity | 7 | 0 | 2 | 0 | 0 | 9 |
The prevalence of HA and/or CPPD was determined with polarized light in 73 unstained tissue sections of 28 patients.
16 tissue sections of 4 patients with clinical diagnoses of AR, 40 tissue sections of 16 patients with clinical diagnoses of Ch-C, and 17 tissue sections of 8 patients with clinical diagnoses of prSynCh were analyzed in unstained sections with polarized light.
Patients with gout are not tabulated; HA and/or CPPD crystals were not associated with MSU (except CPPD in one patient).
MSU crystals were not accompanied by amorphous mineral deposits, and chondroid, osteoid or bone formation.
The most commonly involved joint structures of patients with AR, Ch-C, and prSynCh were the synovial membranes in 30 (41.10 %), followed by the capsules in 28 (38.36 %), bone and/or cartilage in 8 (10.96 %), bursae in 5 (6.85 %), and tendons in 2 (2.74 %) of 73 cases.
1* Calcification was determined in 37 of 40 HE stained tissue sections of 16 patients with Ch-C; 3 of 40 tissue samples were not available for serial sections (the specimens were too small for further serial sections).
2* Chondroid, osteoid and/or bone formation was determined in 40 HE stained tissue sections of 16 patients with Ch-C.
3* Prevalence of HA and CPPD crystals was determined only in 17 unstained tissue sections of 8 patients with prSynCh.
4* Calcification was evaluated in 37 HE of 40 HE stained tissue sections of 20 patients with prSynCh (3 tissue samples were not available for histological analysis).
5* Chondroid, osteoid and/or bone formation was evaluated in 40 HE stained tissue sections of 20 patients with prSynCh.
prSynCh – primary Synovialis Chondromatosis
Ts – Tissue sample
Calc – Calcification (amount of calcium phosphate [Ca3(PO4)2] and/or calcium carbonate [CaCO4])
Ch/Bone – Chondroid, osteoid or Bone formation
Discussion
Gouty tophus is characterized by deposits of identical MSU [NaC₄H₆N₄O₄₃H₂O] crystals arranged in bundles, and occasionally in globs. Gout is generally considered an independent metabolic entity [16 – 18].
Apatite rheumatism (apatite rheumatism, apatite rheumatism, hydroxyapatite arthritis, calcifying tenosynovitis, Milwaukee syndrome, frozen shoulder, calcific tendinitis) is a HA [Ca₅(PO₄)₃(OH)] crystal induced maverick metabolic disease, while chondrocalcinosis (pseudogout, calcific gout, polyarticular chondrocalcinosis, pyrophosphate arthropathy) is thought to be a CPPD [Ca₂P₂O₇.2H₂O] crystal induced sovereign metabolic disorder.
These diseases are regarded as different clinical entities [16, 17, 18, 19, 20, 21, 22, 23, 24, 25, 26, 27], although the clinical symptoms are the same, the most frequently affected joints overlap, and there is currently no difference in treatment [27, 28, 29, 30].
The mean age of the patients with the clinical diagnosis of gout (53.97 year) and prSynCh (50.20 year) was low at the time of operation in comparison with AR (50.20 year) or Ch-C, (63.67 year) probably caused by the more destructive MSU crystals, and by the synovial calcified and/or ossified loose bodies.
The differences between G and AR (p< 0.0117) or G and Ch-C (p< 0.0225) were significant.
There was no significant difference in mean age between patient cohorts with AR and Ch-C (p< 0,844), which raises the possibility that AR and Ch-C represent the same metabolic disorder.
In contrast with to gout, the almost constant presence of HA and CPPD crystals in AR, Ch-C or prSynCh raises the probability that these are related metabolic diseases [31] (Table 4).
The HA and CPPD crystal deposits were characterized by abundant amorphous calcium phosphate [Ca3(PO4)2] and/or calcium carbonate [CaCO3] deposition of our patients with AR or Ch-C, while the amorphous mineral deposition was rare and minimal in prSynCh (Table 4).
In contrast to the rare and minimal amorphous mineral deposition in our patients with prSynCh, chondroid and/or osteoid formation was abundant.
We consider amorphous calcium deposition a first-line response, and chondroid and/or osteoid formation a second- line defense mechanism in response to the crystals, reducing or moderating inflammation.
The inflammatory reaction is inhibited or moderated by amorphous minerals in AR or Ch-C, and inhibited or moderated by chondroid, osteoid and/or bone formation in prSynCh.
In our view the prSynCh is a defective variant of HA and CPPD induced metabolic disorders, where the deficient mineralization is replaced by chondroid and/or bone formation.
These abilities may be determined by genetic or other, unidentified factors, respectively influenced by intrinsic and/or extrinsic causes.
All crystal induced arthropathies are progressive maladies characterized by cumulative deposition of MSU, HA, CPPD or other here not discussed crystals (cholesterol, lipid liquid, etc.).
In the early stage of crystal induced arthropathies the deposition of crystals involves only a few structures in some joints, and increasingly more in the later stages of the disease.
According to the Wald sequence analysis [32], the “most common deposit is the earliest deposit”.
MSU, HA, CPPD crystal deposition starts on the most frequently involved structures of the most frequently involved joints [5, 14]. This is a fundamental rule of all crystal induced arthropathies characterized by progressive cumulative deposition of crystals.
In gout the elbow (n=50) was the most common localization of tophus, followed by the small joints of the hand (n=12), by the hallux (n=5), and by the heel (n=3).
According to the rule of progressive cumulative processes the tophaceous gout with clinical symptoms started in the elbow of our patient cohort, and because of the clinical symptoms these patients were operated first.
In patients with clinically diagnosed AR, Ch-C, and prSynCh the most commonly involved joint was the knee in 27 (58.69 %), followed by the hip in 10 (21.74 %), shoulder in 4 (8.69 %), elbow in 3 (6.52 %), and wrist in 2 (4.35 %) of 46 surgeries.
Deposition of HA and CPPD crystals involved the joints in this order. Regarding the tissue structures of the joints, the most commonly involved tissues were the synovial membranes 30 (41.10 %), followed by the capsules 28 (38.36 %), bone and/ or cartilage 8 (10.96 %), bursae 5 (6.85 %), and tendons 2 (2.74 %) (Table 4).
Based on these data our assumption is that crystal deposition begins in all three metabolic maladies in the synovial membrane of the knee, succeeded by other structures and other joints.
Unstained sections of 73 surgical samples of 37 patients showed more frequent, and more marked HA crystal deposition than CPPD crystal deposition; HA crystals were present in 48 (65.75 %), while CPPD only in 43 (58.90 %) of 73 tissue samples (Table 4).
In our patients with clinically diagnosed AR, Ch-C or prSynCh the crystal deposition appears to have begun with HA crystal deposition, followed by CPPD deposition.
For the reliable demonstration of HA and CPPD crystals a professional high brightened polarization microscope is needed.
Conclusions
Gout is a distinct metabolic disease, caused by monomorphic MSU crystal deposits, while apatite rheumatism, chondrocalcinosis, and primary synovial chondromatosis are related metabolic disorders with HA and CPPD depositions.
The authors assume that AR and Ch-C are different stages of the same metabolic disorder, which differ from prSynCh in amorphous mineral production, furthermore in the production of chondroid, osteoid and/or bone.
prSynCh is a defective variant of HA and CPPD induced metabolic arthropathy with reduced mineralization capabilities, where the deficient mineralization is replaced by chondroid and/or bone formation.
The nonstaining technique of Bély and Apáthy proved to be a much more effective method for the demonstration of crystals in metabolic diseases than conventional stains and histochemical reactions.
References
-
Bély M, Apáthy A (2014) A Simple Method for the Microscopic Identification of Calcium Pyrophosphate Dihydrate and Hydroxyapatite Deposits in Metabolic and Crystal Induced Diseases. Annals of the Rheumatic Diseases 73 (S2): 1081.
-
Bély M, Apáthy A (2016) Calcium Pyrophosphate Dihydrate and Hydroxyapatite Crystal Induced Metabolic Diseases – Same or Different?. Annals of the Rheumatic Diseases 75: 1184.
-
Bély M, Apáthy A (2018) Metabolic Diseases and Crystal Induced Arthropathies Technic of Non-Staining Histologic Sections - A Comparative Study of Standard Stains and Histochemical Reactions. Clinical Archives of Bone and Joint Diseases 1: 007.
-
Bély M, Apáthy A (2018) Crystal deposits in tissue of patients with chondrocalcinosis and apatite rheumatism – Microscopic identification of CPPD and HA with the non-staining technique of Bely and Apáthy. BAOJ Clinical Trials 4.1: 018.
-
Bély M, Apáthy Á (2024) Crystal induced arthropathies—a comparative study of 40 patients with apatite rheumatism, chondrocalcinosis and primary synovial chondromatosis. Pathology and Oncology Research 30: 1611454.
-
Carson FL (1990) Mayer’s hematoxylin and Gömöri’s methenamine silver method for urates. In: Carson FL (Ed.), Histotechnology, ASCP Press, Chicago, USA, pp: 100-105.
-
Pearse AGE (1985) Hexamine silver method for uric acid. In: Histochemistry theoretical and applied, Churchill Livingstone, Edinburgh, London, Melbourne and New York, USA, pp: 1012-1026.
-
Schultz A (1931) Zur Frage der Beziehungen zwischen Leukämie und Gicht. Zugleich Mitteilung histologischer Darstellungsmethoden der Harnsaure und der Urate. Virchows Archiv für Pathologische Anatomie und Physiologie und für Klinische Medizin 280: 519-529.
-
Lillie RD (1954) Von Kóssa’s method and Uric acid and urates; Schultz staining. In Histpathologic technic and practical histochemistry, The Blakiston Division McGraw-Hill Book Company, New York, Toronto, London, UK, pp; 264-265.
-
McManus JFA, Mowry RW (1960) Methods of general utility for the routine study of tissues, “Sodium Alizarin sulfonate stain for calcium” and “Von Kossa’s method for phosphates and carbonates”. In: McManus JFA, Mowry RW (Eds.), Staining methods, histologic and histochemical. Hoeber PB Inc, New York, USA, pp: 55- 72.
-
Vacca LL (1985) Alizarin red S. In: Vacca LL (Ed.), Laboratory manual of histochemistry, Raven Press, New York, YSA, pp: 333-334.
-
Lillie RD (1965) Von Kóssa’s method. In: Lillie RD (Ed.), Histpathologic technic and practical histochemistry. The Blakiston Division McGraw-Hill Book Company, New York, Toronto, London, UK pp: 616-617.
-
Ohira T, Ishikawa K (2001) Preservation of calcium pyrophosphate dihydrate crystals: effect of Mayer’s haematoxylin staining period. Annals of the Rheumatic Diseases 60(1): 80-82.
-
Bély M, Apáthy Ά (2023) A comparative microscopic study of apatite rheumatism, chondrocalcinosis and synovial chondromatosis – HA and CPPD induced metabolic disorders. EC Pulmonology and Respiratory Medicine 12(6): 01-17.
-
Lentner C (1982) Statistical methods. In: Lentner C, Diem K, et al. (Eds.), Geigy scientific tables. Ciba-Geigy Limited, Basle, Switzerland 2: 227.
-
Mohr W (2000) Kalziumpirophosphat- Arthropathie, Apatitkrankheiten, Primäre synoviale Osteochondromatose. In: Mohr W (Ed.), Gelenkpathologie, historische Grundlagen, Ursachen und Entwicklungen von Gelenkleiden und ihre Pathomorphologie. Springer-Verlag, Berlin, Heidelberg pp: 193-201.
-
Gardner DL, McClure J (1992) Metabolic, nutritional and endocrine diseases of connective tissue, Synovial osteochondromatosis. In: Pathological basis of the connective tissue diseases. 1st (Edn.), Edward Arnold, London, Melbourne, Auckland, Great Britain, pp: 380- 393.
-
Fassbender HG (2002) Crystal-associated arthropathies. In: Pathology and pathobiology of rheumatic diseases. 2nd (Edn.), Springer-Verlag, Berlin, Heidelberg, New York, Germany, pp: 353-369
-
Reginato AM, Yuvienco C (2020) Hydroxyapatite Crystal-Induced Rheumatology.
-
Reginato AJ, Reginato AM (2001) Diseases associated with deposition of calcium pyrophosphate or hydroxyapatite. In: Ruddy SH, Harris ED, (Eds.), Crystal- associated synovitis, Section XV, Kelly’s Textbook of Rheumatology, 6th (Edn.), WB Saunders Company: A division of Harcourt Brace & Company, Philadelphia, London, New York, St. Louis, Sydney, Australia pp: 1377-1390.
-
Žitňan D, Sitaj Š (1963) Chondrocalcinosis articularis section L Clinical and radiological study. Annals of Rheumatic Diseases 22(3): 142-152.
-
McCarty DJ, Lehr RJ, Halverson PB (1983) Crystal population in human synovial fluid – identification of apatite, octoalcium phosphate, and tricalcium phosphate. Arthritis and Rheumatism 26(10): 1220- 1224.
-
Gupta SJ (2002) Crystal induced arthritis: an overview. Journal of Indian Rheumatology Association 10: 5-13.
-
Rosenthal AK, Ryan LM (2016) Calcium Pyrophosphate Deposition Disease. New England Journal of Medicine 374(26): 2575-2584.
-
Dieppe PA, Crocker P, Huskisson EC, Willoughby DA (1976) Apatite deposition disease. A new arthropathy. Lancet 307: 266-269.
-
Dieppe PA (1981) Milwaukee shoulder. British Medical Journal Clin Res Ed 283(6305): 1488-1489.
-
Rosenthal A, Dalbeth N, Romain PL (2024) Clinical manifestations and diagnosis of calcium pyrophosphate crystal deposition (CPPD) disease. UpToDate.
-
Bachmann D, Resnick D (1994) Calcium pyrophosphate dihydrate crystal deposition disease and Calcium hydroxyapatite crystal deposition disease. In: Radiological Atlas of Rheumatological Diseases. Editions Roche F, Bachmann D (Eds.), Hoffmann-La Roche Ltd., Basel, Switzerland, pp: 108-116.
-
(2022) Pseudogout.
-
Pálinkás M, Poór GY (2019) Kristályatrthritisek. In: Reumatológia, Medicina könyvkiadó Zrt. Budapest pp: 572.
-
Apáthy A, Bély M (2024) CPPD and Associated Crystals in Clinically Diagnosed Chondrocalcinosis: A Clinicopathological Study of 20 Patients. Journal of Orthopaedics and Clinical Research 2(1): 122-141.
-
Wald A (1947) Sequential analysis. Wiley Mathematical Statistics Series, Chapman & Hall, New York, USA.
- Return to Work Among Manual Workers After the Latarjet Procedure: A Cohort Study of 43 Patients
- Refractory Pelvic Collection Following Modified Stoppa Approach for Both-Column Acetabular Fracture Fixation: A Case Report
- Comparative Study of Dynamic Knee Phenotypes Under Loaded and Unloaded Conditions: Clinical Impact
- Locked Intramedullary Nailing of the Tibia Using a Humeral Nail: A Care Case Report
- Subtalar Dislocation: About a Case Report
- Surgical Site Infection in Orthopedics in a Country with LimitedResources: Indications, Treatment and Results