Fabrication and Characteristics of Villous Zinc Oxalate by using a Sol-Gel and Microbeam-Laser Method
Villous zinc oxalate (ZnC2O4) was successfully prepared from reduced graphene oxide (RGO) and zinc oxide using a two-precursor sol-gel method, and scanned using a matrix-dotted microbeam laser. Application of the laser caused the synthesized ZnC2O4 to melt and resolidify, forming uniformly spread nanovillous protrusions. The characteristics of the microstructures were examined using X-ray diffraction, energy dispersive X-ray analysis, field emission scanning electron microscopy, and Raman spectroscopy. Various ratios of RGO:ZnO were demonstrated to produce villous ZnC2O4; moreover, the structures of ï¡-ZnC2O4 and ï¢-ZnC2O4 were found to coexist in the sol-gel powders. ï¢-ZnC2O4 produces a villous shape because of a minute characteristic that favors the formation of such structures. The carbon from RGO is attracted through impurity sites, resulting in oversaturation with C/Zn at approximately the same ratio as that of RGO and ZnO because of the counter-ion effect between the cation and anion bonds.
Introduction
Zinc oxalate (ZnC2O4) is commonly used on etherification processes in industrial because of its selective catalytic effect. ZnC2O4 has an open structure with high coordination potential [1]; hence, its structures can be designed to interact with organic materials and form inorganic–organic composites. Its functions alter depending on the organic functional groups applied. Consequently, ZnC2O4 has several potential applications.
ZnC2O4 has an elongated tetrahedral geometry with two basic structures, namely α-ZnC2O4 and β-ZnC2O4 [1]. The crystal form of α-ZnC2O4 is triclinic. Each zinc ion coordinates with six oxygen atoms to form an octahedral structure, with four of the oxygen atoms derived from the two oxalate groups and the two other oxygen atoms from water molecules. The adjacent metal ions are linked in a one-dimensional chain structure, but through hydrogen bonding, the interchain is linked in a three-dimensional network structure. By contrast, the structure of β-ZnC2O4 is produced by the cation and anion chains, -C2O4-Zn-C2O4-Zn and Zn-O bonds. The octahedral structure formed by zinc cobonding is the optimal place for the insertion of impurities. Zn2C2O4 can be prepared using solid phase or liquid phase methods [2, 3, 4]. Zinc acetate (C4H6O4Zn) and oxalic acid are used to prepare ZnC2O4. Next, C4H6O4Znand oxalic acid are ground in an agate mortar and mixed, and the mixture is milled to ensure complete reaction. The mixture is then washed with the alcohol in an ultrasonic bath. Finally, the product is collected using filtration. For the liquid phase method, combining C4H6O4Zn and oxalic acid are combined, ground, and then heated. An amount of dimethyl oxalate dissolved in ether and C4H6O4Zndissolved in water are subsequently prepared and stirred at room temperature, and the reaction mixture is heated and refluxed. After the reaction, the precipitate is washed and dried. Temples played a pivotal role in the shape control of H2C2O4 [5]. Sodium dodecylbenzenesulfonate (DBS) as templates used to prepare rod-like nanoscale ZnC2O4·2H2O whiskers. Zinc acetate hydrate (ZnAc2·2H2O) dispersed in DBS (sodium dodecylbenzenesulfonate, in the presence of DBS xylene to form a homogeneous cloudy mixture. Next, H2C2O4·2H2O was dissolved in alcohol to obtain another clear solution. The latter solution was slowly added drop wise to the slightly cloudy mixture of zinc acetate at room temperature with vigorous stirring until the mixture became clear. The solution was refluxed. Finally, the resulting white precipitate was centrifuged with deionized water to purify the product. H2C2O4 can be prepared by various acids [6]. For example, zinc sulfate heptahydrate, zinc nitrate heptahydrate, zinc chloride heptahydrate, and oxalic acid synthesis zinc oxalate dihydrate compounds were used to synthesize zinc oxide of different structures with different morphologies. The equimolar ratio of the zinc salt of the starting material and oxalic acid was separately dissolved in distilled water to form a homogeneous solution. They were thoroughly mixed under vigorous stirring until a white precipitate of zinc oxalate dihydrate was formed. In a study by Guo [5], ZnC2O4 was used to prepare ZnO nanoparticles by decomposing ZnC2O4 through increased temperatures. The kinetics of this reaction is expressed according to the Avrami–Erofeev equation for nonisothermal and isothermal conditions [1]. Notably, the interspersing substituent layers in ZnC2O4 as precursors determine the resultant forms of ZnC2O4 and ZnO, and favors the formation of a flower-like structure of ZnO [7]. Guo [5] determined that the rod-like β-ZnC2O4⋅2H2O whiskers with small holes sustained their structure at high temperatures; with further temperature increases, the whiskers broke into ZnO nanoparticles. In conclusion, β-ZnC2O4survives high temperatures and has a more intricate shape.
Purpose of this Work
Shape control is frequently used to fabricate sensors; for example, planar graphene is controlled and cut into different shapes for use in biomolecule sensing [7], while graphene oxide is used as a platform for the sensitive and selective detection of DNA and proteins [8]. Reduced graphene oxide also is used as active materials for high- performance molecular sensors [9]. On the other hand, the building nanorblock method is prepared to produce single nano-rod shape of ZnO sensor[10], and oxidation can produce ZnO with a branched snowflake structure can be applied for sensing ethanol. Moreover, the synthesis of ZnO nanowire was fabricated to be ethanol-sensing characteristics [11]. In short, controlling the shape of materials is an essential aspect of sensing applications. This study examined the use of a novel microstructure to control shapes. We synthesized ZnC2O4 by using a two- precursor sol-gel method and applying a laser process. This method controls the rate of hydrolysis and condensation, as well as renucleation and regrowth. The resultant villous shape with high aspect ratios can be used for sensing applications.
Experiment
ZnC2O4 was prepared according to the following process. First, 0.05, 0.1, and 0.2 g of C4H6O4Zn·2H2O were dissolved in 50mL of methanol in a beaker and configured in 10M NaOH. The solution was titrated with 4mL of C4H6O4Zn solution to obtain a solution with a pH value higher than 13. The Zn2+ ions were then allowed to completely settle. Next, 3g of oxidized graphene was dispersed in water for 12 h at 95°C, after which the graphene dispersed in water was added to a less toxic hexamethylenetetramine-reducing agent. The graphene was then removed using a centrifuge, and methanol was added. Subsequently, the oxidized graphene was washed with an ultrasonic shaker for 30 min. The precipitated graphene was cleaned by centrifugation and washed three times to obtain clean reduced graphene oxide (RGO). A total of 0.1 g of the RGO was added to the resultant solution, and the mixture was subjected to ultrasonic vibration for 30 min. The precipitates were washed with methanol, and supersonic treatment was applied. After
centrifugation, the supernatant was immediately discarded, and the charged black precipitate was dried at 130°C for 24 h to obtain ZnC2O4 powder. The ZnC2O4 powder was added to approximately 1 mL of methanol. Subsequently, this mixture was spread on the length and width of an 8 × 9 mm piece of alumina of approximately 0.1 mm thickness before microbeam laser scanning. The villous structure was formed at a rate of 40 m/s, at 80% power and a frequency of 40 Hz to condense a stacking film. A pulsed laser at a wavelength of 1062 ± 3 nm was used with a wavelength of 1062 nm ± 3 nm. The laser, which has an original advanced biaxial high-speed scanning light guide system and can deposit any two- dimensional pattern. The experimental samples were analyzed using X-ray diffraction (XRD) spectroscopy, Raman spectroscopy (RS), field emission scanning electron microscopy (FE-SEM), and energy dispersive spectroscopy (EDS). A typical X-ray detector can analyze the elemental composition of materials from an EDS mapping scan and the surface carbon, zinc, and oxygen distribution. RS was used to analyze the bonding status because Raman spectra are caused by the vibration or rotation of the medium, resulting in the exchange of energy between an incident photon and the medium molecules; thus, the frequency of the scattered light is reflected by the shift. Although EDS can be used for the elemental composition analysis of low atomic number elements such as carbon, hydrogen, and oxygen, this technique is associated with large errors and is consequently only used for reference.
Results and Discussion
Figure 1 displays the XRD spectra of RGO, ZnO, and ZnC2O4 with various ratios of RGO:ZnO. The RGO:ZnO ratio of 1:1 indicates that the precursor RGO was mixed with equal proportions of precursor ZnO to form ZnC2O4. The characteristic (002) peak of RGO was observed at approximately 2θ = 26° and had a wide crest [12]. This observation implies that RGO contains strong sp2 bonds and disordered broadening sp3 bonds. In addition, a sharp (001) peak of ZnO was observed at 2θ = 32°, which implies that ZnO was successfully crystallized. With the two-precursor sol-gel process, the peaks of synthesized products were primarily identified as α-ZnC2O4,β-ZnC2O4, and some wide background amorphous phases. This finding indicates that no strong peaks are relevant to the characteristic peaks of RGO and ZnO. Moreover, the XRD spectroscopy results revealed that the ZnC2O4 was successfully prepared. Our study mainly focused on α-ZnC2O4and β-ZnC2O4. Although α-ZnC2O4 is a common product of several preparation methods, and typically has a rectangular structure, the two-precursor sol-gel method used in this study produced a high proportion of α-ZnC2O4and β- ZnC2O4. The shapes of α-ZnC2O4 and β-ZnC2O4 are caused by the microbeam laser process. Specifically, α-ZnC2O4 morphology is usually less sensitive to optical light; by contrast, the shape of β-ZnC2O4 strongly depends on the temple of ZnC2O4. The main characteristic of the β-ZnC2O4 structure is its tiny whisker-like features, which indicate its villous forming.
![Figure 1: X-ray diffraction spectra of reduced graphene oxide (RGO), ZnO, and ZnC2O4 prepared using the two-precursor sol-gel method. Figure 2 illustrates the Raman spectra of RGO, ZnO, and ZnC2O4 with various ratios of RGO:ZnO. The RGO spectrum demonstrated the absorption of the D-band at 1361 cm−1and the G-band at 1578 cm−1, respectively; notably, the D-band appears weaker than the G-band. This suggests the presence of some defects and hints at the disordered structure of the RGO. Moreover, the original C=C double bond was broken, indicating the presence of significantly sp2-hybridized carbon atoms in RGO [13]. The G-band showed that all the sp2 carbon atom chains were stretched, and that more sp2 bonds were present in the structure. Additionally, the RGO:ZnO ratio of 1:0](/fulltextimages/397/fig_1.png)
Figure 1: X-ray diffraction spectra of reduced graphene oxide (RGO), ZnO, and ZnC2O4 prepared using the two-precursor sol-gel method. Figure 2 illustrates the Raman spectra of RGO, ZnO, and ZnC2O4 with various ratios of RGO:ZnO. The RGO spectrum demonstrated the absorption of the D-band at 1361 cm−1and the G-band at 1578 cm−1, respectively; notably, the D-band appears weaker than the G-band. This suggests the presence of some defects and hints at the disordered structure of the RGO. Moreover, the original C=C double bond was broken, indicating the presence of significantly sp2-hybridized carbon atoms in RGO [13]. The G-band showed that all the sp2 carbon atom chains were stretched, and that more sp2 bonds were present in the structure. Additionally, the RGO:ZnO ratio of 1:0
indicated that the sample is ZnO with no clearly observable peaks in its spectrum in the frequency range. Finally, the condensation of ZnC2O4revealed a very weak D-band and G-band. This demonstrated that RGO bonding was largely reduced following the bonding of the ZnC2O4 phase. The results also indicated that no significant extra peaks appear in the frequency range.
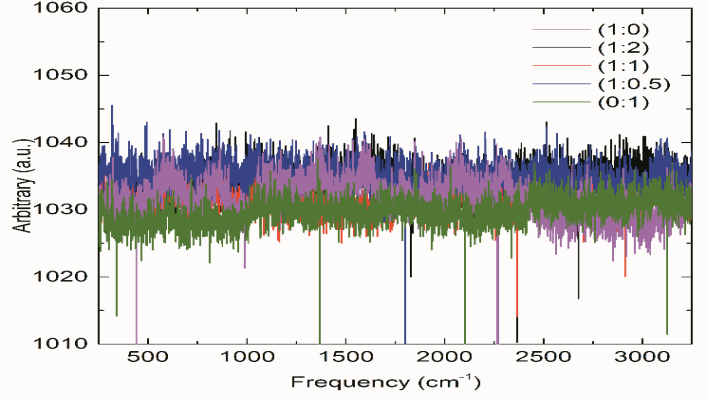
Figure 2: Raman spectra of RGO, ZnO, and ZnC2O4 with various ratios of RGO: ZnO. Figure 3 displays the FE-SEM images of the samples with RGO: ZnO ratios of (a)1:0, (b) 1:2, (c) 1:1, (d) 1:0.5, and (e) 0:1 before the micobeam laser process. Figure 3(a) illustrates RGO, with particles that resemble irregular flakes. Figure 3(b) presents an image of ZnC2O4with a ratio of 1:2, and with particles that have an irregular rectangular shape. Figure 3(c) is an image of the sample with a ratio of 1:1, and with particles that have an irregular rectangular shape. Figure 3(d) depicts ZnC2O4 with a ratio of 1:0.5, again with particles that have an irregular rectangular shape. Notably, small particles are situated on the top surface of the larger particles in Figure 3(a)–(d). Finally, Figure 3(e) displays an image of ZnO; herein, small and large particles are evenly distributed on its surface. Figure 4 presents the SEM images of the samples with RGO: ZnO ratios of (a)1:0, (b) 1:2, (c) 1:1, (d) 1:0.5, and (e) 0:1 after the microbeam laser process. Figure 4(a) shows the RGO particles, which are small, condensed, and stacked on the top surface of the large particles. Figure 4(b)–(d) depict images of ZnC2O4. These particles exhibit irregular rectangular shapes, with lengths and diameters of approximately 70 μm and 5 nm, respectively. The tops of these particles have small nanovillous protrusions, which only form after laser scanning and require the surface of the large particles to melt and resolidify. The surface of the large particles quickly partially melts and resolidifies as tiny β-ZnC2O4structures; consequently, villous structures are formed. The unique villous microstructure of ZnC2O4 is attributed to the presence of intercalating cation–anion chains; in addition, the surfaces of these nanovillous structures have high aspect ratio features. Figure 4(e) presents an image of ZnO, where small particles have formed on the top surface of large particles.
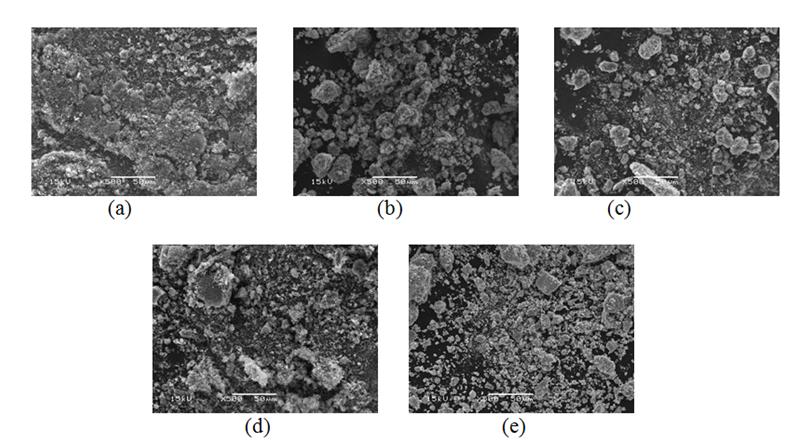
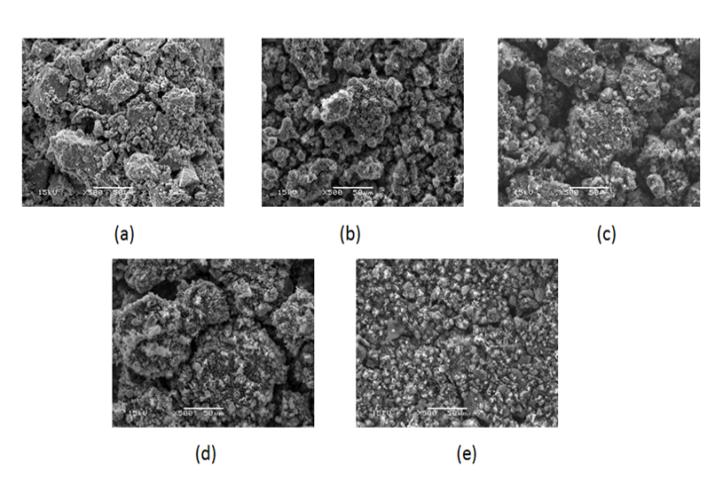
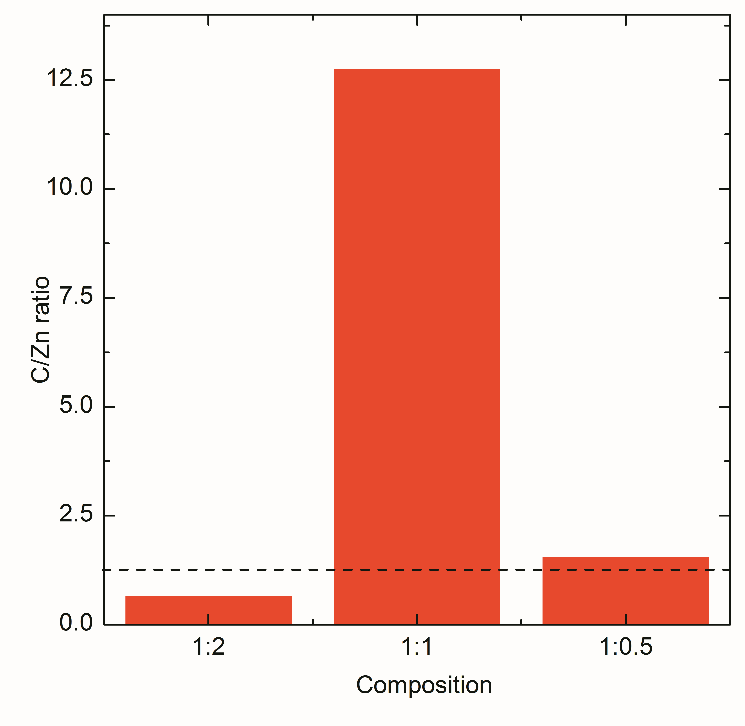
Figure 5 illustrates the energy disperse X-ray spectroscopy, EDX, analysis of the C/Zn level histogram for various RGO:ZnO ratios. For a RGO: ZnO ratio of 1:2, the C/Zn level was close to 1, and for a RGO: ZnO ratio of 1:0.5, the C/Zn level was close to 2; in both cases, the C/Zn value was below the saturated value of 2. By contrast, the C/Zn value of the RGO: ZnO ratio of 1:1 was markedly higher than those of the other cases. This finding indicates that the sample with a RGO: ZnO ratio of 1:1 exhibits unique properties. This could be explained by the specific surface energy. The concentration counter ion effect could play a role in the supersaturation. This effect produces the driving force to attract carbon from the RGO. Carbon is attracted into the open structure between the cation and anion chain bonds when RGO and ZnO are synthesized to form ZnC2O4. For the α-ZnC2O4 crystals, each zinc ion coordinates with six oxygen atoms to form an octahedral site that readily accommodates and sustains impurities. The structure of β-ZnC2O4 develops balanced cation and anion chain bonds; consequently, the octahedral structure is easily compressed. These sites are the optimal place for the insertion of impurities.
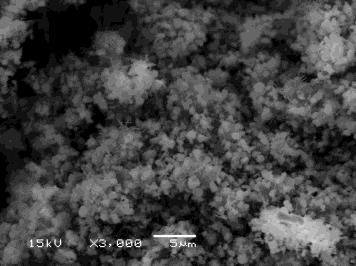
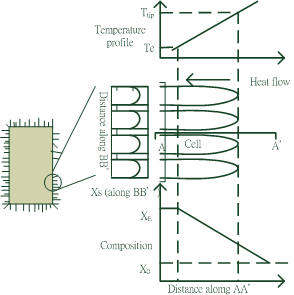
Figure 5: C/Zn level histogram for various ratios. To further illustrate the villous structure, a high magnification image with a ratio of 1:0.5 is presented in Figure 6(a), which shows that the surface melts and resolidifies as protrusions that resemble a villous structure. The formation mechanism is outlined in Figure 6(b). At the microscale, ZnC2O4particles typically have rectangular shapes; then, after matrix-dotted laser scanning, the surfaces of the particles melt and nucleation occurs along the surface of BB′. The cation and anion chains of β-ZnC2O4 compete to nucleate on the surface. Because of the minute characteristic of β-ZnC2O4, cell growth develops along the vertical direction AA′. Meanwhile, the microscale temperature gradient, Te to Ttip, induces the growth of cells. However, the concentration gradient, X0 to Xe, is not presented in this study. As a result, villous ZnC2O4 is formed.
(a)
(b) Figure 6: (a) High magnification image with a RGO: ZnO ratio of 1:0.5. (b) Proposed schematic diagram to interpret the formation of the villous structure.
Conclusions
The XRD results of this study demonstrate that ZnC2O4 was successfully prepared using a two-precursor sol-gel approach. Both α-ZnC2O4 and β-ZnC2O4 exist in ZnC2O4. The D- and G-bands of RGO show that a small amount residual in ZnC2O4. Microbeam laser scanning alters the compounds’ microstructures of ZnC2O4. The microbeam laser melts the surface of the ZnC2O4particles. The β- ZnC2O4 parts renucleate and grow, producing nanovillous structures on the top surface of these microscale particles. The laser provides a sharp temperature gradient and facilitates the formation of nanovillous structures with a high aspect ratio. Overall, the sample with an RGO: ZnO ratio of 1:1 possesses a high C/Zn level and a stable nanovillous structure resulting from the counterion effect.
References
-
Małecta B, Droźdż-Cieśla E, Małecki A (2004) Mechanism and kinetics of thermal decomposition of zinc oxalate. Thermochimica Acta 423(1-2): 13-18.
-
Zhang J, Xu M, Zhou X (2005) Synthesis of nanometer ZnO by solid phase method. Inorganic chemicals industry 37: 7-18.
-
Cao YL, Liu L, Jia DZ, Xin XQ (2005) One-step Solid- state Synthesis and Characterization of Two Kinds of ZnC2O4·2H2O Hollow Nanostructures. Chinese Journal of Chemistry 23(5): 539-542.
-
Ni L, Wang L, Shao B, Wang Y, Zhang W, et al. (2011) Synthesis of Flower-like Zinc Oxalate Microspheres in Ether-water Bilayer Refluxing Systems and Their Conversion to Zinc Oxide Microspheres. J Mater Sci Technol 27(6): 563-569.
-
Guo L, Ji Y, Xu H, Wu Z, Simon P (2003) Synthesis and evolution of rod-like nano-scaled ZnC2O4 .2H2O whiskers to ZnO nano particles. J Materials Chemistry 13: 754-757.
-
Raj CJ, Joshi RK, Varma KBR (2011) Synthesis from oxalate, growth mechanism and optical properties of ZnOnano/micro structures. Cryst Res Technol 46(11): 1181-1188.
-
Cui J, Sun J, Liu X, Li J, Ma X, et al. (2014) Fabrication of hierarchical flower-like porous ZnO nanostructures from layered ZnC2O43(Zn(OH)2 and gas sensing properties. Applied Surface Science 308: 17-23.
-
Lu CH, Yang HH, Zhu CC, Chen X, Chen GN (2009) A GraphenePlateform for Sensing Biomolecules. Biosensors 121(26): 4879-4881.
-
Robin JT, Perkin FK, Snow S, Wei Z, Sheehan PE (2008) Reduced graphene oxide Molecular Sensors. Nano Lett 8(10): 3137-3140.
-
Lupan O, Chai G, Chow L (2008) Novel hygen gas sensor based on single ZnOnanorod. Microelectronic Engineering 85: 2220-2225.
-
Wan Q, Li QH, Chen YJ, Wabf TH, He XL, et al. (2004) Fabrication and ethanol sensing characteristics of ZnO nanowire gas sensors. AIP 84(18).
-
Shang C, Barnabe A (2013) Structural study and phase transition investigation in a simple synthesis of porous architected-ZnOnanopowder. Materials Characterization 86: 206-211.
-
Xu C, Wang X, Zhu JW (2008) Graphene metal particle nanocomposites. J Physical Chemistry C 112(50): 19841-19845.
- Solution-Processed Chiral Perovskites for Biomedical Applications
- Nanotechnology in Health Chemistry and Medicine: Current Challenges and Future Directions
- Human Exposure to Micro- and Nanoplastics: Pathways, Toxicity, and Intervention Strategies
- Exosome Nanomedicine for Cancer Therapy
- Micro and Nanoplastics–Plastisphere, Biotoxicity, Impact on Human Health, and Mitigation Strategies
- Process Validation of Cefixime Powder for Suspension Dosage Form, 50 mL