Thermal Diffusivity Effect on Brownian Motion
The reason why the measured self-diffusional coefficient, selfDmeas, of the liquid Brownian particle (LBP) tends to be greater than the analytically expected coefficient, selfDanal, was found to be the thermal transfer without the use of the slipping condition (slipping through the liquid molecular gap leads to an extended random walk time step Ï„w, which is observed as the enhanced selfDmeas). Assuming that the diffusive thermal transfer (DTF) causes a converging heat inflow towards the LBP center uniformly from the surroundings with the thermal diffusivity ratio χ (= λ/Cp Ï) and the advective thermal transfer (ATF) carries heat to the LBP front using the arriving flow with the thermal velocity of the LBP, the diffusive-to-advective thermal transfer ratio (DAR), which represents the balance between the DTF and ATF, was calculated to predict the ratio selfDmeas/selfDanal, which represents the selfDmeas enhancement in water, alcohol, and alkane at 25 °C. The partial mass freedom Nprt associated with the atomic group rotations of the LBP is more than eight times the total mass freedom associated with the directional change of the random walk. Furthermore, the viscous dissipation period of Nprt is significantly shorter than Ï„w. Therefore, the LBP preferred the energy supply to Nprt rather than the directional change according to the equipartition theorem, leading to the Ï„w extension. The tendency of selfDmeas to significantly exceed selfDanal in most liquid molecules was found to be due to the Ï„w extension because selfDmeas∠τw.
Introduction
When a solute molecule regarded as a sphere is immersed in solvent water, the thermal agitation causes the molecular sphere to undergo random walks in the translational and rotational directions, which are known as translational Brownian motion (TBM)[1, 2, 3, 4, 5, 6, 7, 8, 9] and rotational Brownian motion (RBM), respectively [3, 4, 5, 6, 7, 8, 9, 10]. The time averages of the cumulative random walks cause the squared values of the translational and rotational average displacements to be proportional to time. These proportional coefficients are known as the translational (D) and rotational (Drot) diffusion coefficients, where D is proportional to the random walk time step τw. When a rigid sphere with a radius a is immersed in a parallel incompressible flow with velocity U and viscosity η, Stokes’ law determines that the frictional resistive drag (RD) F required for the sphere to stand still is F = 6πaηU [11, 12]. The Stokes–Einstein equation (SEE) [1, 2, 3, 4, 5, 6, 7, 8, 9] determines the relation between D and the thermal energy, whereas the electrophoretic formula (EPF) [3, 7, 10] determines the relation between the electrophoretic velocity vep and applied electric field, with Stokes’ law applied to the SEE and EPF. By substituting the measured D and vep values into the SEE and EPF, the Stokes radius and Stokes’ law radius, which are the molecular radii of the solute moving in the solvent, can be calculated, respectively [3].
The abilities of the electrolytes used in batteries and capacitors can be evaluated from the solute and solvent radii that are modified by association. Deviations from Stokes’ law have been reported in radius calculations using the EPF and SEE based on the D values determined by nuclear magnetic resonance (NMR) and electric conductivity, respectively [13, 14]. This is because a solvated molecule does not become sufficiently larger than the realistic molecular radius that is determined from the molecular orbital calculation or crystallographic data. Moreover, cases of negative solvation have been identified, in which the solvated molecular radii calculated using the SEE and EPF are significantly smaller than the realistic radii. This type of deviation indicates RD reduction on the molecular scale, i.e., a realistic molecular radius can be obtained by changing the factor 6 of RD: F = 6πaηU used in the EPF and SEE to lower values [2]. When the solute radius exceeds three times the solvent radius, RD reduction disappears in the EPF, i.e., the macro-scale hydrodynamics recover on the molecular scale [3]. Thus, the slipping condition has been proposed, [2, 15, 16, 17, 18, 19, 20, 21] whereby RD reduction is caused by the solute easily slipping through the gaps between solvent molecules. However, inaccuracies of several tens of percent are often observed in Stokes radius and Stokes’ law radius. The smaller Stokes radius is observed as the enhanced D (∝ τw), which means that the τw extension is caused by RD reduction.
A solute that is diffused in a solvent is known as a liquid Brownian particle (LBP). When the LBP and solvent are similar, D becomes the self-diffusion coefficient, selfD. The D value of an LBP diffused in water and the selfD value of water confined to a restricted space, such as tissue, are denoted as Dres and selfDres, respectively; they are lower than D and selfD in free water, respectively, because the TBM is modified by the void ratio (water content ratio) of the tissue. The selfD value of water in the tissue can provide diagnostics because the water content ratio in lesion tissues, such as cancer, is higher than that in a normal tissue. Magnetic resonance imaging (MRI) can determine the location of the contrast agent (CA) [22]. When Dres of the CA diffused in tissues is evaluated by MRI, the water content ratio in the tissue can be evaluated using the selfDres value of water, which is converted from Dres [23]. Although D and Dres can be determined using optical measurements, these require LBP concentrations of over 0.1 mol/ℓ, and high-concentration-interactions could modify D [3, 24]. MRI can determine the Dres value of the CA without being affected by the concentration interactions because the clinical dose of the CA is approximately 0.1–0.5 mmol/ℓ [25]. The inaccuracy of the Stokes radius leads to inaccuracies in determining the exact void ratio and porous radius in the tissue. Because the EPF and SEE are of significant interest for developments in functional materials and biological diagnostics, the inaccuracies caused by Stokes’ law prevent accurate assessments. Therefore, the aim of this study is to examine the causes of RD reduction and τw extension from the energy transfer.
Self-Diffusion of Water Molecule
Motion Equation with Equipartition Theorem
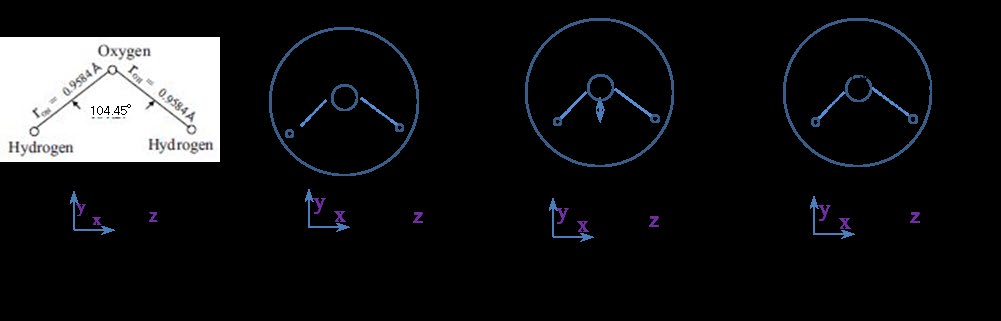
A water molecule sphere with radius a and mass M is considered. The mass M of one water sphere is M = 18mp, where 18 and mp are the molecular weight (MW) of water and the proton mass (1.67 × 10⁻²⁷ kg), respectively. The distance between the hydrogen and oxygen nuclei, rOH, is 0.9575 Å, and the HOH angle θHOH is θHOH = 104.45° [26]. The x–y plane involving two hydrogens and oxygen is illustrated in Figure 1(a), where the z-axis is vertically oriented. The center of gravity of the water molecule exists approximately at the center of the oxygen nucleus, whereas the two hydrogen atoms (protons) rotate around the oxygen nucleus. The three moments of inertia Ix, Iy, and Iz along the x-, y-, and z-rotation axes are depicted in Figure 1(b), (c), and (d), respectively. Under these assumptions, Iz = 2mprOH 2 [10]. The straight line connecting the two hydrogens is indicated by rHH, and the distance between the oxygen nucleus and center of rHH is rO- HH, where rHH = 1.51 Å (= 2 rOH・sin(104.45°/2)) and rO-HH = 0.586 Å (= rOH・cos(104.45°/2)). Thus, Ix = 2mprO-HH 2 and Iy = 2mp (rHH /2) [2]. The average moment of inertia Iw [= (Ix + Iy + Iz )/3] of Ix, Iy, and Iz for the water sphere rotation is assumed as follows:
$$ l _ {w} = \frac {4}{3} m _ {p} r _ {O H} ^ {2} \tag {2.1a} $$
$$ l = \frac {2}{5} M \left(R _ {M} - R _ {S}\right) ^ {2} \tag {2.1b} $$
Where the factor 4/3 in Eq. (2.1a) is derived from (2 + 2sin2(104.45°/2) + 2cos2(104.45°/2))/3. The moment of inertia, I, of the molecules, which can be regarded as spheres and the masses of which are uniformly distributed, is expressed as I = (2/5)MRM 2, where M = MW × mp and RM is the molecular sphere radius, similar to that of a rigid sphere. The outer edge of the molecular electronic cloud cannot be RM when calculating I because the molecular mass is distributed in the nucleus. Moreover, the surface mass (Msrf) of the general molecule consists of the lightest hydrogen atom. Thus, in this study, I is assumed to be given by Eq. (2.1b) for molecules of water, alcohols, and alkanes, where Rs = 1.0 Å. Equation (2.1b) indicates the value of I, similar to Iw in Eq. (2.1a), by setting RM=1.44 Å, which is the realistic molecular radius of water, as will be demonstrated later.
In accordance with the equipartition law of energy (equipartition theorem), the equithermal energy kBT /2 is assigned to three translational (Ntrans) and rotational (Nrot) degrees of freedom of the water sphere in the x, y, and z directions, as expressed by Eqs. (2.2a) and (2.2b), respectively, where T is the temperature in Kelvin (K) and kB is the Boltzmann constant (1.38 × 10⁻²³ J/K) [6]. Both degrees of freedom of Ntrans and Nrot of aqueous vapor are three, whereas mono-atomic (rare) gas only has Ntrans.
$$ \frac {1}{2} M \left\langle \left(\frac {d x}{d t}\right) ^ {2} \right\rangle = \frac {1}{2} K _ {B} T \tag {2.2a} $$ $$ \frac {1}{2} I \left\langle \left(\frac {d \theta}{d t}\right) ^ {2} \right\rangle = \frac {1}{2} K _ {B} T, \tag {2.2b} $$ Where t, x, and θ are the time and translational and rotational displacements, respectively, whereas (1/2)M<(dx/dt)2> and (1/2)I<(dθ/dt)2> are the time-averaged translational and rotational energies, respectively. The average thermal velocity, Vth = <dx/dt>, and angular velocity, Ωth = <dθ/dt>, at 25 °C are calculated as Vth = 369.6 m/s (= (kBT/M)1/2) and Ωth =1.42 × 10¹³ rad/s (= (kBT/I)1/2), respectively. Assuming that the realistic water radius aw = 1.44 Å, [10, 21] the thermal rotation velocity Vth,s on the sphere surface calculated using Ωth is 2044 m/s (= Ωth・aw), which is 5.5 times Vth. The surface-to-parallel velocity ratio Vth,s /Vth is proportional to M/Msrf and is not dependent on T for general molecules.
Consider a water sphere with radius aw and mass M. Translational motion is performed in the x direction with velocity dx/dt in a Newtonian fluid with viscosity η. The translational motion of the water sphere carrying out a random walk is known as TBM [6, 10]. The molecular sphere is referred to as the center sphere (molecule), LBP, or cold molecule. The flow line passing the center sphere in the fluid is indicated in Figures 2.
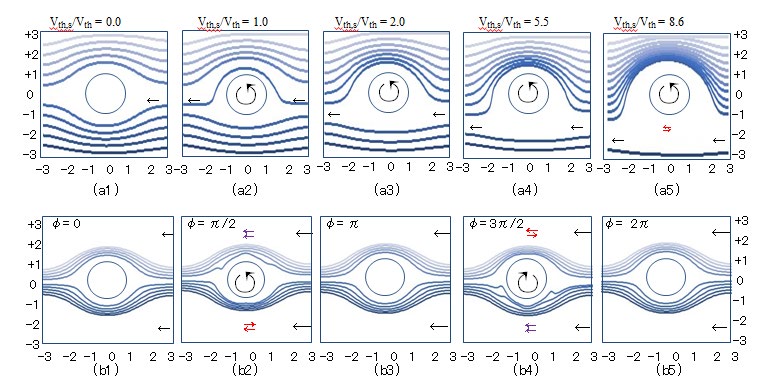
Figure 2: (a) Parallel flow lines with velocity Vth deformed by surface velocity Vth,s of a steady rotating cylinder. The ratio Vth,s/Vth is (a1) 0.0, (a2) 1.0, (a3 ) 2.0, (a4) 5.5, and (a5) 8.6. The rotation direction is indicated by ↺. (b) Flow lines deformed by sinusoidally changing surface velocity of a reciprocally rotating cylinder. The phases are (b1) 0.0, (b2) π/2, (b3) π, (b4) 3π/2, and (b5) 2π. The forward and counter flows are indicated by ⇇ and ⇆, respectively.
Stokes’ law determines the RD created by the passing flow as $6\pi a_w \eta(dx/dt)$ [11, 12]; thus, the translational motion of the water sphere can be described by the Navier–Stokes equation, as follows:
$$M \frac{d^2 x}{dt^2} = -6\pi a_w \eta \frac{d x}{dt} + F_x(t),$$
(2.3)
where $Fx(t)$ is the time and an impulsive force arising from random collisions. Using Eq. (2.2), the solution to Eq. (2.3) is derived as
$$\frac{d \left( \langle x^2 \rangle \right)}{dt} = \frac{2 K_B T}{6\pi a_w \eta} + C_{trs} e^{-(t/\tau_w)},$$
(2.4)
Where $C_{trs}$ is the constant of integration. Eq. (2.3) yields $\tau_w$, which is one translational random walk time step and is described as $\tau_w = M/6\pi a_w$. The final term $C_{trs} \exp(-t/\tau_w)$ in Eq. (2.4) disappears for a longer timescale over $\tau_w$ because $\tau_w = 12.4$ fs at $25^\circ C$, where $\eta = 0.890 \times 10^{-3} \text{ Pa} \cdot \text{s}$, assuming that $a_w = 1.44 \text{ Å}^{10}$. Therefore, the time average of the cumulative translational random walk $<x^2>$ derived from Eq. (2.4) leads to translational diffusion described by the SEE:
$$\langle x^2 \rangle = 2Dt, D = \frac{K_B T}{6\pi a_w}$$
(2.5)
Where $D$ is the TBM diffusion coefficient.
Consider a water sphere with radius $a_w$, rotational motion is performed with rotational velocity $d\theta/dt$ in a Newtonian fluid of liquid water with viscosity $\eta$. The motion of the water sphere carrying out a rotational random walk owing to the thermal agitation is known as RBM [5, 10]. Because the force couple for the rotational motion is $8\pi a_w^3 \eta (d\theta/dt)$, [11] the rotational motion of the water sphere can be described by the Navier–Stokes equation using $l$ in Eq. (2.1), which is a torque equation:
$$I \frac{d^2 \theta}{dt^2} = -8\pi a_w^3 \eta \frac{d \theta}{dt} + F_\theta(t) a_w$$
(2.6)
Where $F_\theta(t) a_w$ is the impulsive torque arising from the thermal agitation. Using Eq. (2.2), the solution to Eq. (2.6) is obtained as
$$\frac{d \left( \langle \theta^2 \rangle \right)}{dt} = \frac{2 K_B T}{8\pi a_w \eta} + C_{rot} e^{-(t/\tau_p)},$$
(2.7)
where $C_{rot}$ is the constant of integration. Eq. (2.6) yields $\tau_p$, which is one rotational random walk time step and is described as $\tau_p = I/8\pi a_w^3$. The final term $C_{rot} \exp(-t/\tau_p)$ in Eq. (2.7) disappears for a longer timescale over $\tau_p$ because $\tau_p = 0.353$ fs at $25^\circ C$. Thus, the time average of the cumulative rotational random walk $<\theta^2>$ derived from Eq. (2.7) leads to the dielectric relaxation formula (DRF)
$$\langle \theta^2 \rangle = 2D_{rot} t, D_{rot} = \frac{K_B T}{8\pi a_w^3}, \text{ and } \frac{4\pi\eta a_w^3}{k_B T},$$
(2.8)
Where $D_{rot}$ is the RBM rotational diffusion coefficient. The time required for the rotation to change into an entirely new state is defined as the dielectric relaxation time $\tau_{rel} = 4\pi\eta a_w^3/k_B T$ by setting $<\theta^2> = 1$.
The translational and rotational random walk time steps of $\tau_w$ and $\tau_p$ are also referred to as the TBM and RBM dissipation periods, respectively. The TBM and RBM initiation frequencies are denoted by $f_{TBM}$ and $f_{RBM}$, where $f_{TBM} = 1/\tau_w$ and $f_{RBM} = 1/\tau_p$, respectively. The molecules surrounding the center molecule are known as the surrounding spheres (molecules), which are related to the initiation and dissipation of the TBM and RBM. The sphere radius $a_w$ molecular mass $M$ and moment $I$, velocities $V_{th}$ and $V_{th^*}$, and dissipation periods $\tau_w$ and $\tau_p$ are similarly defined in general molecules. When Eqs. (2.3) through (2.8) are applied to general molecules, the sub-suffix $w$ of $a_w$ is eliminated. The translational-to-rotational random walk time step ratio and RBM-to-TBM initiation frequency ratio are defined by $\tau_w/\tau_p$ the value of which is 41 for water. In general molecules, $\tau_w/\tau_p >> 1$ because $\tau_w/\tau_p \propto M/M_{srf}$ and $M/M_{srf} >> 1$, and $\tau_w/\tau_p$ does not depend on $T$, whereas $\tau_{rel}/\tau_w$ depends on $T$. The conditions $V_{th}, V_{th^*} >> 1$ and $\tau_w/\tau_p >> 1$ hold for general molecules because they are proportional to $M/M_{srf}$. In this study, the data are measured at $25^\circ C$, $D$ means the diffusional coefficient or deuterium, and $T$ indicates the temperature or tritium.
One translational random walk stride $\Delta x_{tra}$ for one translational random walk time step $\tau_w$ is $\Delta x_{tra} = V_{th} \Delta x_{tra}$, which is the diffusional displacement during $\tau_w$. Because the repetition number $N$ of the random walk after time $t$ is given as $N = t/\tau_w$, $N$ repetitions with $\Delta x_{tra} \leadsto N < \Delta x_{tra} > 2$ ($= tV_{th}^2 \tau_w$), which is expressed as
$$\langle x^2 \rangle = \frac{K_B T}{M} \tau_{wt}, \tau_{w} = \frac{M}{6\pi\eta a_w},$$
(2.9)
where $D$ is $(k_B T/M) \tau_{w}$. Similarly, one rotational random walk angle $\Delta \theta_{rot}$ for one rotational random walk time step $\tau_p$ is $\Delta \theta_{rot} = \Omega_{th} \Delta \theta_{rot}$, because the repetition number $N$ of the rotational random walk after time $t$ is given as $N = t/\tau_p$, $N$ repetitions with $\Delta \theta_{rot} \leadsto N < \Delta \theta_{rot} > 2$ ($= tV_{th}^2 \tau_w$).
tΩth 2τp), which is expressed as $$ \left\langle \theta^ {2} \right\rangle = \frac {k _ {B} T}{I} \tau_ {p} t, \tau_ {p} = \frac {I}{8 \pi \eta a _ {w} ^ {3}}. \tag {2.10} $$
2 , 3 8 Equations (2.9) and (2.10) mean <x2> = D_t, _D = kBT/6πaη, and <θ_2> = _D_rott, _D_rot = kBT/8π_aw 3η, which are similar to Eqs. (2.5) and (2.8), respectively. Thus, the SEE and DRF are derived schematically. Both the translational and rotational random walk strides can be regarded as short linear lines, as demonstrated in Section III.
The average kinetic energies of the molecule performing TBM and RBM are E_trans = _kBT/2 and E_rot = _kBT/2, respectively. The average RD for the TBM is obtained by setting dx/dt = Vth in Eq. (2.3) as 6πawηVth (= M・Vth/τw). Because the average displacement along the RD for τw is ∆xtra (= Vth・τw), the translational energy reduction ∆Etrans for τw is expressed as ∆Etrans = 6πawηVth・∆xtra and is calculated as kBT (= Vth 2 ・M). The average force couple for the RBM is obtained by setting dθ/dt = Ωth in Eq. (2.6) as 8πaw 3ηΩth (= I・Ωth/τp). Because the average angular displacement along the force couple is ∆θrot (= Ωth・τp), the rotational energy reduction ∆Erot for τp is expressed as ∆Erot = 8πaw 3ηΩth・∆θrot and is calculated as kBT (= Ωth 2・I). Thus, the random walks of both the TBM and RBM begin at t = 0 with similar maximum energies of kBT/2 according to the equipartition theorem in Eqs. (2.2a) and (2.2b), and similar energies of kBT/2 are consumed until t = τw and τp, respectively. In water, the RBM changes the rotation direction τw /τp (= 41) times during τw, and the thermal agitation replenishes the TBM and RBM with powers of 0.185 and 7.59 μW at frequencies of fTBM and fRBM, respectively.
Realistic Liquid Molecular Radius
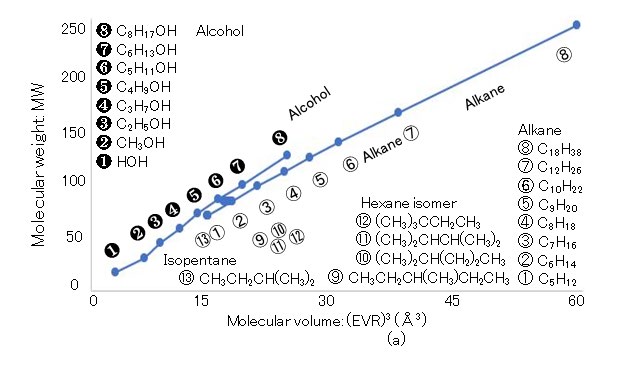
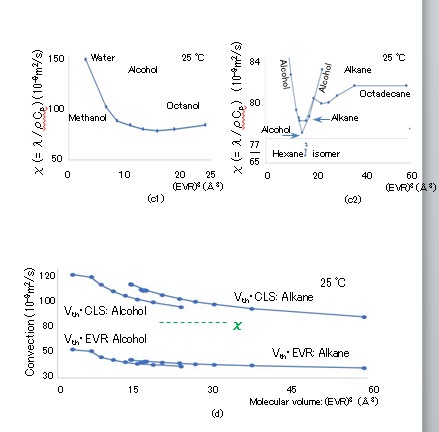
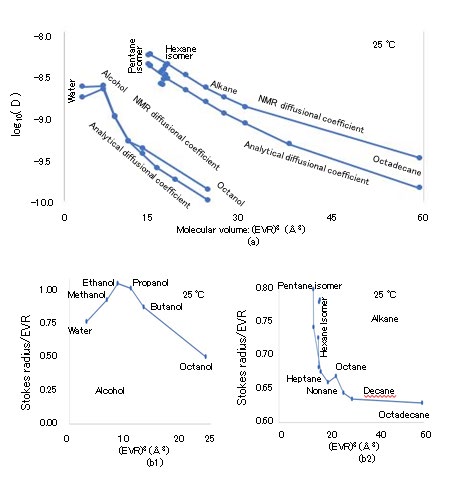
The van der Waals constant b, which is the exclusion volume of the rotating molecular sphere in a critical vapor state, is determined as b = RTc/8Pc, where R (= NAkB), NA, Tc, and Pc are the gas constant (8.3145 J/(K・mol)), Avogadro number (6.02214 × 10²³/mol), critical temperature (K), and critical pressure (Pa), respectively [27]. The exclusion volume radius (EVR) of H2O and that of D2O are denoted by H2Oaw b and D2Oaw b, respectively, which are calculated using NA(1/2)(4π/3)(2aw)3 = b.7 Because Tc and Pc are 647.3 K and 22.12 × 10⁶ Pa (= 218.3 atm) for H2O and 643.89 K and 21.66 × 10⁶ Pa (= 213.7 atm) for D2O, respectively, the b values of H2O and D2O can be calculated as 3.041 × 10⁻⁵ m3/mol and 3.090 × 10⁻⁵ m3/mol, respectively. Thus, the EVR values of H2O and D2O are calculated as H2Oaw b = 1.445 Å and D2Oaw b = 1.453 Å, respectively. The cube of the EVR, namely (EVR)3, is known as the molecular volume on the scale of the LBP. The relations between the (EVR)3 and MW values of hydrophilic and hydrophobic molecules are illustrated in Figure 3(a), where the horizontal and vertical axes indicate (EVR)3 in Å3 and MW in Dalton, respectively. The following hydrophilic molecules are considered: water {H(OH)}, normal alcohols [methanol (CH3OH), ethanol (C2H5OH), n-propanol (C3H7OH), n-butanol (C4H9OH), n-pentanol (C5H11OH), n-hexanol (C6H13OH), and n-octanol (C8H17OH)]. Further, the following hydrophobic molecules are considered: normal alkanes [n-pentane (C5H12), n-hexane (C6H14), n-heptane (C7H16), n-octane (C8H18), n-nonane (C9H20), n-decane (C10H22), n-dodecane (C12H26), n-octadecane (C18H38)]; moreover, the following isomers of alkanes are considered: [isopentane (C5H12), 2-methylpentane (C6H14), 3-methylpentane (C6H14), 2,2-dimethylbutane (C6H14), 2,3-dimethylbutane (C6H14)]). Because water has the hydroxyl group OH, it is classified into the alcohol group. The MW ranges from 18 (water) to 254.5 (octadecane); the molecules are selected from the liquid state at 25 °C. Although strong correlations between (EVR)3 and MW are identified in alcohols and alkanes, their gradients are slightly different. The molecules presented in Figure 3 are also depicted in Figure 4, 5, 6, and 7, where the hydrophilic (alcohol) and hydrophobic (alkane) molecules are indicated separately on the left and right sides, respectively, if necessary.
3a
3b
3C
3d Figure 3: (a) (EVR) 3 dependence of (a) MW, (b) density ρ, (c) (CLS)3/(2・EVR)3 [= (MW・mp)/{ρ(EVR)3}, and (d) (CLS)/ (2・EVR).
![Figure 6: (EVR)3 dependence of (a) η and ν (= η/ρ); (b) Vth [= (kBT/M)1/2] and Re (= Vth・EVR・ρ/η); (c) τrel, τth, τg, τw, and τp; and (d) (2χτw) 1/2/EVR and Vth・τw/EVR.](/fulltextimages/5921/fig_6.jpeg)
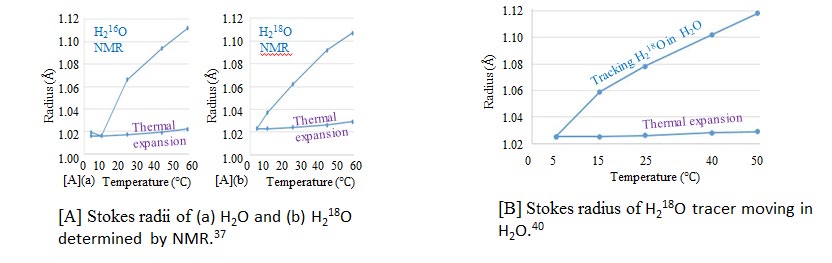
![Figure 9: Temperature dependence of Stokes radius evaluated using SEE. The D values are measured by NMR ([A], [C], and [D]) and tracer tracking ([B], [E], and [F]).](/fulltextimages/5921/fig_9.jpeg)
The molar dielectric ratio εr can be determined by locating a uniform medium of air, liquid, or solid in an electric capacitor when a DC or alternating electric field with a frequency of less than 1 kHz is applied. The dipole moment of the molecule in the medium can be determined based on εr,. While the dipole moments of most molecules are similar in both the liquid and gas states, the dipole moment of a water molecule in the liquid state is approximately twice that in the vapor state. Thus, the hydrogen-bonded cluster in the liquid state was proposed, [28, 29] in which the tetrahedron structure performing collective motion was confirmed by X-ray scattering. The existence of the cluster a certain type of icy nucleus remaining in the liquid state above the freezing point—is also supported by the smaller entropy generated by the solid–liquid transition of water. In this case, two contradicting phenomena exist: the residual ice nucleus melts and the liquid density increases with temperature; however, the liquid density decreases with temperature owing to thermal expansion. Thus, the maximum density temperature exists above the melting point owing to the decrease in the remaining ice nucleus and the increase in the thermal expansion. The molar heat capacity Cp,mol of a gas is determined by the total number of degrees of motional freedom Nf and can be expressed as Cp,mol = Nf(R/2). The isopressure molar heat capacity Cp,mol of aqueous vapor (H2O gas) is Cp,mol ≒ 6(R/2), which implies the existence of three Ntrans and three Nrot, in accordance with the equipartition theorem. A total of six Ntrans and Nrot degrees of freedom are expected to be conserved in the liquid water performing TBM and RBM, respectively, because Cp,mol of the liquid water is 18.2(R/2). The radius of a water molecule calculated using the DRF from the melting point to 60 °C is similar to the EVR, and the Stokes radius is close to the EVR even with a 30% deviation, as demonstrated later [3, 10]. The measurement of εr is conducted at frequencies of less than 1 kHz, while that of τrel is conducted at terahertz frequencies. Thus, the water molecule as a component of an icy nucleus (cluster) in the liquid state is considered to perform the TBM and RBM as a single water molecule within a picosecond timescale of τrel, [26] whereas the motion of the icy nucleus has an average timescale that is substantially larger than τrel, τw, and τp.
The fact that CLS/(2・EVR) is within 1.20 means that sufficient vacant space is available in the cubic lattice for one LBP to perform TBM and RBM. The timescales of the TBM and RBM of H2O and D2O are considered to be similar to those of a single molecule [3, 10]. The Stokes radius and molecular radius calculated using the SEE and DRF of water, respectively, are close to the molecular radius of a single molecule, as indicated in subsections IV and V. Thus, the realistic molecular radius for comparison with the Stokes radius of the LBP is assumed to be the EVR, which is a single molecule in the vapor state. It has been reported that the Stokes radius deviates from and is frequently lower than the realistic radius. Therefore, the Stokes radius-to-EVR ratio (SEV) is defined to examine the deviation in the Stokes radius from the realistic molecular radius at 25 °C.
Flow Passing Rotating Molecule
The center sphere performing the TBM and RBM is indicated by circles in Figure 2, where the horizontal and vertical axes are the x and y directions, respectively, and the parallel flow moves horizontally from right to left, which is opposite to the translational motion with velocity Vth. The directional axis is defined along the translational motion and passes the middle of the center sphere from left to right. The vertical section of the center sphere is defined by a plane including the directional axis. The polar angle 0 ≤ θv ≤ π is measured from the right (northern pole, θv = 0) and left (southern pole, θv = π) edges of the center sphere, in which the edges are known as the front and back centers, respectively; these are the stagnation points at which the external flow velocity is 0. The highest surface flow circumference exists around the equator at θv = π/2.
The RD in the SEE [6πawη(dx/dt)] and force couple in the DRF [8πaw 3η(dθ dt)] equivalently and viscously dissipate the translational and rotational motions, respectively, because the RBM can be regarded as a random walk on a molecular surface dissipating in a viscous environment. Thus, the factor 8πaw 3η in the denominator of the DRF is also regarded as the RD. The RD [6πawη(dx/dt)] in the TBM consists of the viscous drag (VD) [4πawη(dx/ dt)] acting tangentially on the sphere surface and the pressure force (PF) [2πawη(dx/ dt)] acting normally on the sphere surface, whereas the RD [8πaw 3η(dθ/ dt)] in the RBM consists of only the VD.11 Although the PF is effective around the front (θv = 0) and back (θv = π) centers, where the parallel flow hits and pulls almost normally on the sphere surface, the VD is the most effective around the equator (θv = π/2), where the flow passes tangentially. The ratio (PF)/(VD) = 1/2 can be understood as the center-to- side surface area ratio of the sphere. When a cylinder with an infinite length and radius a is placed perpendicularly to the parallel flow, the cylindrical RD Fcyl required for the cylinder to stand still per unit length is Fcyl = 4πaηU, where both VD and PF equal 2πaηU; this relation is also known as Stokes’ law. The fact that the ratio (PF)/(VD) = 1 in Fcyl is twice that in the sphere can be understood by the cylinder center-to-side surface area ratio. Although the pressure profiles around the sphere and cylinder differ, the parallel flow passing the rotating cylinder is assumed to be similar to the realistic flow around a rotating molecule.
The external parallel flow passing the rotating molecular sphere is numerically simulated, where the translational motion of the LBP is replaced with the steady parallel external flow perpendicularly passing over an infinite cylinder with radius $a_w$. The external flow velocity and rotational velocity of the cylinder surface are set to $V_{th}$ and $V_{th,s}$, respectively. The Navier–Stokes fluid equation for the external flow and incompressible fluid condition are expressed by Eqs. (2.11a) and (2.11b), respectively:
$$\rho \left[ \frac{\partial u}{\partial t} + (u, \nabla) u \right] = -\nabla p + \eta \nabla^2 u \quad (2.11a)$$
$$\nabla^* u = 0 \quad (2.11b)$$
where $u, \rho$, and $p$ are the velocity, density, and pressure of the fluid, respectively. The Reynolds number (Re) is defined as $Re = a(u)\rho/\eta$. Because the low Reynolds number condition holds, i.e., $Re << 1$, the advection term $\rho(u)\nabla^2 u$ for handling the vortex is ignored. To solve Eq. (2.11) numerically using a difference scheme, the $x$ and $y$ positions are denoted by integers $k = x/\Delta x$ and $\ell = y/\Delta y$, respectively, where $\Delta x$ and $\Delta y$ are spatial divisions and $\Delta x = \Delta y$. The progression in $t$ is denoted by the positive integer $m$. The present and next times are expressed using $m$ steps as $m \Delta t$ and using $(m + 1)$ steps as $(m + 1) \Delta t$, respectively, where $\Delta t$ is the minute time step. Because the area of the $x-y$ plane is $L \times L$, of which one side is divided by $N \approx 100$, $\Delta x = \Delta y = L/N$. The $x-y$ plane is divided into an $N \times N$ square mesh array with area $\Delta x \times \Delta y$. The ranges of $x$ and $y$ are $-L/2 \leq x \leq L/2$ and $-L/2 \leq y \leq L/2$, respectively, and $L/2$ is set to $3a_w$. The simulation begins at $t = 0$, where the flow velocity on the surface is the same as $V_{th}$, and the directions are uniformly set to be similar to those of the external parallel flow. The time step $\Delta t$ and spatial divisions of $\Delta x$ and $\Delta x$ satisfy the stable simulation conditions of the Courant–Friedrichs–Lewy condition $\Delta x/\Delta t < |u|$ and Neumann’s condition $\Delta t < (\rho/2)\pi/(\Delta x)$ [30].
The LBP is assumed to be a single molecule without association. The boundary conditions are as follows: the flow velocity on the molecular surface is zero, and the fluid pressure on the molecular surface is balanced with the repulsive force from the surface. The parallel flow lines are externally assumed before $t = 0$ and are deformed with time after $t = 0$ in the simulation. The growth period $\tau_g$ for the parallel flow to reach the steady flow profile is determined numerically as $\tau_g = a_w^2(\rho/\eta)$, which is derived from an inspection of Eq. (2.6), and the $\tau_g$ value of water at $25^\circ C$ is 23.2 fs. The parallel flow deformed by the steady rotation is also known as the steady flow, and the deformation degree of the parallel flow line is determined by $V_{th,s}/V_{th}$. The steady flow profiles obtained after $t = \tau_g$ are compared in Fig. 2(a), where $(a1) V_{th,s}/V_{th} = 0$, $(a2) V_{th,s}/V_{th} = 1$, $(a3) V_{th,s}/V_{th} = 2$, $(a4) V_{th,s}/V_{th} = 5.5$, and $(a5) V_{th,s}/V_{th} = 8.6$. The case of no rotation is expressed as $V_{th,s}/V_{th} = 0$. The upper and lower halves are the forward and counter flow regions, where the velocities of the parallel flow and rotating surface are similar and opposite, respectively, when $V_{th,s}/V_{th} \neq 0$. The steady flow profile passing the no-rotation cylinder for Re $<< 1$ is derived analytically; the flow profile is in accordance with the numerical profile in Fig. 2(a1). The growth period $\tau_g$ is defined as the time at which the flow approaches the analytical steady profile with an accuracy of $10^{-2}$.
Figure 2(b) presents the parallel flow line deformed by the RBM. The surface velocity $V_{th,s}$ varies reciprocally and sinusoidally with the period $2\tau_g$ ($= 0.706$ fs) because $\tau_g$ is one dissipation period of the rotation. The surface velocity amplitude is set to $\sqrt{2} \times 5.5 \times V_{th} = 8.6 \times V_{th}$ for the time-averaged $V_{th,s}$ to be adjusted to $5.5 \times V_{th}$ during $\tau_g$. The phase $\varphi_{ph}$ of the sinusoidally changing rotation is $(b1) 0$, $(b2) \pi/2$, $(b3) \pi$, $(b4) 3\pi/2$, and $(b5) 2\pi$, where $2\pi$ corresponds to $2\tau_g$. The forward and counter flow regions, which are indicated by $\leftrightarrow$ and $\leftrightarrow$, are the upper and lower halves at $\varphi_{ph} = \pi/2$ and the lower and upper halves at $\varphi_{ph} = 3\pi/2$, respectively. The effect of the reciprocally changing surface velocity on the parallel flow line is distinctly smaller than that of the steady rotation in Fig. 2(a) because the rotation dissipation period $\tau_g$ ($= 0.355$ fs) is much smaller than the growth period $\tau_g$ ($= 23.2$ fs). The ratio $\tau_g/\tau_g$ is distinctly higher than 1.0 for general molecules because $\tau_g/\tau_g \propto M/M_{ser}$. Thus, the TBM can be regarded as steady in the dissipation period of the molecular rotation $\tau_g$, despite the frequent occurrence of RBM during $\tau_g$, because the flow line deformation owing to RBM is low under $\tau_g/\tau_g >> 1$. The Magnus effect can be ignored because the translational flow line is not deformed by the RBM.
Molecular Radius Determined by RBM
The dielectric relaxation time $\tau_{rel}$ of a molecule can be measured by locating the molecule in an electric condenser with an alternating electric field with frequency $f$. The capacity of the condenser decreases above a critical frequency $f_{cr}$ because the molecular dipole moment cannot respond to a high-frequency alternating field. The value of $\tau_{rel}$ is calculated as $\tau_{rel} = 1/f_{cr}$. Because the rotational velocity accelerated by the electric field is less than $10^{-8}$ of the average thermal rotational velocity, the applied field does not affect the accuracy of the $\tau_{rel}$ measurement [10]. The molecular sphere radii $H_{20}a_w$ and $D_{20}a_w$ are calculated by substituting the measured values of $\tau_{rel} \eta$, and $T$ of $H_{20}a_w$ and $D_{20}a_w$ into the DRF [3, 4, 5, 6, 7, 8, 9, 10]. The temperature dependence of the sphere radii $H_{20}a_w$ and $D_{20}a_w$ calculated using the DRF are illustrated in Figures 4(a) and (b), respectively, where the horizontal and vertical axes indicate the temperature ($^\circ C$) and molecular radius, respectively. The figures include three $\tau_{rel}$ measurements for $H_{20}a_w$ from 1948, 1972, and 1999 [26, 31, 32, 33] as well as one measurement for $D_{20}a_w$ from 1948 [26, 31]. The right ascending curves in Fig. 2 represent the radius expansion rate (RER) associated with T. The RER values $\Delta_{rot}$ of $H_{20}a_w$ and $D_{20}a_w$ are defined by the temperature increments divided by the lowest radii and are approximately ∆rot = 3.0 × 10⁻⁴/℃.
The thermal expansion rate (TER) is defined as (ρmax/ρ)1/3, which is determined by the temperature increase of (CLS)3. To compare the TER and RER, the radii aw,min・(ρmax/ρ)1/3 are indicated by the “thermal expansion” curves in Figure 8, where aw,min is the minimum radius. The minimum radii H2Oaw,min and D2Oaw,min of H2O and D2O are calculated as H2Oaw,min = 1.44 ± 0.01 Å at 0 °C and D2Oaw,min = 1.45 ± 0.01 Å at 10 °C because the liquid H2O and D2O densities achieve their maximum values at 3.98 °C and 11.6 °C, respectively.27 The TER ∆vol of H2O from 0 to 50 ℃ and TER ∆vol of D2O from 10 to 50 °C are ∆vol = 7.9 × 10⁻⁵/°C. Because ∆rot = 3.0 × 10⁻⁴/°C and ∆vol = 7.9 × 10⁻⁵/°C, the RER is approximately four times greater than the TER. Despite the fact that ∆rot >> ∆vol, the radii H2Oaw (= 1.44 Å) of H2O and D2Oaw (= 1.45 Å) of D2O calculated using the DRF are close to the EVR values of H2O (= 1.445 Å) and D2O (= 1.453 Å). The EVR of H2Oaw b is 7.8% smaller than CLS/2, as indicated in Fig. 3(d). Thus, the realistic radius of the LBP of water is assumed to be the EVR, which is a single molecule in the vapor state.
![Figure 11: The final distribution of n-octane [Fig. 9(i)] at t = τw shifts more strongly to the left as a result of the advection caused by a higher Vth value compared to that of n-octadecane [Fig. 9(g)], which is almost symmetrical, and the discrepancy mainly arises from the τw difference between n-octane (τw = 70 fs) and n-octadecane (τw = 15 fs). The τw extension of octane is lower than that of n-octadecane, as indicated in Fig. 15(b). The HTR increase in the spherical symmetry is numerically simulated by adopting the spherical coordinate r in the diffusive term ∆T and omitting the advection term (u・∇)T in Eq. (3.2). The final spherical temperature distributions are indicated surrounded by dotted rectangles in Fig. 9. The spherical symmetrical profile without advection and 2D profile with the advection shift can be compared in the upper-right and lower-right sides of the contour at t = τw. The final center temperature of the cold molecule is higher for the spherical calculation (upper-right) owing to the spherical convergence effect than that for the 2D calculation (lower-right). The final symmetrical distributions of n-octanol and n-octadecane at t = τw in Figure 9(e) and (g), respectively, exhibit the lowest SEV values among the alcohols and alkanes illustrated in Figure 15(b).](/fulltextimages/5921/fig_11.jpeg)
Stokes Radius Determined by TBM
The molecular radius calculated using the SEE is known as the Stokes radius, Stokesa. The Stokes radii can be calculated by substituting the measured values of D or selfD, η, and T into the SEE. The viscosities at unpublished temperature points are interpolated from the published data [27, 34, 35, 36]. The viscosities measured at lower temperatures Tlow and higher temperatures Thigh are denoted by ηlow and ηhigh, respectively. Because log10η varies linearly with 1/T within a 10 °C interval in the Arrhenius plot, ηlow and ηhigh are described similarly using the two parameters A and E as ηlow = Aexp(-E/kBTlow) and ηhigh = Aexp(-E/kBThigh), respectively, when Thigh-Tlow ≦ 10 °C, where parameter E is known as the activation energy. Because A and E are determined from these two equations, η at the intermediate temperature T (Tlow ≦ T ≦ Thigh) is uniquely calculated from η = Aexp(- E/kBT).
The temperature dependence of the Stokes radii of water are illustrated in Figure 9, where the horizontal and vertical axes are the temperature (°C) and Stokes radius, respectively. The Stokes radii of H2 16O and H2 18O calculated using the selfD values of H2 16O and H2 18O, determined by NMR, are presented in Figures 5[A](a) and (b), respectively [37]. The Stokes radii of H2 16O and H2 18O are almost similar for a temperature range of 0–60 °C. When the solute and solvent are not similar, a tracer moving in the solvent is used to determine selfD. The Stokes radius of H2O calculated using D, as determined by tracking the H2 18O tracer in H2O, is illustrated in Fig. 5[B]. Although the tracer tracking cannot measure selfD, the D value of H2 18O diffusing in H2O is considered to be the selfD value of H2O diffusing in H2O, because the Stokes radii and their temperature dependence are similar to those evaluated from the selfD values of H2 16O and H2 18O in Fig. 5[A]. Thus, H2 18O diffusing in H2O provides the basic data for the NMR measurement of selfD of H2O. The Stokes radii of H2O and D2O calculated using the selfD values of H2O and D2O, as determined by NMR, are presented in Figures 5[C](a) and (b), [20, 21] and [D](a) and (b), [38, 39] respectively. Because NMR is performed to clarify the selfD value of supercooled water, as indicated in Fig. 5[D], the fluctuation is the greatest among the results in Fig. 5. Nevertheless, the fact that the Stokes radius of D2O for a temperature approximately in the range of 0–25 °C is greater than that of H2O, as illustrated in Figures 5[C] and [D], qualitatively agrees with the radii calculated using the DRF and density, as indicated in Fig. 4. The Stokes radii of H2O and D2O calculated using the D values of H2O and D2O, which are determined simultaneously from the light- interfering frontal zone between H2O and D2O, for which the non-mixing step boundary is initially prepared, are illustrated in Figures 5[E](a) and (b), respectively [40, 41]. Because H2O, HDO, and D2O can mutually transform into one another, the difference in the Stokes radii of H2O and D2O is too low to be discriminated compared to the difference between H2Oaw and D2Oaw as obtained by NMR in Figures 5[C] and [D]. The Stokes radii of THO and TDO calculated using the D values of THO and TDO, which are determined by tracking the THO moving in the H2O and TDO moving in the D2O, are presented in Figures 5[E](a) and (b), respectively [42, 43]. The Stokes radius of TDO is greater than that of THO for a temperature approximately in the range of 0–50 °C, which qualitatively agrees with the fact that the Stokes radius of D2O is greater than that of H2O, as calculated using the DRF density in Fig. 4.
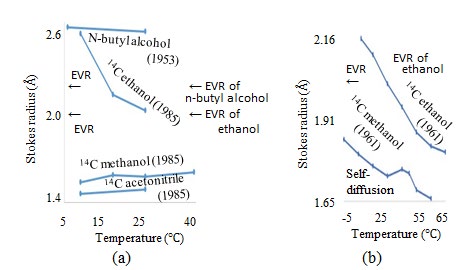
![Figure 13: (a) Temperature dependence of Stokes radii in water, calculated from D of n-butyl alcohol measured using the Gouy interference method46 and 14C-labeled ethanol, methanol, and acetonitrile.47 (b) Temperature dependence of Stokes radii, calculated from selfD measured using 14C-labeled ethanol and methanol [48].](/fulltextimages/5921/fig_13.jpeg)
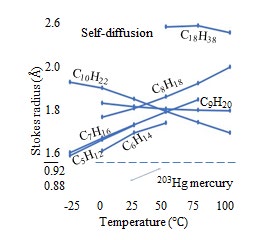
![Figure 14: Temperature dependence of Stokes radii, calculated from selfD measured using 203Hg-labeled mercury49 and NMR of normal alkanes of C5H12, C6H14, C7H16, C8H18, C9H20, C10H22, and C18H38. [50]](/fulltextimages/5921/fig_14.jpeg)
The Stokes radii of water are not supported by the EVR of water because the Stokes radii around Tρmax range from the minimum of Stokesaw,min = 1.01 Å to the maximum of 1.06 Å in Fig. 5 and are approximately 30% (= (1.44-1.0)/1.44) lower than the EVR. The right ascending curves in Fig. 5 indicate the Stokes radius expansion rate (SRE) associated with T. The SRE ∆trans of water from 0 to 60 ℃ is approximately ∆trans = 2.0 × 10⁻³/℃. To compare the TER and SRE, the radii Stokesaw,min・(ρmax / ρ)1/3 are also indicated by the “thermal expansion” curves in Fig. 5, where the minimum volumetric radius avol,min is adjusted with the minimum Stokes radius Stokesaw,min at a temperature approximately in the range of 0–10 °C. The ratio of the radius expansion rates due to the temperature increase is ∆vol: ∆rot: ∆trans = 1:4:23. Although TBM and RBM occur simultaneously, an essential difference between the SRE and DRF is identified because ∆trans is six times greater than ∆ rot, and the Stokes radius is approximately 30% lower than the EVR of water, in contrast to the radii calculated using the DRF. The accuracy for discriminating the radius difference between H2O and D2O using the SEE is found to be lower than that using the DRF.
Stokes Radius of LBP
MW Dependence
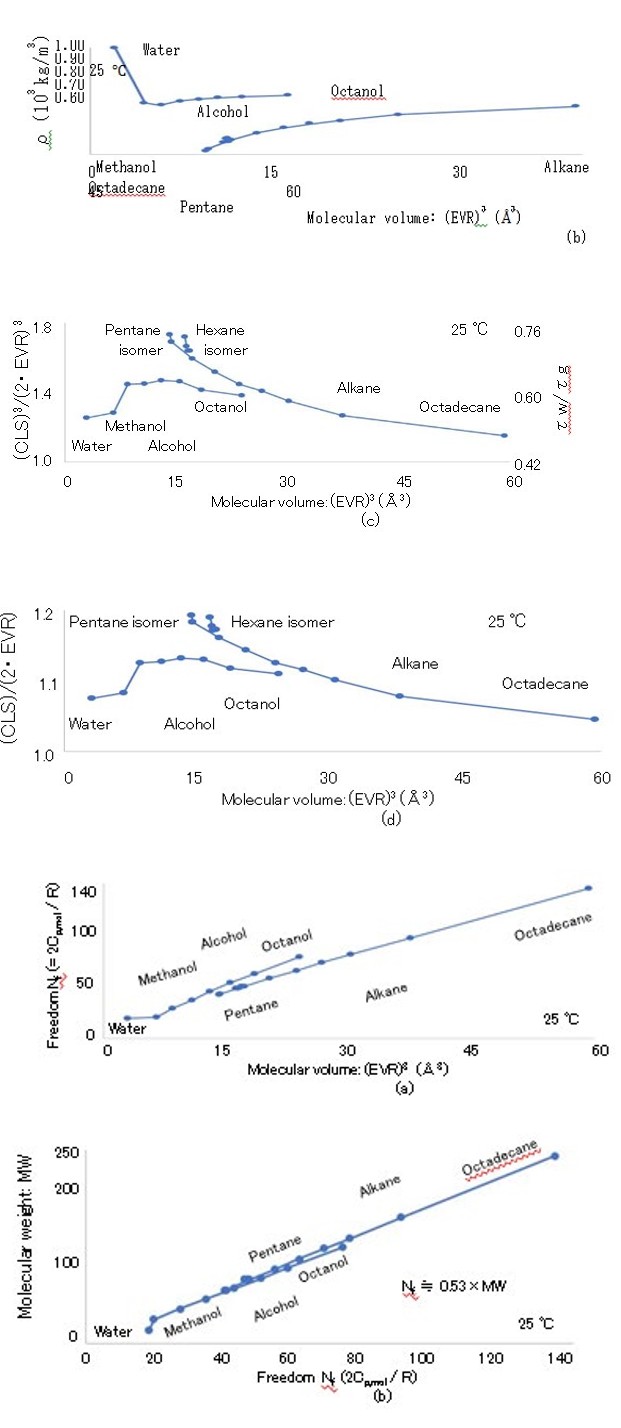
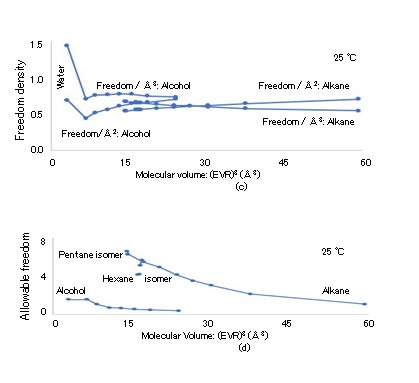
The (EVR)3 dependence of the degree of freedom Nf = (2Cp/R) is illustrated in Figure 6(a), where the horizontal and vertical axes indicate the (EVR)3 and Nf, respectively [35, 36]. The Nf values of the molecules, which are the same as those in Fig. 3(a), are strongly proportional to (EVR). The Nf dependence of the MW is depicted in Fig. 6(b), where the horizontal and vertical axes indicate the Nf and MW, respectively. The MWs of normal alcohol and normal alkane are found to exhibit strong linear relationships with Nf, as Nf = 0.53 × MW. The thermal energy assigned to the three Ntrans values causes TBM, which is related to the entire molecular mass. The ratio Nf/Ntrans is 6.07 and 44.89 for water (MW = 18, Nf = 18.2) and octadecane (MW = 254.5, Nf = 134.7), respectively. The freedoms apart from Ntrans are the molecular rotation of Nrot (= 3), atomic group rotation around single atomic bonding, and cooperative motion between the center and surrounding molecules. The freedoms over 80% in Nf are known as the partial mass freedoms Nprt, which include Nrot because they are related to the partial molecular mass (Mprt). As the rotatable single bonds among the carbons and oxygens create a joint degree of freedom, the linear relation between Nf and MW in Figure. 6(b) indicates that the increase in the rotatable single bonds (atomic group rotation) with MW contributes to Nprt. Because Nf ∝ (EVR)3 and the volume and surface area of the LBP are (4/3)π(EVR)3 and 4π(EVR)2, respectively, the volume density and surface area density of Nf are calculated as ρf = Nf /[(4/3)π(EVR)3] and σf = Nf / [4π(EVR)2], respectively. The (EVR)3 dependence of ρf in Å-3 and σf in Å-2 are illustrated in Figure. 6(c). The freedom is distributed on the surface and in the entire volume if σf and ρf are constant, respectively. Because σf and ρf increase and decrease slightly with (EVR)3, respectively, the Nf distribution is estimated to be shifted to the LBP surface, rather than the entire volume.
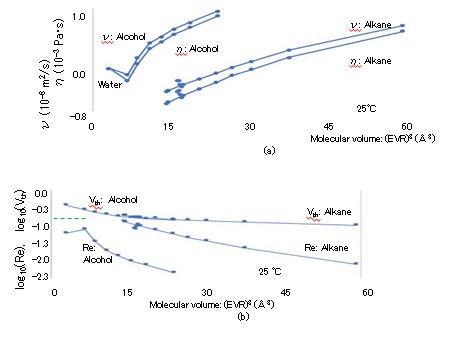
The (EVR)3 dependence of the specific heat Cp in J/K/ kg, thermal conductivity λ in W/m/K, and thermal diffusion coefficient χ [= λ/(ρCp)] in m2/s are presented in Figures 7(a), (b), and (c), respectively, where the horizontal axes indicate (EVR)3 and the vertical axes indicate Cp × 10-3, λ, and χ × 109 [35, 36]. The specific heat Cp and molar heat capacity Cp,mol are related: Cp × MW × 10-3 = Cp,mol. Despite the fact that the ρ and λ values of alcohols are greater than those of alkanes, χ is almost constant at approximately 80 × 10-9, except for the values of water and methanol. The (EVR)3 dependence of viscosity η in Pa・s and dynamic viscosity ν (= η/ρ) in m2/s are depicted in Figure 8(a), where the horizontal axis indicates (EVR)3 in Å3, and the vertical axis indicates log10(η × 103) and log10(ν × 106). The octadecane viscosity η at 25 °C is transpolated from published data at a temperature approximately in the range of 50–100 °C. The thermal velocity Vth is calculated as Vth = (kBT/M)1/2 according to the equipartition theorem. The (EVR)3 dependence of Vth is presented in Figure 8(b), where the horizontal and vertical axes are (EVR)3 in Å3 and Vth in km/s, respectively, and Vth > 0.098 km/s. The Vth of alcohol is lower than that of alkane for similar radii because alcohol contains oxygen, which is heavier than carbon. The Re of the LBPs is calculated as Re = EVR・Vth・ρ/η. The (EVR)3 dependence of Re at 25 °C is indicated in Figure 8(b), where the horizontal and vertical axes indicate (EVR)3 in Å3 and Re, respectively. Because the maximum Re is 0.13 for N-pentane (C5H12), the condition of Re << 1 in the simulation of Eq. (2.11) is satisfied. The (EVR)3 dependence of the TBM and RBM dissipation periods of τw and τp at 25 °C are illustrated in Fig. 8(c), where the horizontal axis indicates (EVR)3 and the vertical axis indicates log10(τw) and log10(τp), with τw < 117 fs and τp < 12 fs.
The (EVR)3 dependence of the flow growth period τg (= a2/ν) at 25 °C is illustrated in Fig. 8(c), where the vertical axis indicates log10(τg) and τg < 163 fs. The ratio τ_w/τg is calculated as M/(6πa3ρ) [= (M/6πaη)/(a2ρ/η)], which is 23(CLS)3/{6π(2 ・EVR)3}. The ratio of τw/τg is depicted in Figure 3(c), where τw/τg ranges from 0.42 to 0.76 proportionally to (CLS)3/ (EVR)3 ranging from 1.0 to 1.8. The flow profile around the LBP cannot precisely reach the steady state during the translational random walk time step τw because τ_w/τg < 1 in Figures 3(c) and 8(c), although it is assumed in Fig. 2 that the RBM begins once the flow profile around the LBP has reached the steady state. The motion and torque equations in Eqs. (2.3) and (2.6) are not exact for calculating τw and τp on the assumption that the RD of 6πaη and force couple of 8πa3η are in the steady state, respectively. Because the requirement for the growth period $\tau_g$ to complete the steady flow profile with an accuracy of $10^{-2}$ is too strict, the practical $\tau_w$ value is reduced by $5^{-1}$, so that the analytical flow is approximately realized in the simulation, i.e., $\tau_w/\tau_g > 1$. The three periods $\tau_w$, $\tau_p$, and $\tau_g$ should be evaluated using unsteady simulation because the flow directly following the start of the translational random walk is not sufficiently close to the analytical profile, as indicated in Figure 2(b).
One translational random walk stride $\Delta x_{\text{tra}} = V_{\text{th}} \tau_w$ $[= (k_B T/M)^{1/2} \tau_w]$ of water at $25^{\circ} \text{C}$ is $0.0458 \text{ Å}$. Because the ratio of $(2D\tau_w)^{1/2}$ to $\Delta x_{\text{tra}}$ is $2^{1/2}$, $\Delta x_{\text{tra}}$ is also regarded as the cumulative random walk displacement during $\tau_w$. The translational random walk stride-to-realistic radius ratio is expressed as $\Delta x_{\text{tra}}/\text{EVR}$. The (EVR)$^3$ dependence of the ratio is illustrated in Fig. 8(d), where the vertical axes are $\log_{10}(\Delta x_{\text{tra}}/\text{EVR})$ and $\Delta x_{\text{tra}}/\text{EVR} = 0.028$ for water. Although $\Delta x_{\text{tra}}$ is less than $10^{-1}$ of the EVR and gaps exist between the surrounding molecules, the Avogadro number average enables the surrounding molecules to be regarded as continuous media.
One rotational random walk angle $\Delta \theta_{\text{rot}} = \Omega_{\text{th}} \tau_w$ $[= (k_B T/I)^{1/2} \tau_w]$ of water at $25^{\circ} \text{C}$ is $0.00501 \text{ rad} = 0.287^{\circ}$. Because the rotational random walk stride $\Delta s_{\text{rot}}$ on the surface of the spherical molecule with radius $a$ is calculated as $\Delta s_{\text{rot}} = a \Omega_{\text{th}} \tau_w$ $[= a \Omega_{\text{th}} \tau_w]$, $\Delta s_{\text{rot}}$ of water at $25^{\circ} \text{C}$ is $0.00721 \text{ Å}$, and the ratio $\Delta s_{\text{rot}}/a_w$ is $0.005$. Thus, $\Delta s_{\text{rot}}$ can be regarded as a short straight line in a similar manner to $\Delta x_{\text{rot}}$, which supports the schematic derivation of the DRF in Eq. (2.10). Considering the equivalence between the RD in Eq. (2.3) and force couple in Eq. (2.6), the only difference between the TBM and RBM is that the mass concerned is the total mass of the molecule in the case of TBM and surface mass of the molecule in the case of RBM. The short straight line $\Delta s_{\text{rot}}$ is determined randomly at each random walk. Thus, $N$ repetitions of $\Delta s_{\text{rot}}$ for $\tau_w$ lead to an average cumulative surface displacement $s_{\text{rot}}$, given by $(<s_{\text{rot}}>^{2})^{1/2} = N^{1/2}((\Delta s_{\text{rot}})).$ Using $\Delta s_{\text{rot}} = a \Omega_{\text{th}} \tau_w$ and $N = s_{\text{rot}}/p$, the cumulative displacement $s_{\text{rot}}$ for $\tau_w$ can be derived as $s_{\text{rot}} = a \Omega_{\text{th}} \tau_w(\tau_w/\tau_p)^{1/2}$. Therefore, the ratio $s_{\text{rot}}/a_w$ calculated as $s_{\text{rot}}/\Delta x_{\text{tra}} = 0.866$, where $s_{\text{rot}}/a_w = a \cdot (M/I)^{1/2}(\tau_w/\tau_p)^{1/2}$ and $0.866 = (3/4)^{1/2}$. As this ratio does not depend on $T$ and MW, the accumulation with $(\tau_w/\tau_p)$ repetitions during $\tau_w$ causes $s_{\text{rot}}$ to be compatible with $\Delta x_{\text{tra}}$, although the ratio $\Delta s_{\text{rot}}/\Delta x_{\text{tra}} = 0.157$ is low. The cumulative angle displacement $\theta_t$ of the rotational random walk during $\tau_w$ is $\theta_t = 1.84^{\circ} = (180^{\circ}/\pi) \times 0.00501 \times (41)^{1/2}$. The (EVR)$^3$ dependence of the dielectric relaxation time $\tau_{\text{rel}} = 4\pi m a_w^3/k_T$ at $25^{\circ} \text{C}$ in Eq. (2.8) is illustrated in Figure 8(c), where $\tau_{\text{rel}} > 8.18 \text{ ps}.$ Because $\tau_{\text{rel}}/t_w$ and $\tau_{\text{rel}}/t_p$ range from $10^{2}$ to $10^{5}$ and $\theta_t = 1.84^{\circ}$, the cumulative rotational random walk angle during $\tau_w$ is negligible.
Cold Brownian Particle
The translational and rotational random walks concerning the entire $(M)$ and partial $(M_{\text{rot}})$ molecular masses are initiated with maximum velocities of $dx/dt$ and $d\theta/dt$ when the LBPs receive the center- and side-hitting impulses, respectively. The division into the center- and side-hitting impulses is similar to the fact that (translational) batting that reaches a long distance and (rotational) batting that results in rotation cannot be performed simultaneously. The exponential dissipations of $dx/dt$ and $d\theta/dt$ for the freedoms of $N_{\text{trans}}$ and $N_{\text{rot}}$ with dissipation periods of $\tau_w$ and $\tau_p$, respectively, are described as follows:
$$\frac{dx}{dt} = 1.58 \sqrt{\frac{K_B T}{M}} e^{-\frac{t}{\tau_w}}, \tau_w = \frac{M}{6\pi\eta a_w \eta}, \tag{3.1a}$$
$$\frac{d\theta}{dt} = 1.58 \sqrt{\frac{K_B T}{I}} e^{-\frac{t}{\tau_p}}, \tau_p = \frac{M}{8\pi\eta a_w^3 \eta}, \tag{3.1b}$$
where $1.58 = 1/(1-e^{-1})$ and $e = 2.72$. The time averages of $<dx/dt>$ for $\tau_w$ and $<d\theta/dt>$ for $\tau_p$ are $(k_B T/I)^{1/2} = (\Omega_{\text{th}})$, respectively, where $(1\tau_w)/0^w (dx/dt)/dt = (k_B T/I)^{1/2} and (1\tau_p)/0^w (d\theta/dt)/dt = (k_B T/I)^{1/2}$. According to $\int_0^w (dx/dt)/dt = V_{\text{th}} \tau_w$ and $\int_0^w (d\theta/dt)/dt = \Omega_{\text{th}} \tau_p$ the translational and rotational random walk strides $\Delta x_{\text{tra}}$ and $\Delta \theta_{\text{rot}}$ are calculated as $\Delta x_{\text{tra}} = V_{\text{th}} \tau_p$ and $\Delta \theta_{\text{rot}} = \Omega_{\text{th}} \tau_p$, respectively, corresponding to the schematic derivations in Eqs. (2.9) and (2.10). Because the diffusional coefficient $D$ in liquids is often enhanced by several tens of percent, the occurrences of the RD reduction and $\tau_w$ extension are estimated. Thus, it is proposed that the factor 6 in the SEE in Eq. (2.5) should be changed to a lower value. Despite the extension of $t_{\text{rot}}$ and $\Delta \theta_{\text{rot}}$ due to the new lower factor changing from 6, the time average of velocity $dx/dt$ does not change to satisfy the equipartition theorem.
The TBM and RBM relate to $N_{\text{trans}}$ and $N_{\text{rot}}$ and dissipate the equithermal energy $k_B T/2$ with dissipation periods of $\tau_w$ and $\tau_p$, respectively, where $\tau_w/\tau_p \propto M/M_{\text{rot}}$. Similarly, $k_B T/2$ assigned to $N_{\text{trans}}$ concerning $M_{\text{rot}}$ dissipates with the dissipation period $\tau_p$, which is significantly shorter than $\tau_w$ because $\tau_w/\tau_p \propto M/M_{\text{rot}}$. A majority of the motions of $N_{\text{prt}}$ are assumed to be similar to the rotational motion in Eq. (3.1b). Thus, the LBP is regarded as a cold molecule because the freedom $N_{\text{prt}}$ which occupies most of $N_{\text{prt}}$ requires the energy supply more frequently than $N_{\text{trans}}$ does. Although $\tau_p$ differs for each $N_{\text{prt}}$, $\tau_p$ is represented similarly to the rotational dissipation period $\tau_p$ as a whole, because $\tau_p \tau_p < \tau_w$.
It is difficult for the uniform laminar flow, wherein the disturbance owing to the RBM is low, as indicated in Fig. 2(b) and on which the Stokes law is based to produce molecular rotation. Because the surface rotation velocity $V_{\text{th}}$ is substantially higher than the translational velocity the molecular rotation cannot reach the necessary $V_{th}$ value even if it is induced by the directional change occurring between the two translational random walks. Thus, a single impulse cannot induce both translational and rotational motions simultaneously. Among the random impulses from the surroundings, the center- and side-hitting impulses are assumed to supply energies to $N_{trans}$ and $N_{prt}$ concerning $M$ and $M_{prt'}$, respectively. The center-hitting impulse exerts a force on the center of gravity of the center molecule to cause a directional change in the TBM with freedom $N_{trans'}$. Among the side-hitting impulses, the impulse that specifically hits the extreme edge of the center molecule initiates the RBM with freedom $N_{rot'}$. The fact that $\tau_w/\tau_p >> 1$ is similar to the fact that the outer edge area of the shooting target is substantially larger than that of the center area.
Considering that one rotational random walk angle of water is $0.287^\circ$ and the directional change in the translational random walk is molecular rotation, the time required for the directional change is estimated to be close to $\tau_p$. Thus, it is assumed that all motions of $N_{prt}$ with a short dissipation period $\tau_p$ are dissipated during the directional change, and the cold molecule temperature is reset to 0 K when the random walk starts at $t = 0$. The $N_{prt}$ value in the cold molecule is similar to a set of oscillators. After the start of the translational random walk at $t = 0$, the LBP surface is maintained at a constant temperature $T_s = 25^\circ C > T_c$, and spherical thermal conduction begins from the surface at $t \geq 0$ for the energy supply to $N_f$. The plane formed by the Cartesian coordinates of $x$ and $y$ is the cross-section of the sphere, similar to that depicted in Figure 2. The spherical coordinate of $r$ is in the radial direction. The origins of $x, y$, and $r$ are located at the sphere center. The time course of the temperature profile $T(r,t)$ as a function of $r$ and $t$ is described by Eq. (3.2):
$$\rho C_p = \left[ \frac{\partial}{\partial t} + (u.\nabla) \right] T(r,t) = \lambda \Delta T(r,t) \tag{3.2}$$
where $\Delta T(r,t)$ is $(1/r^2)(\partial/\partial r)^2(\partial/\partial r)T(r,t)$ for the spherical coordinates and $(\partial/\partial x^2 + \partial/\partial y^2)T(x,y,t)$ for the Cartesian coordinates. The initial and boundary conditions are $T (0 \leq r \leq a, t < 0) = T_c$ and $T (r = a, t \geq 0) = T_s$, respectively, and $a$ is the sphere radius. The freedom density $\rho C_p \left[ \propto N_f/(CLS)^2 \right]$ is assumed to be uniformly distributed throughout the cold molecule in Eq. (3.2). The suction of the high-temperature region (HTR) owing to $\chi = \lambda/\rho C_p$ towards the bottom center of the cold molecule (depression) at $t = 0$, $0.5\tau_w$ and $\tau_w$ are illustrated in Figure 9(a), where the horizontal and vertical directions are indicated by the $x$ and $y$ axes, respectively. The contour representing the temperature distribution in the $x-y$ plane is presented in the upper part. The vertical temperature profile along the $x$ axis at $y = 0$ is presented in the lower part. A temperature of 0 K reset at $t = 0$ exhibits a step-like depression. The HTR is formed below the LBP surface after $t = 0$. The low-temperature region (LTR) is formed simultaneously owing to diffusion on the LBP surface and is gradually extended with time, as indicated by the bright color. Because the bottom temperature $T_{cnt}$ at $r = 0$ is the lowest in the cold molecule, the difference ratio $(T_s - T_{cnt})/T_s$ decreases with time. When the advection term $(u\vec{V})$ is ignored, the growth period $\tau_{the}$ required for the ratio to become less than $10^{-2}$ can be derived analytically as follows:
$$\tau_{the} = 0.507 \frac{a^2}{\chi} \tag{3.3}$$
Equation (3.3) describes the center temperature of the cold molecule reaching $25^\circ C$ after $t = \tau_{the}$, i.e., when all motional freedoms $N_f$ are supplied with energy [44, 45].
The (EVR)$^3$ dependence of $\tau_{the}$ is illustrated in Fig. 8(c). The replenishment of $N_f$ with energy is not completed during $\tau_w$ because $\tau_{the}/\tau_w$ ranges from 3.0 to 50.0. The fact that $N_f$ of alcohol is higher than that of alkane at similar radii in Figure 6(a) is estimated to be a result of the cooperative motion caused by the hydroxyl group of alcohol. This cooperative motion is assumed to form the majority of the $N_f$ because the $N_f$ value of water without atomic group rotation is 18.2. This supports the shift of the $N_f$ distribution to the LBP surface, as indicated in Figure 6(c), because the cooperative motion is associated with the surrounding molecules. The freedom density $\rho C_p$ is assumed to be uniform in Eq. (3.3). However, $\tau_{the}$ decreases and is close to $\tau_w$ if the $\rho C_p$ distribution is shifted to the LBP surface. Although the HTR does not reach the bottom center until $t = \tau_w$ in Figure 9(a), the shift of the $\rho C_p$ distribution to the LBP surface aids in supplying all freedoms with energy during $\tau_w$. Because the energy of the majority of $N_{prt}$ is supplied by side-hitting, the directional change in the TBM to which energy is supplied by center-hitting may be delayed, i.e., the LBP prefers side-hitting over center-hitting impulses for the energy supply to $N_{prt}$ in accordance with the equipartition theorem.
The delayed directional change leads to an extension of $\tau_w$. The extended $\tau_w$ enhances the diffusional coefficient $D$ because $D \propto \tau_w$ according to Eq. (2.9). Thus, the reduced Stokes radius is evaluated from the enhanced D, i.e., the enhanced D and extended $\tau_w$ are evaluated from the reduced SEV because D is inversely proportional to the Stokes radius in the SEE. Although the reduction in the Stokes radius can be explained by the RD reduction, which omits the denominator of 6 in the SEE as per Eq. (2.5), it can also be attributed to the $\tau_w$ extension in Eq. (2.9). As discussed previously, the RD reduction, which is caused by the slipping of the solute moving through the gaps between solvents, results in the unreal reduction in the SEV. However, the $\tau_w$ extension (rather than the RD reduction) is subsequently determined to cause the unreal reduction in the SEV, as explained in Section III-IV.
Because τw is distinctly shorter than τthe, the allowable freedom Nallow, which can receive energy during τw, is defined as Nallow/Nf = τw/τthe, where the energy supply to all freedoms Nf is assumed to be completed during τthe. The (EVR)3 dependence of Nallow is illustrated in Fig. 6(d). As τw is shorter for alcohol owing to its higher η, the Nallow value of alcohol is lower than that of alkane. Because Nallow = (λ/η){MW/ (EVR)3}(M/ρ)(10-3/3πR), the (EVR)3 dependence of Nallow is approximately determined by 1/η, and the maximum Nallow values for alcohol and alkane are 1.57 and 6.3, respectively. The order of Nallow is approximately close to Ntrans (= 3). Thus, the random walk time step τw is not sufficient for the energy supply to the majority of freedoms Nprt. However, τw is sufficiently long for the energy supply to Ntrans, which is used for the next directional change in the random walk. Even if a longer time is required for M to make the directional change with Ntrans than for Mprt to create motions with Nprt, it appears that the minimum time for supplying Ntrans with energy is secured. Among the center- and side-hitting impulses supplying Ntrans and Nprt with energy, respectively, the LBP is estimated to prefer side-hitting for the energy supply to Nprt, and at times, the center-hitting is skipped for the next directional change according to the equipartition theorem. The resultant delay in the directional change leads to τw extension and RD reduction, which means an enhancement in the diffusional coefficient D. Thus, the SEV is reduced by the enhanced D. The fact that the SEV is lower than 1.0 for most molecules can be explained by this mechanism. The extension of τw is not necessarily advantageous to the energy supply when χ is low, which will be discussed in Section III-V.
The energy supply (inflow) to the cold molecule following the 0 K reset is similar to a suction falling into a depression. When the upper edge of the circular cup is lowered slightly from the surrounding water level, uniform water inflow occurs into the cup bottom. The water inflow owing to the water level difference is similar to diffusive thermal transfer (DTF) using the temperature gradient. When the cup moves horizontally at a constant speed and vertical level, the arriving flow levels up the water surface at the cup front. The high water level enhances the water inflow at the front, which is similar to water accumulating at the bow of a ship. The enhanced water inflow is similar to advective thermal transfer (ATF) because the random walk with thermal velocity Vth is equivalent to the arriving flow passing the LBP. The energy inflows using DTF and ATF are referred to as suction and influx, respectively. The time course of the temperature contour illustrated in Figure 10 is obtained by a two-dimensional (2D) thermal transfer simulation using the difference scheme of Eq. (3.2), similar to the fluid simulation using Eq. (2.11). The LBP is replaced with an infinite cylinder of radius a (= EVR), which is placed perpendicular to the x–y plane. The suction of the HTR towards the cold molecule as a result of DTF from the start until the random walk end is illustrated in the time course of the temperature contour in Figure 9(a), where no translational motion is assumed to visualize the DTF effect only. Because the arriving flow cannot complete the growth during τw, as demonstrated in Section II-III, the arriving flow passing the cold molecule from right to left is assumed to exhibit a uniformly parallel velocity Vth. The parallel arriving flow, which is the initial condition of the flow simulation in Figure 2, is suitable for emphasizing the ATF effect in the contour, representing the temperature distribution in the x–y plane, where the molecular rotation is not calculated. The solid angles within the polar angle θv = 48.19° from the front center [0 ≤ θv ≤ 48.19°] and back center [(180 - 48.19) ≤ θv ≤ 180°] are (1/6)・4π. Because the PF occupies 1/3 of the entire RD (F = 6πaηU) and is effective around the front (θv = 0) and back (θv = π) centers, where the parallel flow hits and pulls almost normally on the sphere surface, ATF is assumed to be caused around the front center at 0 ≤ θv ≤ 48.19°. The initial temperature contour with the flat 0 K cup bottom is shown on the left of Figure 9(a). Eight bright points are plotted at θv = 0, ±48.19, ±90, ± (180 - 48.19), and 180° on the cold molecular surface. Because the eight points are plotted in all contours, the growth of the HTR and LTR below and on the LBP surface can be recognized in the contours. The ATF and DTF simulations are performed using the diffusive [∆T] and advective [(u・∇)T] terms in Eq. (3.2), with the boundary condition that the temperature on the sphere surface for 0 ≤ θv ≤ 48.19° shifts from right to left with velocity Vth.
The competing effects between DTF and ATF are visualized for n-pentane in Figures 9(a) to (c). The HTR growth of n-pentane is the most distinct owing to the longest time step τw (= 117 fs), although χ of n-pentane is the lowest. To compare the DTF and ATF, the arriving flow velocity is set as 4Vth and 0.5Vth in Figures 9(b) and (c), respectively. The front HTR area is larger as a result of advection in Fig. 9(b) than in Fig. 9(c), similar to a fast ship accumulating substantial water on its bow. The vertical temperature profile shifts to the left more significantly in Fig. 9(b) than in Fig. 9(c). The temperature distribution is asymmetric or symmetric according to whether the flow is strong or weak, respectively, at t = τw. The perfect 0 K reset at the end of the random walk is assumed to be impossible because a certain amount of thermal energy must remain in the situation where the velocity is close to stopping and the contact between the surrounding molecules decreases. In such a situation, the new part of the cold molecule can be heated efficiently by selecting the center-hitting impulse without a delay in the directional change if the temperature distribution is strongly asymmetric [Fig. 9(b)]. However, the cold molecule with the symmetrical temperature distribution may delay the directional change and extend the random walk time step τw because the LBP, which requires as much side-hitting as possible, does not select the center-hitting impulse for efficient energy supply [Fig. 9(c)]. The comparison between Figures 9(b) and (c) is partly similar to relaxation recovery, such as the addition of a T1 shortening agent to obtain a higher T1-contrast 1H-NMR signal. Although the arriving flow velocity Vth of n-pentane is artificially changed into (a) Vth → 0, (b) Vth → 4Vth, and (c) Vth → 0.5・Vth in the comparison between DTF and ATF, those of (d) water (τw = 12 fs, Vth = 370 m/s), (e) n-octanol (τw = 5.4 fs, Vth = 137 m/s), (f) ethanol (τw = 19 fs, Vth = 231 m/s), (g) n-octadecane (τw = 15 fs, Vth = 98 m/s), (h) n-pentane (τw = 117 fs, Vth = 185 m/s), and (i) n-octane (τw = 70 fs, Vth = 147 m/s) are not changed in Fig. 9.
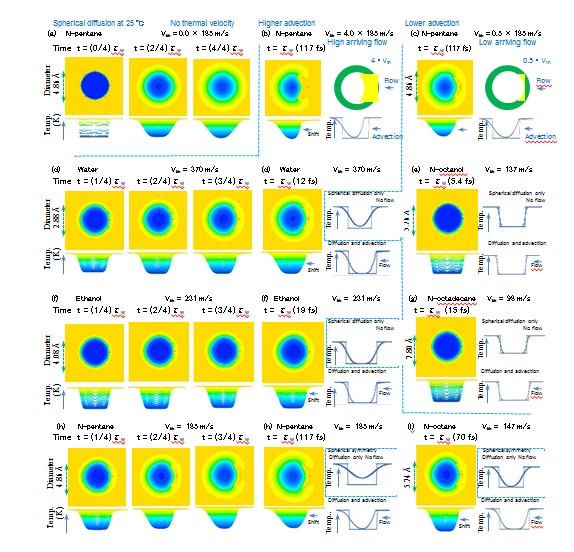
Figures 9(d), (f), and (h), indicating water, ethanol, and n-pentane, respectively, reveal HTR increase at t = (1/4) τw, (2/4)τw, (3/4)τw, and (4/4)τw, where the temperature distribution is initially symmetric at t = (1/4)τw and finally asymmetric at t = τw owing to the competition between advection and diffusion. Figures 9(e) and (g), which indicate n-octanol and n-octadecane, respectively, illustrate symmetrical distributions even in the final stage at t = τw owing to the lower ATF, exhibiting the greatest extension of τw among the alcohols and alkanes in Figure 11. The final distribution of n-octane [Fig. 9(i)] at t = τw shifts more strongly to the left as a result of the advection caused by a higher Vth value compared to that of n-octadecane [Fig. 9(g)], which is almost symmetrical, and the discrepancy mainly arises from the τw difference between n-octane (τw = 70 fs) and n-octadecane (τw = 15 fs). The τw extension of octane is lower than that of n-octadecane, as indicated in Fig. 15(b). The HTR increase in the spherical symmetry is numerically simulated by adopting the spherical coordinate r in the diffusive term ∆T and omitting the advection term (u・∇)T in Eq. (3.2). The final spherical temperature distributions are indicated surrounded by dotted rectangles in Fig. 9. The spherical symmetrical profile without advection and 2D profile with the advection shift can be compared in the upper-right and lower-right sides of the contour at t = τw. The final center temperature of the cold molecule is higher for the spherical calculation (upper-right) owing to the spherical convergence effect than that for the 2D calculation (lower-right). The final symmetrical distributions of n-octanol and n-octadecane at t = τw in Figure 9(e) and (g), respectively, exhibit the lowest SEV values among the alcohols and alkanes illustrated in Figure 15(b).
Temperature Dependence of Stokes Radius
The D values of gases in water have been measured [27]. The temperature dependence of the Stokes radii of the mono-atomic gases, atmospheric components, and other gases are presented in Figure 10(a), (b), and (c), respectively, with Figure 10(c) also illustrating the atmospheric components. The D values of n-butyl alcohol diffusing in water are measured using Gouy interference at 1 and 25 °C, [46] whereas those of 14C-labeled methanol, ethanol, and acetonitrile in water are measured at T = 5, 15, 25, and 40 °C, at T = 5, 15, and 25 °C, and at T = 5 and 25 °C, respectively [47]. The temperature dependence of the Stokes radii calculated using these D values are illustrated in Figure 12, where the horizontal and vertical axes indicate the temperature and Stokes radius, respectively, and the published years are provided in parentheses. The selfD values are measured using 14C-labeled ethanol and methanol from -5 to 65 °C [48]. The temperature dependence of these Stokes radii are shown in Fig. 11(b). The Stokes radii of n-butyl alcohol and ethanol are greater than their EVRs because the EVRs of n-butyl alcohol and ethanol are 2.356 Å and 2.051 Å, respectively, with the EVRs indicated by the horizontal arrows on the vertical axes in Fig. 11. The selfD values are measured using 203Hg-labeled mercury, [49] as well as NMR of normal alkanes of n-pentane (C5H12), n-hexane (C6H14), n-heptane (C7H16), n-octane (C8H18), n-nonane (C9H20), n-decane (C10H22), and n-octadecane (C18H38) [50]. The temperature dependence of these Stokes radii are illustrated in Figures 13 and 14.
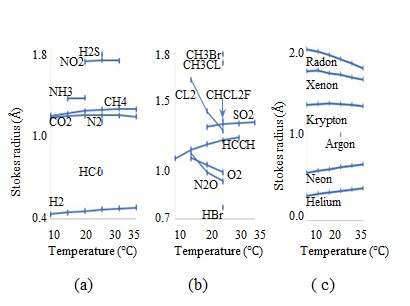
Figure12: Temperature dependence of Stokes radii of (a) and (b) multi -atomic gases, and (c) rare gases diffusing in water.
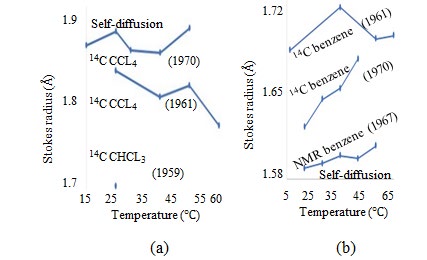
The differences in the diffusion coefficients generated by each measurement are evident. The selfD values are measured using 14C-labeled tetrachlomethane (CCL4) and trichlomethane (CHCL3), [51] and the temperature dependence of these Stokes radii are presented in Fig. 12(a). The Stokes radius of the CHCL3 measured only at 25 °C is plotted in Figure15 to verify that the Stokes radius of CCL4 is greater than that of CHCL3, in accordance with the EVR order. The differences in the selfD values of D2O owing to the measurement methods used—NMR and DTO isotope tracking—have been discussed. The selfD values are measured using 14C-labeled benzene and NMR of benzene [52]. The temperature dependence of these Stokes radii are shown in Fig. 13(b). The figure indicates that the Stokes radii of benzene and CCL4 determined by tracking 14C-labeled molecules differ within 10% between the two measurements, and the Stokes radii of benzene deviate within 10% between the NMR and 14C-label tracking measurements.
Even if the Stokes radius difference as a result of the experimental method is considered, the change in the Stokes radius is within 15% in the experimental temperature range from 0 to 50 °C [19]. Therefore, a comparison of the Stokes radii at 25 °C will be meaningful.
Stokes Radius Compared to Realistic Radius
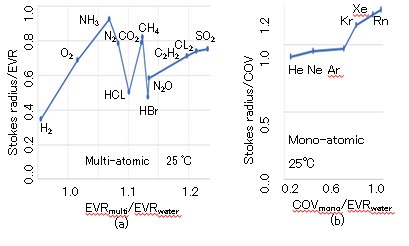
The Stokes radii of gases can be calculated using D at 25 °C, as illustrated in Fig. 14, where the solutes and solvent are gases and water, respectively. The SEV values of the multi- atomic gases are shown in Fig. 14(a), where the horizontal and vertical axes indicate the solute-to-solvent radius ratio (EVRsolute/EVRsolvent) and Stokes radius-to-realistic radius ratio (Stokes radius/EVRsolute), respectively. Although the realistic radius of the multi-atomic gas is assumed to be EVR, those of the mono-atomic gases are assumed to be covalent bonding radii (COV) because the EVR of mono-atomic gas does not normally increase with the atomic number. Thus, the Stokes radius-to-COV ratio is replaced with the SEV for the mono- atomic gases. The SEV values of the mono-atomic gases are illustrated in Fig. 14(b), where the horizontal axis indicates the solute-to-solvent radius ratio (COVsolute/EVRsolvent). It is observed that the SEV values of the multi- and mono-atomic gases are lower and higher, respectively, where those of He, Ne, and Ar are approximately 1.0. Thus, it is estimated that the cold molecules of the multi-atomic gases with rotational freedom are colder than those of the mono-atomic gasses without rotational freedom, and it is estimated that τw of the mono-atomic gas is not extended.
Figure 15(a) presents the (EVR)3 dependence of selfD of the following at 25 °C: normal alcohol [water (HOH), methanol (CH3OH), ethanol (C2H5OH), n-propanol (C3H7OH), n-butanol (C4H9OH), n-octanol (C8H17OH)], normal alkanes [n-pentane (C5H12), n-hexane (C6H14), n-heptane (C7H16), n-octane (C8H18), n-nonane (C9H20), n-decane (C10H22), and n-octadecane (C18H38)], and isomers [isopentane (CH3CH2CH(CH3)2), 3-methylpentane {CH3CH2CH(CH3) CH2CH3}, 2-methylpentane {(CH3)2CH(CH2)2CH3}, 2,3-dimethylbutane {(CH3)2CHCH(CH3)2}, and 2,2-dimethylbutane {(CH3)3CCH2CH3}]. The horizontal and vertical axes indicate (EVR)3 in Å3 and log10(selfD), respectively, with the analytical selfDanal and measured selfDmeas values indicated alongside [50, 53]. The selfDanal value is calculated by substituting EVR into the molecular radius in the denominator of the SEE, whereas selfDmeas is determined by NMR. The SEV values, which are obtained from the Stokes radii calculated using selfDmeas, are presented in Fig. 15(b).
The enhanced selfDmeas is evaluated by the ratio selfDmeas/ selfDanal, which is proportional to (SEV)-1 and indicates the τw extension degree because D ∝ τw. The SEV values are close to 1.0 for ethanol and propanol, where selfDmeas/selfDanal is the lowest. Apart from the values for ethanol and propanol, SEV < 1.0 and selfDmeas/selfDanal > 1.
Advective and Diffusive Thermal Transfer
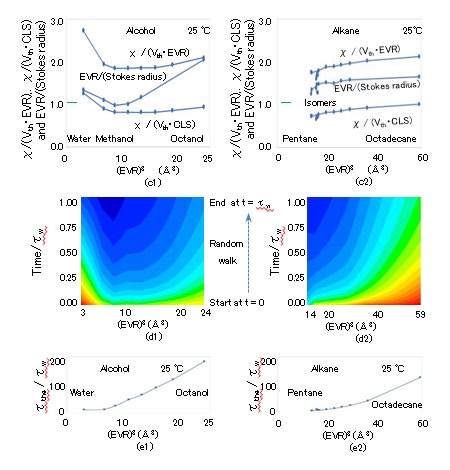
The energy suction Γdff is proportional to the temperature gradient ΔT/EVR and thermal conductivity λ, which is expressed as Γdff = λ・ΔT/EVR, where ΔT = 298.15 K ( = 25℃) and EVR is the gradient distance between the LBP surface and surrounding molecule center. The suction quantity Edffs through the side area during τw using ATF is λ・(ΔT/EVR)・π(EVR)2・τw [= Γdffπ・(EVR)2・τw], with the side area of the cold molecule assumed as π(EVR)2. The advance of the LBP during τw with velocity Vth forms the volume Vadv = π(EVR)2Vthτw because it can be regarded as a disk with a cross- section π(EVR)2 and thickness Vthτw. The thermal energy Eadvc contained in Vadv at 25 °C is Eadvc = (Cpρ)・[π(EVR)2Vthτw] ・ΔT, which is the influx quantity across the LBP front during τw using ATF. As χ = λ/(Cpρ), the diffusive-to-advective thermal transfer ratio (DAR) can be obtained as χ/(Vth・EVR) (= Edffs / Eadvc), which indicates the superiority of the DTF or ATF according to whether χ/Vth・EVR is high or low, respectively. Because the maximum temperature gradient distance can be set as the CLS (> EVR), the DAR ranges from χ/Vth・CLS to χ/Vth・EVR. The (EVR)3 dependence of Vth・EVR and Vth・CLS, which are the denominators of the DAR, are illustrated in Fig. 7(d). The denominators are proportional to (EVR)-0.5 and decrease gradually with (EVR)3 because Vth ∝ MW-1/2, MW ∝ (EVR)3, and CLS ≒ EVR. As the average χ (≒ 80 × 10-9 m2/s) is located at the center of the range from Vth・EVR to Vth・CLS, the ATF and DTF are compatible, and both contribute to the energy inflow to the cold molecule.
The initial LBP temperature at which the translational random walk begins is assumed to be 0 K because the dissipation period τp of most freedoms is substantially shorter than τw. After the start at t = 0, the energy suction forms the HTR beneath the LBP surface, whereby the energy concerns Nprt and is supplied by side-hitting from the surroundings. The HTR thickness Δthe increases with time and the growth velocity increases with χ because Δthe = (2χt)1/2, and it approaches the bottom center before t = τw, as illustrated in Fig. 9(a). It is assumed that the increase in the HTR thickness is terminated and the LBP temperature is reset to 0 K at the random walk start. The (EVR)3 dependence of Δthe/EVR is shown in Fig. 8(d), where the vertical axis indicates log10(Δthe/EVR). Because the HTR thickness Δthe is close to EVR (Δthe ≒ EVR) at the end of the random walk, the energy suction appears to fill the cold molecule. However, the expectation contradicts the fact that a maximum of 6.3 freedoms can receive energy during τw, as illustrated in Fig. 6(d). The ATF is proportional to Δxtra (= Vthτw), which is the advance of the LBP during τw. The (EVR)3 dependence of Δxtra/EVR is indicated in Fig. 8(d), where the vertical axis indicates log10(Δxtra/EVR). Because Δxtra/EVR < 10-1 and Δthe/EVR > 10-1, the ATF appears to be inferior to the DTF. However, the ATF is compatible with the DTF even if Δxtra/ EVR < 10-1 and Δthe/EVR > 10-1 because the influx (ATF) is generated by the distinctly steeper temperature gradient concentrated on the LBP front, which is created by the arriving flow, whereas the suction (DTF) is generated by the temperature gradient being uniformly distributed around the LBP. The (EVR)3 dependence of (SEV)-1, χ/(Vth・EVR), and χ/(Vth・CLS) are shown in Fig. 15(c), representing the degrees of the τw extension and selfD enhancement. A comparison between Fig. 15(c) and Fig. 7(c) reveals a closer relation between the τw extension [∝ (SEV)-1] and χ. The (SEV)-1 value is located between χ/(Vth・CLS) and χ/(Vth・EVR) in Fig. 15(c). The moderate increase in (SEV)-1 with (EVR)3 accords with the (EVR)0.5 proportionality of (Vth・EVR)-1 and (Vth・CLS)-1, where χ is almost constant at the higher MW alkane, as illustrated in Figures 7(c) and (d). Thus, the DAR, namely the balance between DTF and ATF, is expected to predict the τw extension and SEV reduction. The SEV values of the isomers of pentane and hexane are higher than those of n-pentane and n-hexane (Fig. 15(b)), which is in accordance with the fact that the χ values of the isomers are lower than those of n-pentane and n-hexane (Fig. 7(c)). Thus, the difference in the SEV between the normal alkane and isomer of alkane is supported by the DAR. The assumption that the RBM acts as only the freedom Nrot to receive energy and does not agitate the thermal inflow into the LBP is valid for evaluating the DAR because the flow line deformation is low despite the frequent RBM occurrence, as indicated in Fig. 2. The value Re = Vth・EVR/ν is the advective-to-diffusive momentum transfer ratio, which is obtained from the ratio [ρ(u・∇) u]/[η∇2u] in Eq. (2.11a). Similarly, (DAR)-1 [= Vth・EVR/χ] is obtained from the advective-to-diffusive ratio [ρC_p(u・∇) _T]/[λ∇2T] in Eq. (3.2). The fact that χ/(Vth・EVR) > 1.0 in Fig. 15(c) explains the phenomenon whereby the arriving flow with Vth does not shift the center of the circular LTR around the cold molecule, as shown in Fig. 9, similar to the laminar flow for Re < 1.0 in Fig. 2(b).
The suction starts at t = 0 with the maximum velocity Γdff, which is caused by the temperature gradient ∂T/∂r and can be obtained numerically on the LBP surface during the heat transfer simulation, as illustrated in Fig. 9. The suction velocity Γdff (= λ・∂T/∂r) decreases with increases in the HTR thickness and bottom temperature. The time course of Γdff in alcohols and alkanes when artificially setting no advection (Vth = 0.0), as indicated in Fig. 9(a), is presented in Fig. 15(d), where the horizontal and vertical axes are (EVR)3 and the time normalized by τw, respectively. The start and end of the random walk at t/τw = 0.0 and t/τw = 1.0, respectively, are indicated on the vertical axis. In the equi-contour plot of log10Γdff, the higher and lower values are indicated by bright and dark colors, respectively. The higher temperature gradient ∂T/∂r is maintained for longer when the MW of the cold molecule is higher, i.e., more time is required to fill larger LBPs with energy. The (EVR)3 dependence of the ratio of the time τthe [= (EVR)2/χ] required to achieve uniform temperature in the cold molecule on τw [= M/6π(EVR)η] is shown in Fig. 15(e), where the horizontal and vertical axes are (EVR)3 and τthe/τw, respectively. Because τthe/τw ∝ (EVR)3η/(MW∙χ) and (EVR)3/MW ∝ ρ, τthe/τw ∝ Prandtl number (Pr = η/χ), indicating the thermal insulation property (adiabaticity), in which a distinct change is determined by η. Because τthe increases with EVR, τthe is greater than τw for higher-MW LBPs, as illustrated in Fig. 8(c). However, τthe approaches τw in the lower-MW LBPs in alcohol and alkane in Fig. 15(e), i.e., the adiabaticity increases τthe/τw. In this situation, the suction Γdff is rapidly weakened with the fast decrease in ∂T/∂r because a shorter time is required to saturate smaller LBPs with energy. As the final center temperature of n-pentane is greater than 0 K in Fig. 9(h), the HTR almost reaches the center, and the cold molecule is almost saturated at t = τw. The saturation weakens Γdff more rapidly in the lower-MW molecules of alcohol and alkane, as illustrated in Fig. 15(d). A comparison between Figures 15(c) and (d) reveals that water, higher-MW alcohols, and higher- MW alkanes, which maintain a higher Γdff at t = τw, exhibit a higher (SEV)-1, whereas ethanol, butanol, and pentane, which maintain the lowest Γdff at t = τw, exhibit the lowest (SEV)-1 in alcohols and alkanes, respectively. Thus, it is expected that the increase in Γdff at t = τw delays the directional change in the random walk and causes the τw extension and that the cold molecule close to the saturation with the lower remaining suction Γdff does not delay the directional change at t = τw. Even if advection is not considered, the (SEV)-1 value in Fig. 15(c) can be qualitatively predicted from the final ∂T/∂r at t = τw in Fig. 15(d). The ratio τthe/τw can qualitatively predict the τw extension, which is observed as the (SEV)-1 enhancement, i.e., the LBP, which terminates the random walk far from saturation, will delay the directional change under higher adiabaticity. It is concluded that the τw extension is caused by both DTF and ATF because the most accurate prediction of (SEV)-1 is provided by the DAR among the DAR, τthe/τw, and Γdff.
RD Reduction
It has previously been established that the directional change in the random walk is delayed by LBPs slipping through the liquid molecular gaps. In contrast, in this study, it is determined that the directional change is delayed for the energy supply to the freedoms. The cross-section of the LBP is defined by the plane perpendicular to the directional axis, as indicated in Figure 16, which displays the center molecule and the six surrounding molecules in the case of water self- diffusion. The azimuthal angle 0° ≤ φ ≤ 360° is measured in the cross-section. The LBP surface is assumed to be divided into two regions: the suction groove and rubbing laminar, where the side-hitting supply energy to Nprt and decelerate the translational motion as the RD, respectively. Four and two water spheres are located on the rubbing laminar and suction grooves, respectively. Because the Stokes radius of water at 25 °C is 1.08 Å and the EVR is 1.44 Å, the SEV is 3/4 (= 1.08/1.44). The angle widths of the rubbing laminar and suction groove are φrub = 135° and φsuc = 45°, which are derived from 180° × SEV and 180° × (1-SEV), respectively. The azimuthal angles φspr covering the rubbing laminar and suction groove are 0° ≤ φ ≤ φrub and 180° ≤ φ ≤ (180° + φrub ), and φrub ≤ φ ≤ 180° and (180° +φrub ) ≤ φ ≤ 360°, respectively. The division between the two regions is only dependent on φ and not on θ, i.e., the suction groove and rubbing laminar form alternative stripes. One suction groove forms a stripe groove continuing from θ = 0° to θ = 180° with an azimuthal angle width of φsuc. If one rubbing laminar and one suction groove exist, the center of gravity may shift owing to impulse imbalances. Thus, two rubbing laminars and two suction grooves are located face to face in symmetrical positions. If the surrounding molecules in the suction groove do not decelerate the center molecule in the form of the RD and the surface area ratio of the suction groove to the rubbing laminar is 1:3, the RD is reduced, and the factor 6 in the denominator of the SEE is changed to 4.5. In this situation, the SEV of water at 25 °C becomes 1.0 by assuming that 1/4 of the surrounding molecules on the LBP surface do not decelerate the center molecule. The formation of the alternative stripes is valid because the LBP displacement angle is less than 2° during τw, as indicated in Section III-1, and the flow deformation owing to RBM can be ignored, as demonstrated in Section II-III.
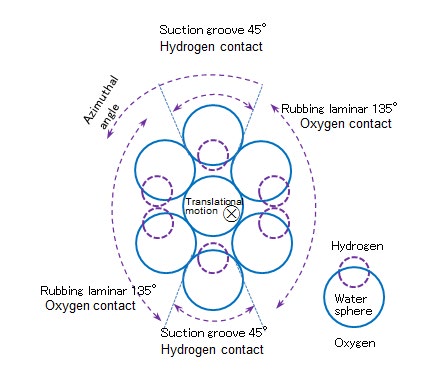
The six surrounding molecules can uniformly contact the center molecule if φrub = 120.0° and φsuc = 60.0° because 60.0° is 360° /6. It is assumed that oxygen (body) and hydrogen (edge) contacts occur between the water molecules, provided that the distance between them is sufficiently short or not, respectively, among the side-hittings. Only edge contact between the surrounding molecules in the suction groove and center molecule is permitted because the azimuthal width φsuc = 45° is too narrow for the surrounding molecule to approach the center molecule. Edge contact is suitable for the side-hitting impulse. Both body and edge contacts are permitted in the rubbing laminar because the azimuthal width φrub = 135° is sufficiently wide. It can easily be assumed that the RD that decelerates the center molecule is created by body contact instead of edge contact. Although proton transfer has been proposed in electric conductance, the proton dissociation probability can be ignored within the timescale τw because the Stokes radii determined by tracking TDO and D2O in H2O are similar to those determined without using isotopes, as illustrated in Fig. 5. This fact supports the suction groove assumption. Moreover, the assumption that the rubbing laminar narrowed by the suction groove reduces the RD and extends τw provides a similar effect to the slipping condition if the cold molecule actually requires the inhalation-exclusive suction groove for a frequent energy supply to Nprt.
Discussion
The translational Ntrans and rotational Nrot degrees of freedom of the LBP receive energy from center- and side- hitting impulses from the surroundings, similar to the two batting types that provide long distance and rotation to balls, respectively. The entire (M) and partial (Mprt) molecular masses of the LBP relate to Ntrans (= 3) and Nrot (= 3), respectively. The viscous dissipation periods of the TBM and RBM are τw and τp, which are proportional to M and Mprt, respectively, where τw is the random walk time step, because M >> Mprt and τw >> τp. The overall motional freedom Nf, which is calculated from the molar heat capacity, is more than six times Ntrans. The freedom Nprt using Mprt (except for Ntrans using M) is concerned with the molecular rotation, atomic group rotation, and cooperative motion. Because the motions based on Nprt are similar to those based on Nrot, they are assumed to have nearly the same viscous dissipation periods τprt ≒ τp (<< τw). The thermal energy should be assigned to all freedoms Nf according to the equipartition theorem, where Nf ≒ 0.53 × MW. Because the freedom Nprt, which occupies the majority of Nf, requires an energy supply more frequently than Ntrans, the LBP is regarded as a cold molecule. The directional change between the two random walks is based on Ntrans and is caused by the center-hitting impulse. The energy of the cold molecule is reset to 0 K during the directional change because the center-hitting impulse cannot supply Nprt with energy and τprt << τw. In this situation, the LBP fundamentally prefers the side-hitting impulse for Nprt over the center-hitting impulse for Ntrans for efficient energy supply to Nprt. Thus, the LBP delays the directional change of the random walk. The resultant τw extension enhances the diffusional coefficient D because D ∝ τw. The Stokes radius a, calculated using the SEE, is reduced because a ∝ 1/D. The reduction of the Stokes radius, which is frequently observed, can be explained by the τw extension. Because the growth period τg required for the arriving flow around the LBP to reach the steady state is sufficiently longer than τprt (τg >> τprt), the arriving flow line is not deformed by RBM. The cumulative rotational random walk angle during τw is within 2° because the dielectric relaxation time τrel is sufficiently longer than τw and τg. These two phenomena indicate that the RBM does not agitate the thermal inflow to the cold molecule, and the RBM acts as only the freedom Nrot to suction energy. The τw extension was previously explained by the RD reduction caused by the slipping condition, whereby the macroscopically determined viscosity is reduced on the molecular scale because the LBP can easily slip through the liquid molecular gaps.
The fundamental energy inflow to the cold molecule is expressed by the DTF using the thermal diffusivity χ (= λ/ Cpρ). The HTR increases uniformly from the LBP surface to the LBP center after the 0 K reset at the random walk start, where the growth velocity increases with χ. Because the random walk is equivalent to the arriving flow with thermal velocity Vth, the energy influx from the arriving flow creates an HTR hump beneath the LBP front surface using ATF. When the DAR is low, the HTR hump exists conspicuously, compared to the uniformly and slowly distributed HTR created by the DTF. In this situation, the random walk changes directions regularly without the τw extension to seek a new HTR hump other than that at the LBP front. The diffusional coefficient D is close to the realistic value because D ∝ τw. When the DAR is high, the HTR hump created by the ATF is inconspicuously buried in the uniformly and rapidly distributed HTR. In this situation, the directional change to seek a new HTP hump other than that at the LBP front is not advantageous because the LBP requires continued side-hitting impulses for the energy supply to Nprt rather than one center-hitting impulse. Thus, the random walk delays the directional change, and the resultant τw extension enhances D. The realistic molecular radius is calculated from the EVR in the vapor state, which is the van der Waals b constant. The degree of the enhanced D is evaluated by (SEV)-1 (∝ D). The DAR is defined as χ/(Vth・EVR) or χ/(Vth・CLS) to express the competition between the DTF and ATF. The DAR can predict the SEV range because χ/(Vth. CLS) < (SEV)-1 < χ/(Vth・EVR). Therefore, the DAR can predict the enhancement of D apart from the slipping condition, despite the following pre-assumptions: the cold molecule prefers side-hitting over center-hitting impulses and the cold molecule temperature is reset to 0 K at the random walk start. Because the freedom and molecular size of alcohol are lower than those of alkane, the period τthe required to achieve a uniform temperature in the cold molecule is shorter for alcohol than for alkane. The energy suction into the cold molecule is weakened more rapidly for lower-MW alcohol than for alkane because a smaller cold molecule is saturated with energy more rapidly than larger-MW molecules, which leads to a more substantial reduction in χ for alcohol than for alkane. The DAR of alcohol can generally be set as lower than that of alkane if the reduced χ for alcohol owing to the smaller molecular size is substituted into χ/(Vth・EVR).
The fact that the SEV values of multi-atomic gases diffusing in water have been found to be smaller than those of mono-atomic gasses supports the thermal diffusivity effect on the TBM. The D comparison of multi- and mono- atomic gases diffusing in other solvents such as alcohol and alkane is desirable. Because the Stokes’ law radius is inversely proportional to the electrophoretic velocity vep, the smaller Stokes’ law radius is considered to be a result of the RD reduction in Stokes’ law caused by the slipping condition. As the electrophoretic motion is regarded as the cumulative translational random walk, the unreal Stokes’ law radius caused by the RD reduction can be explained by the τw extension, without the slipping condition. In cases where the solute and solvent differ, it has been established that the D value of the solute is enhanced when the solute slips through the liquid molecular gaps. In cases where the hydrogen of the solute is substituted with chlorine or bromine, it has been found that D is enhanced and the SEV is reduced even if the EVR of the solute becomes greater than that before the substitution. It is significant that an adequate setting of the DAR can predict the enhanced D, except for self-diffusion.
The flow simulation was performed under low-Re conditions (Re << 1). However, the actual Re calculated on the LBP surface will exceed 0.1 because the Re determined by the center velocity Vth is close to 0.1, and the surface velocity Vth,s is substantially higher than Vth. Thus, the difference in the tendency of the Stokes radii of lower and higher MW alkanes increasing and decreasing with the temperature, respectively, may be related to the vortex generation caused by Re (> 0.1). The difference in the temperature dependence between the H2O and D2O radii calculated using the TBM and RBM may also be related to vortex generation. Unsteady flow and heat simulations that include the advection term (vortex generation) should be performed because the RD in the SEE and force couple in the DRF are derived from Stokes’ law in the steady state. The comprehensive investigation into the difference between the molecular radii calculated using TBM and RBM validated the Stokes radius comparison at 25 °C in their temperature dependence. Because the Stokes radii of TDO in D2O and H2O are similar to those calculated from the H2O self-diffusion, the proton dissociation was ignored, which supported the flow simulation passing the single sphere. Despite the reduced Stokes radius, the finding that the Stokes radii of D2O and TDO are greater than those of H2O and THO, respectively, supports the validity of the hydrodynamics used in the SEE.
In the NMR diffusion measurement, the LBPs were assumed to continue moving forward in the magnetic field gradient without reversing. Monte Carlo simulation including an LBP that experiences both reverse and forward motions will clarify the difference in selfD between NMR and isotope tracking.
Conclusion
The cause of the enhanced selfD of the LBP was found to be the thermal transfer without the use of the slipping condition (i.e., the LBP can easily slip through the liquid molecular gap). The partial mass freedom Nprt associated with the atomic group rotation of the LBP is more than eight times the total mass freedom Ntrans associated with the directional change in the random walk, and the viscous dissipation period τp of Nprt is significantly shorter than the random walk time step τw. Thus, the LBP can be regarded as a cold molecule requiring a significantly more frequent thermal energy supply than the regular directional change occurring every τw. The DTF and ATF transfer thermal energy into the cold molecule. The DTF involves heat inflow towards the LBP center uniformly from the surroundings using χ (= λ/ Cpρ), and the ATF carries heat to the LBP front using the arriving flow with the thermal velocity Vth of the LBP. The selfDanal value was calculated by substituting the realistic molecular radius into the SEE for comparison with selfDmeas. The ratio selfDmeas/ selfDanal could evaluate the selfD enhancement and τw extension, in accordance with the DAR in water, alcohol, and alkane at 25 °C. Thus, the DAR—the balance between ATF and DTF— was expected to predict the τw extension. It was determined that the thermal conduction time required to fill the sphere of the cold molecule with energy was significantly longer than τw. Moreover, the cold molecule prefers side-hitting impulses from the surroundings for the energy supply to Nprt, according to the equipartition theorem, rather than the center-hitting impulses causing the directional change in the random walk. The analysis explained the fact that selfDmeas/ selfDanal is greater than 1 as a whole, i.e., τw is extended in a majority of liquid molecules. Because the enhancement of D is often observed in cases other than self-diffusion, further focus will be directed on extending the thermal transfer analysis to general diffusion with an adequately assumed DAR based on the solute and solvent properties without the slipping condition.
Acknowledgement
T.O. is grateful to the late Dr. Kodi Husimi, Professor
Emeritus of Nagoya University and Osaka University, for his insightful contributions.
The data that support the findings of this study are available from the corresponding author upon reasonable request.
References
-
A Einstein (1956) Investigations on the theory of the Brownian motion. Dover, New York.
-
W Sutherland (1905) XXV A dynamical theory of diffusion for non-electrolytes and the molecular mass of albumin 9(54): 781-785.
-
Robinson RA, Stokes RH (1955) This Week’s Citation Classice. Electrolyte Solutions (Butterworths, London.
-
J Perrin Atoms (1990) Thermal Motion. Ox Bow Press.
-
Debye P (1929) Polar Molecules by P. Debye, Ph. D., Professor of Physics and Direktor of the Physical Institute in the University of Leipzig, Germany. Dover, New York, PP: 84.
-
Kubo R, Ichimura H, Usui T, Hashitsume N (1999) Statistical Mechanics. North-Holland, Amsterdam.
-
Atkins P, Paula J, Keeler J (2018) Atkins’ Physical chemistry 11th (Edn.), Oxford University Press, Oxford.
-
Dusenbery DB (2009) living at micro scale. Harvard University Press, Cambridge.
-
Berne BJ, Pecora R (2000) Dynamic light scattering with applications to chemistry, biology, and physics. J Chem Educ 54(1): A430.
-
Osuga T, Tatsuoka H (2009) Magnetic field transfer of water molecules. J App Phys 106: 094311
-
Lamb H (1945) Hydrodynamics. Dover, New York.
-
Batchelor GK (1967) An Introduction to Fluid Dynamics. Cambridge University Pres.
-
Hayamizu K, Matsuo A, Arai J, Electrochem J (2009) A Divalent Lithium Salt Li2B12F12 Dissolved in Propylene Carbonate Studied by NMR Methods Soc 156(9): A744-A750.
-
Ue M, Murakami A, Nakamura S (2002) A Convenient Method to Estimate Ion Size for Electrolyte Materials Design. J Electrochem Soc 149(10): A1385
-
Matsuura N, Umemoto K, Takeda Y (1975) Formulation of Stokes’ Radii in DMF, DMSO and Propylene Carbonate with Solvent Structure Cavity Size as Parameter. Bull Chem Soc Jpn 48(8): 2253-2257.
-
E. McLaughlin (1959) Viscosity and self-diffusion in liquids. Trans Faraday Soc 55: 28-38.
-
Edward JT (1970) Molecular volumes and the Stokes- Einstein equation. J Chem Edu 47(4): 261.
-
Collings AF, Mills R (1970) J Chem Soc Faraday Trans 66: 2761.
-
Longsworth LG (1954) Temperature Dependence of Diffusion in Aqueous Solutions. J Phys Chem 58(9): 770.
-
Wilbur DJ (1976) Self‐diffusion in compressed liquid heavy water. J Jonas J Chem Phys 65(5): 1783.
-
Krynicki K, Green CD, Sawyer DW (1978) Pressure and temperature dependence of self-diffusion in water. Faraday Discuss Chem Soc 66: 199.
-
Osuga T, Han S (2004) Proton magnetic resonance imaging of diffusion of high- and low-molecular-weight contrast agents in opaque porous media saturated with water. Magn Reson Imaging 22(7): 1039.
-
Holmes WM, Maclellan S, Condon B, Dufès C, Evans TRJ, et al. (2007) High-resolution 3D isotropic MR imaging of mouse flank tumours obtained in vivo with solenoid RF micro-coil. Phys med biol 53(2): 505.
-
Onsager L, Fuoss RM (1932) Irreversible Processes in Electrolytes. Diffusion, Conductance and Viscous Flow in Arbitrary Mixtures of Strong Electrolytes. J Phys Chem 36(11): 2689.
-
Osuga T, Ikehira H, Weerakoon B (2017) Diffusion Coefficient Measurements of T1-Enhanced Contrast Agents in Water Using 0.3 T Spin Echo Proton MRI. Nanomed. & Nanotechnol Open Access 2(2): 000122.
-
Eisenberg D, Kauzmann W (1969) The Structure and Properties of Water. Oxford University Press, pp: 21.
-
Haynes WM, Lide DR, Bruno TJ (2013) CRC handbook of chemistry and physics 93rd and 99th (Edn.), Boca Raton, Fla. CRC Press.
-
Frohlich H (1949) Theory of Dielectrics: Dielectric Constant and Dielectric Loss. Clarendon, Oxford, pp: 63.
-
Booth F (1951) The Dielectric Constant of Water and the Saturation Effect. J Chem Phys 19(4): 391.
-
Osuga T, Sakamoto H, Takagi T (1998) Hydrodynamic Analysis of Electroosmotic Flow in Capillary .J Phys Soc Jpn 65(6): 1854 1998).
-
Collie EH, Hasted JB, Ritson DM (1948) The Cavity Resonator Method of Measuring the Dielectric Constants of Polar Liquids in the Centimetre Band. Proc Phys Soc 60(2): 145.
-
Hasted JB, Franks F (1972) The Water Molecule, Water-A Comprehensive Treatise. Plenum, New York 1: 277.
-
Buchner R, Barthel J, Stauber (1999) The dielectric relaxation of water between 0°C and 35°C. J Chem Phys Lett 306(1-2): 57-63.
-
Kudish AI, Wolf D, Steckel F (1972) Physical properties of heavy-oxygen water. Absolute viscosity of H218O between 15 and 35°C. J Chem Soc Faraday Trans 68: 2041-2046.
-
Riddick JA, Burger WB, Sakano TK (1986) Organic solvents. Journals of pharmaceutical sciences 60(70: 1112-1112.
-
JA Dean (1999) Lange’s handbook of chemistry, McGraw- Hill (Eds.), New York.
-
Harris KR, Woolf LA (1980) Pressure and temperature dependence of the self-diffusion coefficient of water and oxygen-18 water. J Chem Soc Faraday Trans 76(1): 377- 385.
-
Price WS, Ide H, Arata Y (1999) Self-Diffusion of Supercooled Water to 238 K Using PGSE NMR Diffusion Measurements. J Phys Chem 103(4): 448.
-
Price WS, Ide H, Arata Y, Soederman O (2000) Temperature Dependence of the Self-Diffusion of Supercooled Heavy Water to 244 K. J Phys Chem B 104(25): 5874- 5876.
-
Easteal AJ, Edge AVJ, Woolf LA (1984) Isotope effects in water. Tracer diffusion coefficients for water (oxygen-18) (H218O) in ordinary water. J Phys Chem 88: 6060-6063.
-
R Mills (1973) Self-diffusion in normal and heavy water in the range 1-45.deg. J Phys Chem 77: 685-688.
-
Woolf LA (1974) J Chem Soc Faraday Trans 71: 784.
-
Woolf LA (1975) J Chem Soc Faraday Trans 72(1): 1267.
-
Arpaci VS (1996) Conduction of Heat Transfer. Addison- Wesley, New York.
-
Osuga T (2000) Characteristic Time Required to Achieve Uniform Temperature in Thermal Conduction of N-Dimensional Sphere Heated from Surface. Jpn J Appl Phys 39: 6111.
-
Lyons PA, Sandquist CL (1953) A Study of the Diffusion of n-Butyl Alcohol in Water Using the Gouy Interference Method. J AmChem Soc 75(16): 3896- 3899.
-
Easteal AJ, Woolf LA (1985) Pressure and temperature dependence of tracer diffusion coefficients of methanol, ethanol, acetonitrile, and formamide in water. J Phys Chem 89(7): 1066- 1069.
-
Rathbum RE, Babb DC (1961) Self-Diffusion In Liquids. Iii. Temperature Dependence in Pure Liquids. J Phys Chem 65(6): 1072-1074.
-
Brown DS, Tuch DC (194) Trans. Faraday Soc 60: 1230.
-
Douglass DC, McCall DW (1958) Diffusion in Paraffin Hydrocarbons. JPhys Chem 62: 1102-1107.
-
Hardt AP, Anderson DK, Rathbun R, Mar BW, ALBabb (1959) Self-Diffusion in Liquids. II. Comparison between Mutual and Self-Diffusion Coefficients. J Phys Chem 63: 2059-2061.
-
Falcone DR, Douglass DC, McCall DW (1967) Self- diffusion in benzene. J Phys Chem 71: 2754-2755.
-
McCall DW, Douglass DC (1959) AndersonEW Diffusion in Liquids. J Chem Phys 31: 1555.
- Solution-Processed Chiral Perovskites for Biomedical Applications
- Nanotechnology in Health Chemistry and Medicine: Current Challenges and Future Directions
- Human Exposure to Micro- and Nanoplastics: Pathways, Toxicity, and Intervention Strategies
- Exosome Nanomedicine for Cancer Therapy
- Micro and Nanoplastics–Plastisphere, Biotoxicity, Impact on Human Health, and Mitigation Strategies
- Process Validation of Cefixime Powder for Suspension Dosage Form, 50 mL