Growth and Characterization of L-Tyrosine Zinc Acetate Single Crystals: A Promising Material for Opto-Electronic Applications
Of late well-known unique semi-organic NLO (nonlinear optical) material L-tyrosine zinc acetate (LTZA) single crystal was synthesized and its importance single crystals developed from aqueous solution by slow evaporation technique. The grown crystals LTZA were characterized using single crystal XRD and confirmed by powder XRD. Using FT-IR spectroscopy the functional groups and the modes of vibrations of LTZA were identified. The UV-Vis- NIR transmittance spectrum shows that good transmittance in the visible region with the lower cutoff wavelength at 235 nm. The energy band gap value is 5.289eV. The thermal decomposition process was examined by TGA and DTA. The surface features are examined by SEM. The mechanical strength of LTZA was estimated by micro hardness studies. The dielectric response of the crystal with different range of frequencies and temperature were studied. The frequency dependence of ac conductivity for various temperatures was studied. Photoconductivity study was carried out to analyze the response of LTZA crystal to the incident visible light. The Kurtz powder SHG test shows that the LTZA crystal is an efficient applicant for optical SHG. The conversion efficiency is around 3 times that of KDP and also one of the highest values in L-tyrosin family of the properties information that the present material may be an effective applicant for optoelectronic devices.
Introduction
In the world of recent optical technologies a NLO materials plays a vital role particularly in the field of harmonic generator, colour displays, medical diagnostics, optical switching, optical communication and optical computing [1, 2, 3, 4]. Most of the amino acid organic crystal exhibit NLO property because of non- centrosymmetry, dipolar nature due to the presence of protonated amino group and deprotonated carboxylic group. It is coordinated with metallic ions provides a compound with owing mechanical and thermal properties. Crystals of amino acids combining with inorganic salts to yield materials taking higher chemical stability, wide transparency collection in the visible and ultraviolet spectral region, weak Vander Walls and hydrogen bond, high resistance to laser induced damage, enormous nonlinearity, low angular sensitivity and zwitter ionic nature of the molecule which favors mechanical hardness [5, 6, 7, 8]. With these knowledge most of the researchers tried to develop hybrid materials, the described crystals are l-leucine nitrate, l-valine cadmium bromide, l-tyrosine doped KDP, l-alanine alaninium picrate, l-tyrosine sodium nitrate, [9, 10, 11, 12, 13, 14, 15]. In the present work, we report the bulk growth of single crystal L- tyrosine zinc acetate (LTZA) and its characterization were studied by single crystal/ powder XRD, FTIR, UV-Vis-NIR analysis, thermal, dielectric, AC and DC conductivity, morphological, mechanical, hardness and SHG of the compound.
Experimental Techniques
Materials, Synthesis, Solubility, Crystal Growth
L-tyrosine zinc acetate (LTZA) were synthesized via mixing L-tyrosine and zinc acetate dehydrate in Millipore water of resistivity 18.2 MΩ cm in a molar ratio of 2:1.
The chemical reaction was characterized schematically in Scheme 1.
The solubility being the key factor for bulk crystal growth, it was determined for the temperature range of 32 to 50ºC in steps of 5ºC by gravimetric technique. Also high solubility is not satisfactory for the growth bulk single crystals. Also low solubility restricts the dimension and speed of development of the crystals. So, neither a flat nor a steep solubility curve cans modification the growth of bulk crystals since solution. If the solubility gradient is extremely tiny, slow evaporation of the solvent is that the higher option for crystal growth to attain the super saturation within the solution. Solvent with less viscosity is superior for slow evaporation. The solubility curve of LTZA is presented in Figure 1. It’s seen in the graph, it is observed that the solubility increases linearly with temperature. The solubility of LTZA at 50ºC is valued to be 8g/100ml in Millipore water is suitable to allow the development of virtuous importance single crystals of reasonable size.
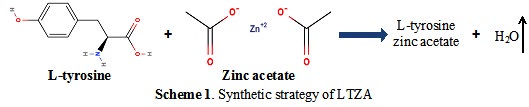
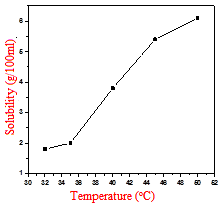
Figure1: Solubility curve of LTZA.
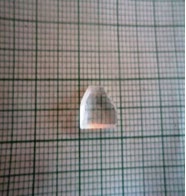
The prepared solution was allowed to dry at room temperature and the salts were obtained via slow evaporation technique. The clarity of the synthesized salt was further improved by successive recrystallization process. After re- crystallisation a transparent single crystals of dimensions 9mm x 7mm x 7mm was attained within 40 days. Figure 2 shows the developed crystals of LTZA and confirms without any additions and imperfections which is one of the fundamental needs for the materials to be used for the device fabrications.
Characterization Techniques
The crystalline powders derived from the grown crystals of LTZA were analyzed for composition, phase, spectral, nonlinear optical, ac and dc conductivities and thermal properties whereas the cut and polished single crystals were utilized to characterize them for linear optical, emission, electrical and mechanical properties. Enraf Nonis CAD-4 single crystal X-ray diffractometer was used to calculate the XRD measurements. For these measurements, graphite mono-choromated (MoKα) radiation was utilized with the wavelength λ = 0.71071Aο. The FT-IR spectrum of LTZA was recorded in the range 4000–400cm-1 employing Perkin Elmer grating infrared spectrophotometer by KBr pellet technique. An optical absorption spectrum of LTZA in the UV- Vis- NIR was recorded in the wavelength range 200- 800 nm employing VARIAN CARY 5E spectrophotometer. The grown LTZA crystals were subjected to SEM analysis using JD-2300 analysis system with resolutions 1 µm. To study thermal properties, TG/DTA analysis was carried out by NETZSCH STA 409 C/CD using alumina crucible as a reference in the range of temperature between 0 and 1000ºC with a heating rate of 10ºC min-1 in protected nitrogen atmosphere. Photoconductivity and dielectric studies of LTZA crystals were studied using Keithley 485 picoammeter and HIOKI MODEL 3532-50 LCR HITESTER, respectively. The SHG efficiency was measured for the grown crystal LTZA using Kurtz and Perry powder technique.
Results and Discussions
Single Crystal and Powder XRD
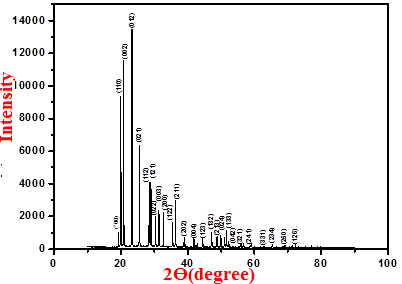
The grown LTZA crystals were exposed to single crystal XRD studies by Enraf Nonis CAD-4 diffractometer. The wave length of X-ray used was 0.71073 Å and 293 K temperature was maintained during the experiment. The compound crystallizes in the orthorhombic, space group P21 with cell constants: a = 5.54Å, b = 7.72Å, c = 8.61Å, α = β = γ = 90˚, V = 368Å3. The LTZA crystals have been exposed to powder XRD using a Rich Seifert diffractometer with CuKα radiations of wavelength 1.5418Å. Figure 3 shows powder XRD pattern of LTZA. The peaks observed from XRD spectrum were analyzed and indexed, the grown crystals belongs to orthorhombic system and the calculated lattice parameters is in good agreement with the data obtained from single XRD. The crystal data have been presented in Table 1.
FT-IR Spectral Analysis
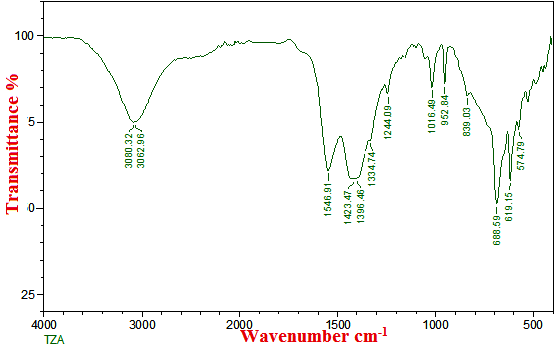
FTIR spectra were recorded to recognize the chemical bonding and these spectral analyses also provide information regarding the molecular structure of the compound. Each and every chemical compounds make sure their own typical infrared spectrum [16, 17]. FTIR spectrum of the LTZA compound noted in the range of 4000- 400 cm-1 using a Perkin-Elmer Spectrum RXI spectrometer by KBr. [18] and observed FTIR spectra are depicted in Figure 4. The assignments confirm the presence of various functional groups present in the material which is tabulated in Table 2.
| Identification code | Single crystal XRD data | Powder XRD data |
|---|---|---|
| Temperature (K) | 292 | 303 |
| Wavelength (Å) | 0.717 | 1.5418 |
| Crystal system | Orthorhombic | Orthorhombic |
| Space group | P21 | P21 |
| a (Å) | 5.54 | 5.528 |
| b (Å) | 7.72 | 7.7 |
| c (Å) | 8.61 | 8.598 |
| α = β= γ (0) | 90 | 90 |
| Volume (Å3) | 368 | 366 |
Table 1: Comparative XRD data of grown LTZA single crystal.
| Wavenumbers | Assignments |
|---|---|
| 3080 | N-H Streching |
| 3063 | O-H Stretching |
| 1547 | C-O stretching |
| 1424, 1397 | C=C stretching |
| 1335 | CH3 deformation |
| 1244 | C-O-C streching |
| 1017, 953 | C-H in-plane bending in benzene ring |
| 839, 689 | C-H out-of-plane bending in benzene ring |
| 619 | NH2 vibration |
| 575 | C-C-N out of plane bending vibration |
Table 2: Vibrational Assignments of LTZA.
Ring stretching vibrations are considerably imperative in the spectrum of aromatic compound and are highly characteristic of the aromatic ring itself. Bands between 1650 and 1400 cm-1 in benzene derivatives are consigned to ring vibrations. For our case the different intensity bands are observed at 1424 and 1397 cm-1 in FT-IR and has been assigned to C=C stretching vibrations. The benzene ring C-H in-plane bending vibrations are generally weak and occurred in the regions 1300-1000cm-1 while the C-H out-of-plane bending vibrations fall in the region 900-650 cm-1 [19]. The in-plane bending vibrations of LTZA are observed at 1017 and 953 cm-1 in FT-IR. The intense IR bands at 839 and 689 cm-1 are identified as C-H out-of-plane bending of phenyl ring. Wavenumbers observed at 3063 and 3080 cm-1 are recognized as O-H and N-H stretching vibration, respectively. Further the strong band predicted at 619 cm-1 corresponds to NH2 vibration and the weak band viewed at 574 cm-1 could be due to the effect of C-C-N out of plane bending vibration.
UV-Visible Spectral Analysis
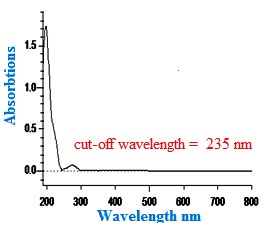
The ultraviolet (UV)-visible spectrum provides restricted
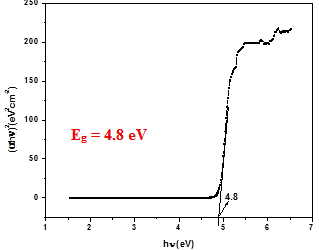
information regarding the configuration of the molecule as a result of the absorption of UV and visible light take in elevation of the electron in σ and π orbital from the ground state to excited energy states. Transmission spectra are vital for any NLO material as a result of a NLO material is sensible use only it’s extensive transparency window. The optical property of LTZA was studied in the wavelength range 800- 200 nm and is displayed in Figure 5 and shows that the UV cut-off wavelength is 235 nm, which is sufficiently low for SHG laser radiation at 1064nm. The forbidden energy gap Eg was estimated from the relation and Eg is found to be 5.289 eV. Figure 6 shows the Tauc’s plot of grown LTZA crystal and the Eg is found to be 4.8eV. The wide optical band gap of the material shows that the material is a typical of dielectric materials and it is the desirable property for SHG.
3
1.243 10 /
$$ E _ {g} = 1. 2 4 3 x 1 0 ^ {3} / \lambda_ {m a x} $$
Surface Morpholgy Analysis
The SEM is used for the examination and analysis of the micro structural characteristics of solid objects. The interaction of the electron beam with the specimen produces a variety of signals that are used for imaging and spectroscopy. The grown LTZA crystals were subjected to SEM analysis using JD-2300 analysis system with resolutions 1 µm is displayed in Figure7 and very clear that LTZA possesses almost smooth surface, free from defect and dislocations are an essential property of NLO materials and for device fabrications.
![Figure 8: The compound starts to decomposes at 135°C which proves that the absence of water molecule. The stage of decomposition from 135oC to 229oC results in the decomposition of the tyrosine acetate compound. The calculated mass loss (89.3 %) is in good agreement with the observed mass loss (89 %). The final stage of decomposition between 229oC to419oC corresponds to the loss of zinc atom as a residue. The calculated value of mass loss 11.7 % is in good agreement with the observed value (11%). The DTA trace reveals that there is a sharp endothermic peak at135°C free from the weight losses of TGA. The sharpness of this peak displays the high degree of purity and crystallinity of the sample [20]. The thermograph further reveals that the material is fully decomposed at around 229oC beyond which it becomes volatile. Thus, the DTA thermogram conforms to the TG mass loss pattern.](/fulltextimages/6024/fig_8.png)
Thermal Analysis
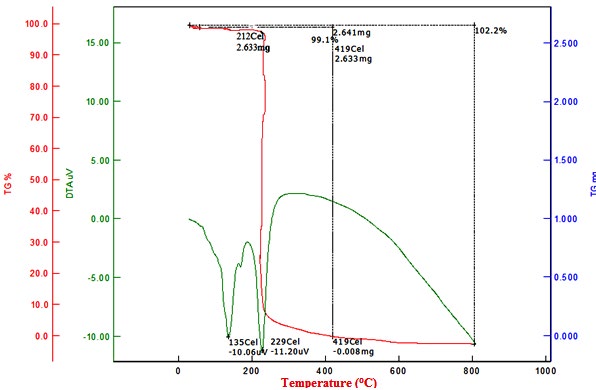
In the field of optics and optoelectronics, the thermal properties are of important as far as device fabrications. The thermo gravimetric analysis (TGA) and differential thermo gram analysis (DTA) were carried out for the grown crystals and corresponding graphs are shown in Figure 8. The compound starts to decomposes at 135°C which proves that the absence of water molecule. The stage of decomposition from 135oC to 229oC results in the decomposition of the tyrosine acetate compound. The calculated mass loss (89.3 %) is in good agreement with the observed mass loss (89 %). The final stage of decomposition between 229oC to419oC corresponds to the loss of zinc atom as a residue. The calculated value of mass loss 11.7 % is in good agreement with the observed value (11%). The DTA trace reveals that there is a sharp endothermic peak at135°C free from the weight losses of TGA. The sharpness of this peak displays the high degree of purity and crystallinity of the sample [20]. The thermograph further reveals that the material is fully decomposed at around 229oC beyond which it becomes volatile. Thus, the DTA thermogram conforms to the TG mass loss pattern.
Dielectric Studies
The dielectric constant and dielectric loss of LTZA crystal was measured. The studies were carried out from 40ºC to 100ºC for frequencies varying from 50Hz to 50MHz. The dielectric constant εr was calculated by the formula A Cd $$ \varepsilon_ {r} = \frac {\mathcal {D}}{\varepsilon_ {0} ^ {2}} $$
The εr of the material is due to the contribution of polarization such as electronic, ionic, dipolar and space- charge, which depends on the frequencies [21]. Figure 9 shows the variation of εr with the frequency ν at various temperatures. It is noticed that the εr is relatively high at lower ν and it decreases with increasing ν because at high ν almost all type of polarizations are active.
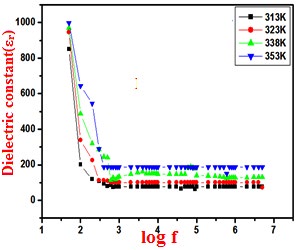
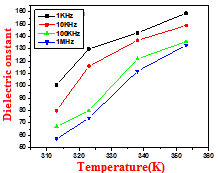
In the low-frequency region the dielectric constant and loss of ionic crystals relies on the crystal structure, electronic and atomic polarizability of constituent ions [22]. Generally, space-charge polarization is energetic at high temperatures with lower frequencies and indicates the perfection of the crystals [23]. It is very clear from Figure 10 that the dielectric constant εr decreases with rise in frequency for several temperatures. This is a typical dielectric behavior [24] that both εr and ε″ decrease with increasing ν.
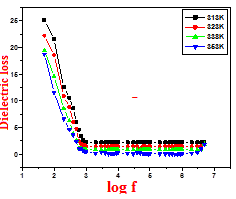
The dielectric loss was calculated using the relation $$ \varepsilon^ {\prime \prime} = \varepsilon_ {r} D $$ Where, D is the dissipation factor Figures 11, 12 shows the variation ε″ with respect to ν and T, respectively. In the low ν region ε″ depends on factors like size and defects of the crystal [25]. It is observed that the ε″ sturdily rely on the frequency of the applied field similar to what commonly happens in the case of dielectric constant of the ionic system [22, 26, 27]. The low value of ε″ at higher ν indicates that the grown crystal possess defect less good optical quality of the crystals which is one of the favorite effects for NLO crystals [28, 29].
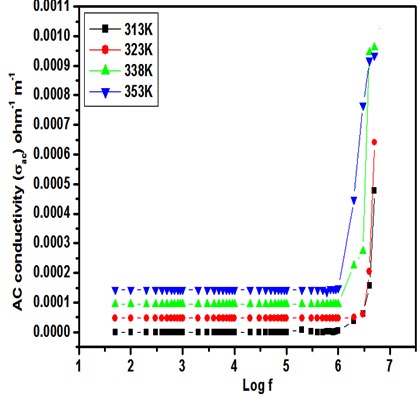
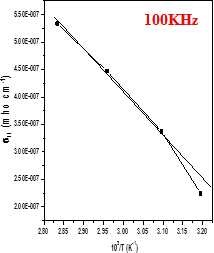
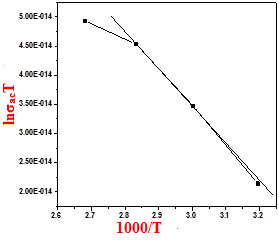
![Figure 13: As seen from the graph it is noticed that ac conductivity increases with increase in ν which is owing to the reduction in space charge polarization at higher frequencies [30]. Figure 14 shows the plot of ac conductivity vs 1000/T and it specifies that the conductivity increases with T. The Arhenius plot of lnσacT vs 1000/T is depicted in Figure 15, from the graph the activation energy was noticed at 0.0821eV and the sample exhibits Arhenius type of conductivity.](/fulltextimages/6024/fig_13.png)
AC and DC Conductivity Studies
The grown LTZA crystal was applied for AC electrical conductivity measurement over a temperature range 313- 373K and the corresponding plot is shown is Figure 13. As seen from the graph it is noticed that ac conductivity increases with increase in ν which is owing to the reduction in space charge polarization at higher frequencies [30]. Figure 14 shows the plot of ac conductivity vs 1000/T and it specifies that the conductivity increases with T. The Arhenius plot of lnσacT vs 1000/T is depicted in Figure 15, from the graph the activation energy was noticed at 0.0821eV and the sample exhibits Arhenius type of conductivity.
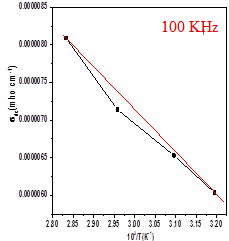
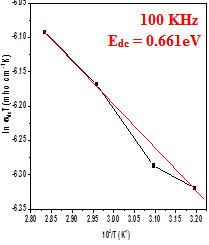
Using the conventional two probe technique the dc electrical conductivity measurements of LTZA were executed in the temperature range 313K-353K and calculated by the relation σdc = t/RA. The σdc values were fitted into the equation $$ \sigma_ {d c} = \sigma_ {o} \exp \left(- E d / K T\right) $$ The σdc values are found to increase with increaes of T for the grown sample. The conductivity is especially a defect controlled method in low temperature region. It is observed from the Figure 16, the conductivity of LTZA is low at lower temperature as a result of catching of some carriers at defect sites that is predominantly owing to moment of imperfections created by thermal activation. The value of conductivity lnσdc is found to rise with temperature and also the activation energy was noticed at 0.661 eV from the Figure 17.
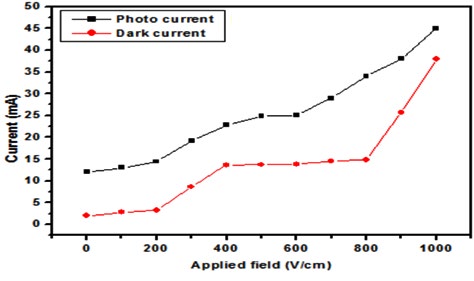
Photoconductivity Studies
Photoconductivity studies of LTZA crystals were studied using Keithley 485 picoammeter at room temperature. Figure 18 shows the variation of both photo & dark current with the applied field. In the present study, it is observed that the photo current is consistently higher than that of dark current, hence it can be concluded that LTZA exhibits positive photoconductivity.
Micro Hardness Studies
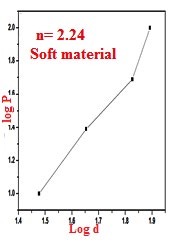
The micro hardness characterization is particularly imperative as much as the device fabrications and this study of the grown LTZA crystals was performed by Vicker’s hardness test at room temperature. For the static indentation tests, a flat and smooth face of LTZA was selected. The crystals were indented gently at loads 10g, 25g, 50g and 100g for dwell period of 10s using Vicker’s diamond pyramid. The Vicker’s hardness number HV of LTZA was calculated using the relation HV = 1.8544 P/d2. As seen from Figure 19, it is found that the maximum value of the HV is found to be 95kg/ mm3. The work hardening coefficient value (n) is calculated by plotting log p against log d is shown in Figure 20. The slope of this line gives the value of n and it is found to be 2.24. According to Onitsch [31] LTZA crystal belongs to soft material category.
![Figure 20: The slope of this line gives the value of n and it is found to be 2.24. According to Onitsch [31] LTZA crystal belongs to soft material category.](/fulltextimages/6024/fig_20.png)
Kurtz & Perry Powder SHG Technique
The second harmonic generation (SHG) efficiency was measured for the grown crystal [32]. This method is extremely valuable tool for initial screening of NLO materials. A Q-switched Nd:YAG laser beam of wavelength of 1064nm, input energy 4.4mJ/pulse was allowed to strike out the powdered samples which packed in a capillary tube. The generation of the second harmonics was confirmed by the emission of green radiation 532nm from the crystals of LTZA. The KDP crystal was for the reference materials. The results obtained by this method shows that the SHG efficiency of LTZA crystal is 1.88 times more than that of KDP. The results of the comparative efficiency are shown in Table 3.
| Crystal | Input power | Output power | Efficiency |
|---|---|---|---|
| KDP crystal | 4.4 mJ | 42mV | 1 |
| LTZA crystal | 4.4 mJ | 120 mV | 2.88 |
Table 3: Comparative Efficiency of LTZA.
Conclusion
Optically transparent LTZA single crystals were groom by slow evaporation solution growth techique. Single crystal XRD analysis uphold that the grown crystals crystallize in orthorhombic system having space group P21. The presence of several functional groups in the LTZA crystals has been confirmed by FTIR analysis. The UV-Vis-NIR spectrum of LTZA displays that the crystals are transparent in the wavelength region from 260nm to 800nm with the energy gap of 5.289eV making it a potential candidate for NLO application. SEM analysis exposes that the crystal have almost smooth surfaces. The maximum temperature up to which LTZA can be exploited for NLO application is limited to 2120C. The low dielectric loss and high dielectric constant value suggest that the grown crystal is almost free from defects. The activation energy is determined from the plots of ac & dc conductivity. Photoconductivity study ascertains the positive photo conducting nature of the crystals. The micro hardness study confirms that the LTZA crystal belongs to soft materials. The powder SHG efficiency of LTZA was found to be 2.88 times greater than that of KDP. All these studies indicate that LTZA crystal can be considered as a potential candidate for the fabrication of optoelectronic devices.
References
-
Chemla DS, Zyss J (1987) nonlinear optical properties of organic molecules and crystal, Academic Press, Orlando, New York.
-
Narasimhamurthy TS (1981) Photo-elastic and electro- optic properties of crystals, Plenum press, New York.
-
Giordmaine JA (1962) Mixing of Light Beams in Crystals. Phys Rev Lett 8(1): 19-20.
-
Ilango E, Rajasekaran R, Shankar K, Krishnan S, Chithambaram V (2014) Synthesis, growth and characterization of non linear optical Bisthiourea ammonium chloride single crystals by slow evaporation technique. Optical Materials 37: 666-670.
-
Wang WS, Aggarwal MD, Choi J, Gebre T, Shields AD, et al. (1999) Solvent effects and polymorphic transformation of organic nonlinear optical crystal L-pyroglutamic acid in solution growth processes: I. Solvent effects and growth morphology. Journal of Crystal Growth198: 578- 582.
-
Kitazawa M, Higuchi R, Takahashi M, Wada T, Sasabe H (1994) Ultraviolet generation at 266 nm in a novel organic nonlinear optical crystal: l‐pyrrolidone‐2‐ carboxylic acid. Appl Phys Lett 64: 2477.
-
Ilayabarathi P, Chandrasekaran J (2012) Spectrochimica Acta Part A: Molecular and Biomolecular Spectroscopy, Spectrochimica Acta 96: 684-689.
-
Dhanuskodi S, Vasantha K, Mary PAA (2007) Spectrochimica Acta Part A: Molecular and Biomolecular Spectroscopy 66(3): 637-642.
-
Adhikari S, Kar T (2012) Experimental and theoretical studies on physicochemical properties of l-leucine nitrate-a probable nonlinear optical material. Journal of Crystal Growth 356: 4-9
-
Chandrasekaran J, Ilayabarathi P, Maadeswaran P, Mohamed Kutty P, Pari S (2016) Growth and characterization of l-histidine cadmium chloride monohydrate a semiorganic nonlinear optical crystals. Optik - International Journal for Light and Electron Optics (OPTIK) 123: 1407-1409
-
Boopathi K, Ramasamy P (2016) Effect of l-tyrosine on the solubility, growth, structural, optical, SHG, dielectric and mechanical properties of KDP single crystals. Optical Materials 37: 629-634
-
Shanthi D, Selvarajan P, Mani Optik RJ (2014) Nucleation kinetics, growth and hardness parameters of l-alanine alaninium picrate (LAAP) single crystals. Nonlinear Optical Properties of Organic Molecules and Crystals 125: 2531-2537
-
Arthi D, Anbuselvi D, Kalaivani D, Jayaraman D, Joseph V (2014) Optical band gap analysis of chemically synthesized Copper nanoparticles. International Journal of ChemTech Research 6: 1544-1547
-
Anandan P, Saravanan T, Vasudevan S, Mohan Kumar R, Jayavel R(2010) Crystal growth and characterization of l-tyrosine bromide (LTB) nonlinear optical single crystals.Journal of Crystal Growth312: 837-841
-
Narayana Moolya SM, Dharmaprakash (2006) Synthesis, growth and characterization of nonlinear optical crystal: l-tyrosine hydrobromide. Journal of Crystal Growth 290: 960-965
-
Balakrishnan T, RameshBabu R, Ramamurthi Growth K (2008) Growth, structural, optical and thermal properties of γ-glycine crystal. Spectrochimica Acta Part A: Molecular and Biomolecular Spectroscopy 69: 1114- 1118
-
Wahida Boufas, Nathalie Dupont, Malika Berredjem, Kamel Berrezag, Imene Becheker, et al. (2014). Synthesis and antibacterial activity of sulfonamides. SAR and DFT studiesJournal of Molecular Structure 1074: 180-185
-
Baran J, Drozd H, Ratajczak H, Pietraszk A (2009) Bis(glycine) lithium nitrate – A new non-centrosymmetric crystal: X-ray structure, vibrational spectra and DSC investigations. Journal of Molecular Structure 927: 43- 53
-
Vetrivelan V, Nanosci J(2018) Physicochemical properties of bio-oil and biochar produced by fast pyrolysis of stored single-pass corn stover and cobs. Tech 4: 348-352
-
Hameed ASH, Ravi G, Dhanasekaran R, Ramasamy P (2000) Studies on organic indole-3-aldehyde single crystals. Journal of Crystal Growth 212: 227-232
-
Ramesh Kumar G, Gokul Raj S, Mohan R, Jayavel R (2006) Occurrence of ferroelectricity in epitaxial BiMnO3 thin films.Journal of Applied Physics 6: 1308-1310
-
Rao KV, Smakula A (1966) Dielectric Properties of Alkaline Earth Fluoride Single Crystals. Journal of Applied Physics 37: 319
-
Prasad PN, Prasad G, Bhimasankaran T, Suryanarayan SV, Kumar GS (1966) Optical properties of lead-bismuth cuprous glasses. Indian J Pure Appl4(5): 639
-
Anderson JC (1964) Dielectrics. Indian Journal of Science and Technology, Chapman and Hall, London.
-
Jayaprakash Manoharan AJ, Joseph John N, Revathi V, Rajendran K V (2011) Effect of amino acid doping on the dielectric properties of triglycine sulphate (TGS) crystals. Indian Journal of Science and Technology 4(6): 688-692.
-
Sethuraman K, Ramesh Babu R, Gopalakrishnan R, Ramasamy P (2008) Synthesis, Growth, and Characterization of a New Semiorganic Nonlinear Optical Crystal: l-Alanine Sodium Nitrate (LASN).Journal of Crystal Growth 8: 1863
-
Rao KV, Smakula A (1965) Dielectric Properties of Cobalt Oxide, Nickel Oxide, and Their Mixed Crystals. Journal of Applied Physics 36: 2031
-
Surekha R, Thilakavathy SR, Sagayaraj P, Ambujam P (2014) Synthesis, optical, dielectric, thermal and mechanical properties of a nonlinear optical amino acid crystal: Bis-glycine hydrobromide. Optik - International Journal for Light and Electron Optics (OPTIK) 125: 934
-
Bunget I, Popescu M (1984) Physics of solid dielectrics. Journal of Applied Physics, Elsevier, New York.
-
Balarew C, Duhlew R (1984) The Solid Solution Series of the Sulfate Apatite System Na6.45Ca3.55(SO4)6(FxCl1−x). Journal of Solid State Chemistry 55: 1.
-
Onitsch EM (1956) The Present Status of Testing the Hardness of Materials. Mikroskopie 95(15): 12-14.
-
Kurtz SK, Perry TT (1968) A Powder Technique for the Evaluation of Nonlinear Optical Materials. Journal of Applied Physics 39: 3798.
- Solution-Processed Chiral Perovskites for Biomedical Applications
- Nanotechnology in Health Chemistry and Medicine: Current Challenges and Future Directions
- Human Exposure to Micro- and Nanoplastics: Pathways, Toxicity, and Intervention Strategies
- Exosome Nanomedicine for Cancer Therapy
- Micro and Nanoplastics–Plastisphere, Biotoxicity, Impact on Human Health, and Mitigation Strategies
- Process Validation of Cefixime Powder for Suspension Dosage Form, 50 mL