Synthesis and Characterization of Cdse Quantum Dot by Solvo- Thermal Method to Determine its Photocatalytic Applications
The optical, morphological, structural, and photocatalytic properties of CdSe quantum dots are investigated in this research. The Solvo-thermal approach is used to make CdSe quantum dots, which is done at 60oC for 5 hours. The reducing agent hydrazine hydrate is used to prepare the CdSe nanoparticles. While using CdSe quantum dots as a photocatalyst, it was discovered that there were variations in the period of time needed to break down the dye. The dye degradation effect was characterized using a UV-Vis spectrophotometer. Using a Tauc plot formula, the band gap was determined to be 2.47 eV. The particle size has been determined by transmission electron microscopy to be 11.57 nm. The SAED pattern analysis supports the CdSe quantum dots crystalline structure. Using the Debye-Scherr formula, the XRD technique determines the crystallite size as 8.06 nm.
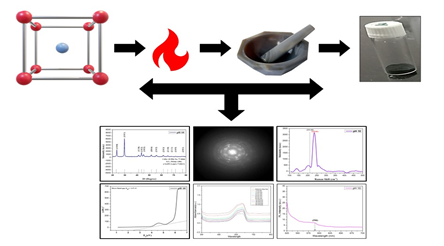
Graphical Abstract
Abbreviations
CdSe: Cadmium Selenide; QDs: Quantum Dots; ROS: Reactive Oxygen Species; SAED: Selected Area Electron Diffraction; LO: Longitudinal Optical; FTIR: Fourier Transform Infrared Spectroscopy.
Introduction
The main goals of current nanoscale research are the creation of superior nanocrystals and the potential for exploiting their dimensional variants in real-world applications Kilina S, et al. [1]. Inorganic semiconducting materials are receiving more and more attention due to their special use in applications based on the optical, optoelectronic, and piezoelectric characteristics. Cadmium selenide (CdSe) is a notable group II-VI direct bandgap semiconductor Mohammed KA, et al. [2]. Wurtzite (hexagonal) and zinc blende (cubic) are the two major crystal phases of CdSe with bandgaps of 1.79 and 1.71 eV each Srivastava P, et al. [3]. Due to its size and shape-dependent properties, CdSe is a promising compound for a number of applications, including photocatalysis, photodetection, light-emitting diodes, catalysis, and memory devices Davoodi M, et al. [4]. The features of CdSe nanoparticles and how they are influenced by their size, shape, and crystal structure are discussed in this paper Morgan DP, et al. [5, 6]. Vacuum evaporation, spray pyrolysis, chemical bath deposition, and solvothermal approach were some of the synthetic techniques used by researchers to make the CdSe nanoparticles [7].
The remarkable optical and physical properties of semiconductor nanocrystals, also known as quantum dots (QDs), have attracted a lot of attention in the last ten years Fan XB, et al. [8]. Although using QDs as highly luminescent nanoscale markers in biological applications would be ideal, cytotoxicity is a key obstacle that limits the range of potential applications Mirnajafizadeh F, et al. [9]. Nanoscale particles may be more dangerous than their bulk equivalents because of their small size, which allows for more cell penetration than similar bulk chemical substances Wagner AM, et al. [10]. Furthermore, when cells are exposed to nanomaterials, one of the primary causes of nanoparticle cytotoxicity is the generation of free radicals, such as reactive oxygen species (ROS) Kapatkar PS, et al. [11]. CdSe QDs were reported to have low toxicity, displaying a highly dose-dependent response, with a decrease in cell viability at higher pH values. The cytotoxicity of QDs is influenced by a number of parameters, including surface modifications, cell type, shape, development, and interactions with cell membranes Salem A, et al. [12]. With various important advantages, such as tunable particle size, low temperature, cost-effectiveness, and easier processes, solvothermal procedures have emerged as a powerful fabrication tool for the synthesis of nanomaterials Gao Y, et al. [11, 12, 13]. Semiconductor nanocrystals are of great interest due to their quantum confinement effect Gao Y, et al. [13, 14]. Colloidal nanoparticles based on CdSe have better photostability than conventional dyes, narrow emission that reduces signal cross-coupling, and the ability to excite many colours from a single source, allowing for multiplex detection Mukhina MV, et al. [15, 16]. A variety of methods, including some that depend on the very poisonous Cd and Se components, can be used to create CdSe QDs Santos CIDL, et al. [17]. Recently, the solvothermal method has been used to produce inexpensive, biocompatible, low-toxic CdSe nanoparticles Azpiroz JM, et al. [18, 19]. The pH 10 CdSe sample will be synthesized by the addition of hydrazine hydrate as the given ratio to find the crystallite size for dye- degradation applications [19].
Experimental Details
Materials
The current study used raw materials such as 1 mol Cadmium chloride monohydrate (99.99%), 1 mol Selenium non-metal (99.99%), and solvents such as distilled water 100 ml, ethylene glycol 42 ml, hydrazine hydrate 14 ml, and ethanol to wash the precipitate. Chemicals are purchased from CDH Laboratories in New Delhi, India, and Oxford Laboratory Reagent in Mumbai, India; these chemicals do not need to be further purified because they are being used with standard-grade reagents [18].
Methodology
Selenium non-metal powder and monohydrate CdCl2 powder are used to create CdSe nanoparticles. In this synthesis procedure, a 200 ml capacity conical flask was filled with 100 ml deionized water, 42 ml ethylene glycol, and 14 ml hydrazine hydrate in the volume ratios of 7:3:1 and CdCl2 (4.0 g, 1M) and elemental selenium (2.0 g, 1M). The solution was then refluxed at 70°C for 6 hours while being vigorously stirred. The black precipitate was collected, washed three times in hot distilled water and anhydrous ethanol, and then dried in a hot air oven at 60°C for five hours. The precipitate is dried, forming a powder that is then further grinded for 12-14 hours in a pestle and mortar.
Characterization
The Bruker D8 Advance rotating powder system with 1D PSD (Brucket Lynx Eye) anode diffractometer (running at 2.2 KW, 100 mA) and Cu-K radiation (wavelength 1.54) was used to record the X-ray diffraction pattern of dried, as-synthesized CdSe powder. The CdSe powder was mounted in a Linkam THMS600 stage, 4K with liquid He, and specifications of 473 nm excitation wavelength, 1800
grating, 50X lens, and a 2.5 MW (10%) SER (Specific Energy Requirement) power were used to measure the Raman spectra. Quanta chrome Autosorb 1C BET Analyzer Pore size in nm and surface area are measured using a surface area analyzer. The material was milled in KBr and the Fourier transform infrared spectroscopy (FTIR) examination was performed using a Vertex-70 UPD FTIR spectrometer at room temperature. The UV-Vis 2600i Spectrophotometer (Shimadzu, Japan) was used to record UV-Visible spectra in the visible range between 200 and 800 nm with a spectral bandwidth of 1 nm absorption. Experiments were conducted at room temperature. The F-700 Hitachi model, which produces luminescence spectra with a scan speed of 1200 nm/min, is used to record photoluminescence spectroscopy data above the emission wavelength of 465 nm. The FEG used transmission electron microscopy-selected area electron diffraction analysis with a 200 kV operating voltage and a 0.14 nm TEM line resolution to examine the sample’s particle size, which takes two hours to load into the TEM.
Results and Discussion
Mechanism of CdSe Nanoparticle Synthesis
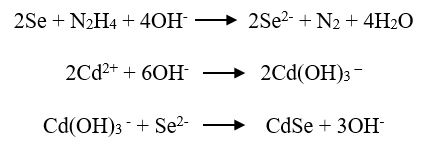
Cadmium chloride monohydrate and selenium non- metal are added as precursors in a 2:1 ratio to create CdSe nanoparticles, according to the mechanism Brahim NB, et al. [20]. A significant monomer concentration is produced as a result of the simple conversion of the Se source into Se2- by N2H4 Surana K, et al. [21]. The transparent soluble complexes solution is created when hydrazine hydrate (N2H4.H2O) complexes with Cd2+ in the first step, substantially lowering the concentration of Cd2+ and preventing the precipitation of CdSeO3 and creating a more homogeneous CdSe solution [22, 23].
The coordinating and reducing agent hydrazine hydrate was utilized to decrease and determine the extraction of CdSe nanoparticles from precursors Caram JR, et al. [24, 25]. Therefore, it is possible to decide whether to use N2H4 as a coordinating agent for this stage of the products Choi Y, et al. [26]. Thus, it can be drawn that the complexing ability of groups containing atom N (such as NH2 or NH3) can effectively determine the final phase of the products [27, 28].
Structural Properties
XRD Structural Analysis:
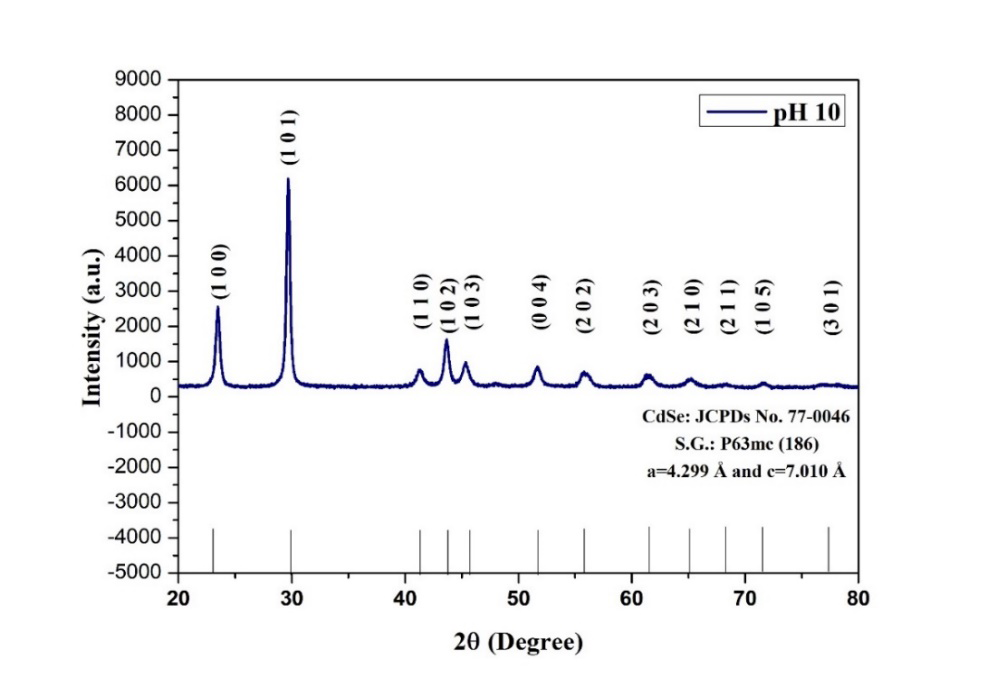
The X-ray diffraction pattern determines the structure of the crystalline materials. The x-axis is ranged between 20o – 80o and the y-axis is marked as intensity (a.u.). According to the XRD data crystalline nature of the CdSe quantum dots is confirmed by comparing the JCPS card No.77-0046, S.G.: p63mc (186), a = 4.299 Å and c =7.010 Å, and Wurtzite shape of the CdSe is confirmed. The peaks were identified as sharp as well as narrow showing their nano-form. The diffraction peaks were marked at 2θo x-axis as shown in Figure 1. 23.49, 29.70, 41.42, 43.56, 45.30, 51.57, 55.88, 61.53, 65.10, 68.37, 71.65, 77.29 that are marked with diffraction planes of (100), (101), (110), (102), (103), (004), (202), (203), (210), (211), (105), (301) of the CdSe quantum dots after matching with JCPDS card No. 77-0046 Tohgha U, et al. [29]. The reducing agent is added to convert the selenium into selenium ions to avoid impurities and to form pure CdSe quantum dots.
The nano-crystallite size is determined by the Debye- Scherrer formula:
cos k L λ β θ =
where, β is the full-width half maxima of the diffraction peak, L is the crystal length (in nm), λ is the x-ray wavelength (1.54 Å or 0.154 nm), and θ is the diffraction angle Mahmoud WE, et al. [30]. The pH 10 crystallite size calculated from different FWHM angles is 8.06 nm.
Selected Area Electron Diffraction (SAED):
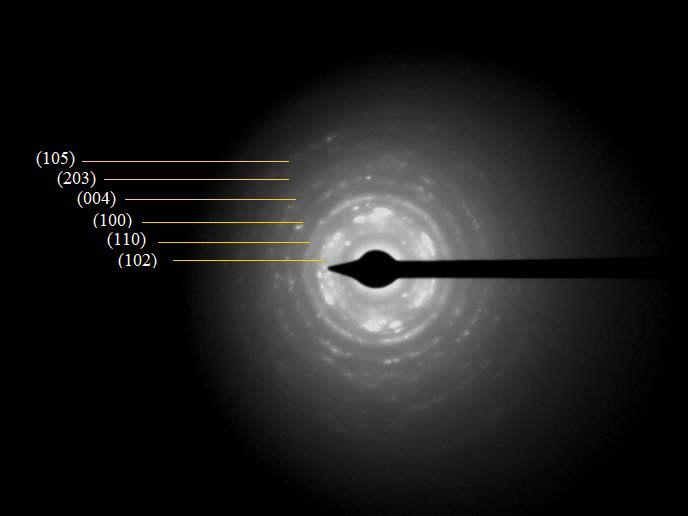
The SAED pattern of the CdSe quantum dots represents the poly-crystalline nature of the CdSe quantum dots as shown in Figure 3 due to the formation of the dashed ring-like structure by considering the lattice planes in reverse space. Towards the center, the formed rings are in the concentric order sample crystallinity is determined along with lattice parameters with the help of interacting electron bean with sample atoms as specified in Table 1.
| S.N. | 1/2r(1/ nm) | 1/r(1/ nm) | r(nm) | d-spacing (Å) | (hkl) |
|---|---|---|---|---|---|
| 1 | 5.74 | 2.87 | 0.35 | 3.48 | 102 |
| 2 | 7.45 | 3.73 | 0.27 | 2.69 | 110 |
| 3 | 9.19 | 4.6 | 0.22 | 2.18 | 100 |
| 4 | 10.82 | 5.41 | 0.19 | 1.84 | 004 |
| 5 | 12.78 | 6.39 | 0.16 | 1.57 | 203 |
| 6 | 14.57 | 7.29 | 0.14 | 1.37 | 105 |
Table 1: SAED Pattern D Spacing and Hkl Crystal Lattice Representing Poly-Crystalline Nature.
Brunauer, Emmett and Teller (BET) Analysis: The solid particle adsorption and defined powder sample are the foundation of the BET analysis. The solid phase of the powder sample is analyzed using nitrogen gas. The circular dashed features in the pattern serve to indicate whether it is crystalline or amorphous. The pure CdSe sample was found to have a pH of 10, and Table 2 data shows that the particle size and pore size measurements are 198.56 m2g-1 and 19.2 nm, respectively.
| Samples (CdSe) | BET surface area (m2 g−1) | Pore volume (m3 g−1) | Pore size (nm) |
|---|---|---|---|
| pH- 10 | 198.56 | 0.41 | 19.2 |
Table 2: BET Analysis Table with a Pore Size (nm).
Optical Properties
FTIR-Based Phase Composition Analysis
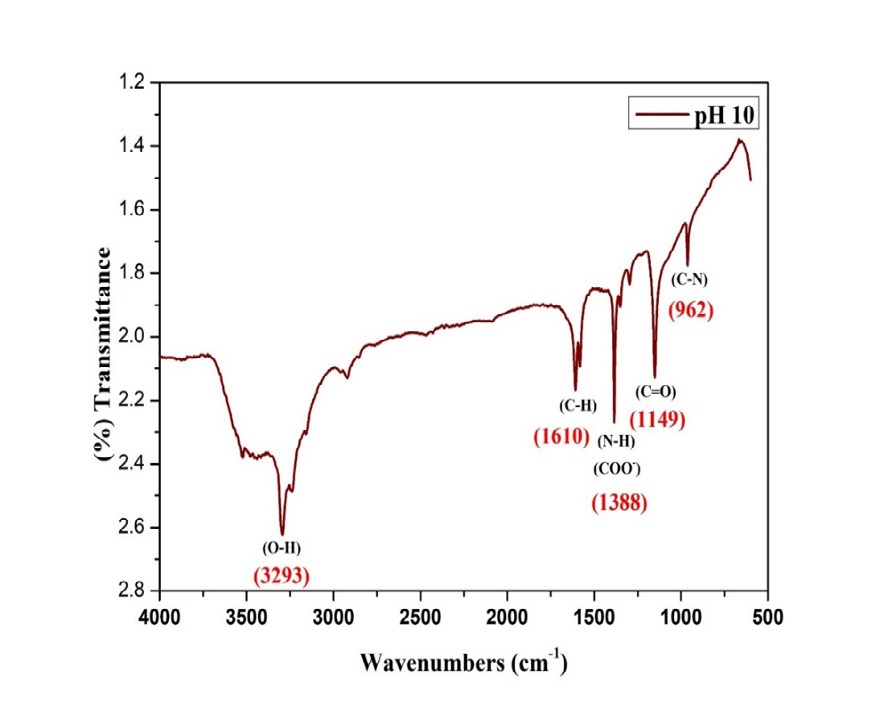
The chemical composition and unknown chemical compounds of CdSe quantum dots are identified using the Fourier Transform Infrared Spectroscopy. The prepared CdSe powder is coated over the pressed KBr pellet which is used as the reference due to the 100% transmittance. The bands are observed at 3293 cm-1, 1610 cm-1, 1388 cm-1, 1149 cm-1 as shown in Figure 4. The 3293 cm-1 is connected with O-H bending vibration, which is caused by the presence of H2O in the sample. Considering that the sample contains ethylene glycol, the 1610 cm-1 is connected to the stretching of vibrational bands. The presence of hydrazine hydrate in the sample is what causes the bands seen at 1388 cm-1. At 1149 cm-1, the CO bond stretching band is visible. The combination of hydrazine hydrate and ethylene glycol results in the C-N band stretching being seen at 962 cm-1.
Raman Spectroscopy:
UV-Visible Spectroscopy Analysis:
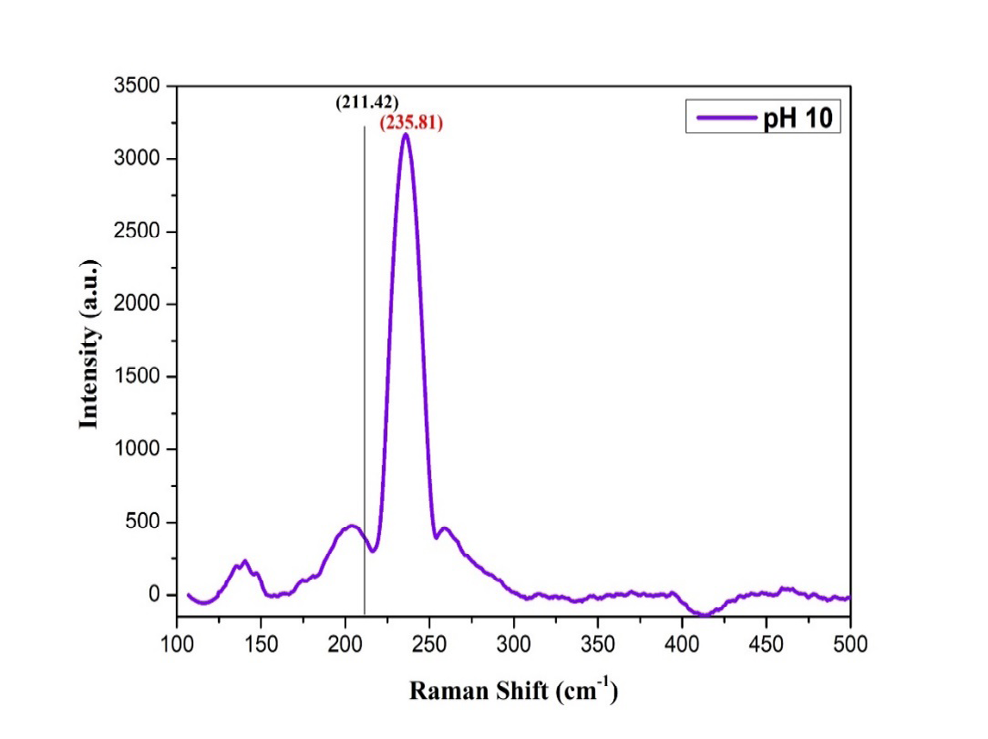
Raman spectroscopy characterization techniques are used to identify vibrational modes and chemical structure of CdSe nano-powder samples. To measure the Raman spectroscopy, the CdSe sample is taken in small amounts which are kept at room temperature, which is blackish in colour, by exiting the Ar+ laser at an excitation wavelength of 473 nm at 2.5 eV. The laser is passed in the 1µm range of circular spots with 1000 holes, 100 slits, and 1800 grating. The power is reduced to 10% of the maximum power to avoid damage to the sample by laser light. The Raman shift is calculated between intensity at Y-axis and Raman shift at X-axis. The CdSe nano-powder spectrum is observed by scattering of laser light into the sample and observation of longitudinal optical (LO) phonon at 235.81 cm-1 as shown in Figure 5. The phonon confinement is seen by the blue shift of particles due to the shifting of the peak away from the bulk CdSe which is observed at 211.42 cm-1 due to the excitation λ=473 nm.
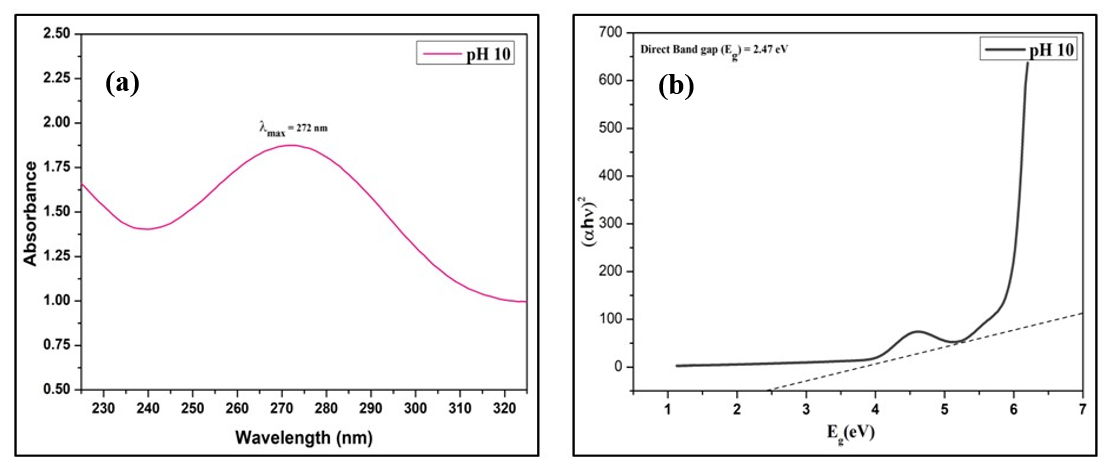
Figure 6a: Absorption Spectra of the CdSe Sample at Room Temperature & 6b: Variation of (αhυ)2 Versus Eg for the Direct Band Gap Calculation of the CdSe Sample.
The optical and electrical property of the CdSe nanoparticles is observed by the UV-Vis spectroscopy measurement between 200-800 nm. The Figure 5 represents the rise of a peak wavelength between a range of 230 nm to 320 nm. The band gap is calculated from the UV-Visible spectroscopy data Deshpande MP, et al. [31]. It is the absorption spectrum of the CdSe nanoparticles without any loss of transmission and reflection of light Amiri GR, et al. [32]. The absorption of the light is used to calculate the optical band of CdSe nanoparticles using the Tauc plot equation: ( )
2 n k hv Eg a hv
− = where, Eg = optical band gap, n = 1 for direct band gap. The graph is plotted between ( ) 2 hv α versus Eg for pH 10. The direct band gap observed is 2.47 eV for pH 10 as visible in fig. from standard bulk CdSe particles band gap of 1.79 eV at 692 nm represents the blue shift phenomenon of 0.68 eV and decrease in nanocrystals of CdSe particles as shown in Figure 6. The maximum wavelength is recorded at 272 nm.
Photoluminescence Spectroscopy Analysis:
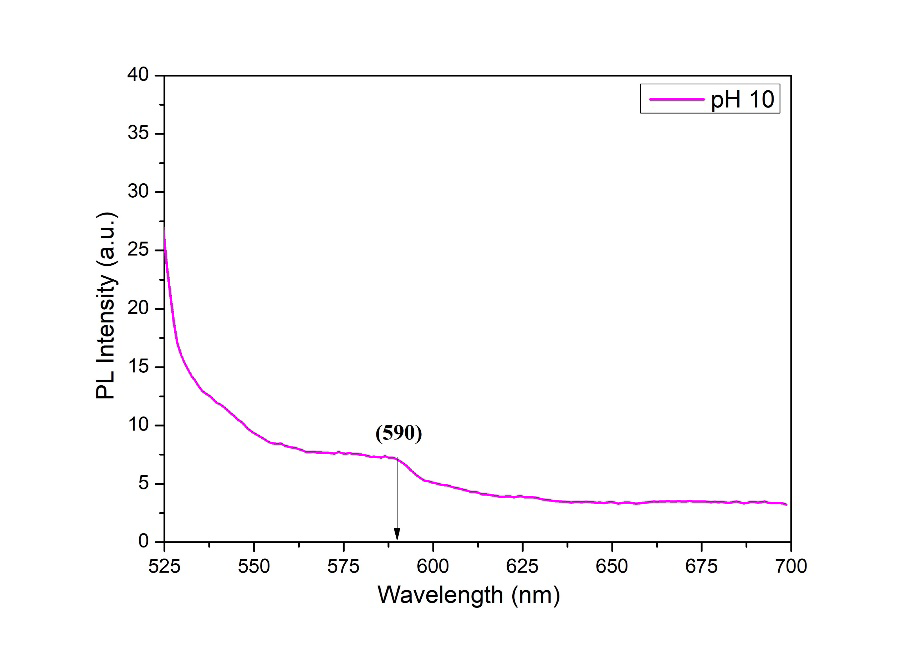
The photoluminescence for the synthesized pure CdSe nanoparticles at pH 10 was evaluated using an F-700 Hitachi fluorescence spectrophotometer which gives luminescence emission from the synthesized nanoparticles and the peak is wider Mahmoud WE, et al. [33]. The xenon light source is used with an excitation wavelength of 465 nm. The
Morphological Properties
TEM Analysis:
absorption of this light shows strong emission at nearly 590 nm in comparison to bulk CdSe at 715 nm as shown in Figure 7 Elward JM, et al. [34]. The luminescence is compared with bulk CdSe nanoparticles which were reported at 715 nm representing the blue shift phenomenon and a decrease in the crystallite size.
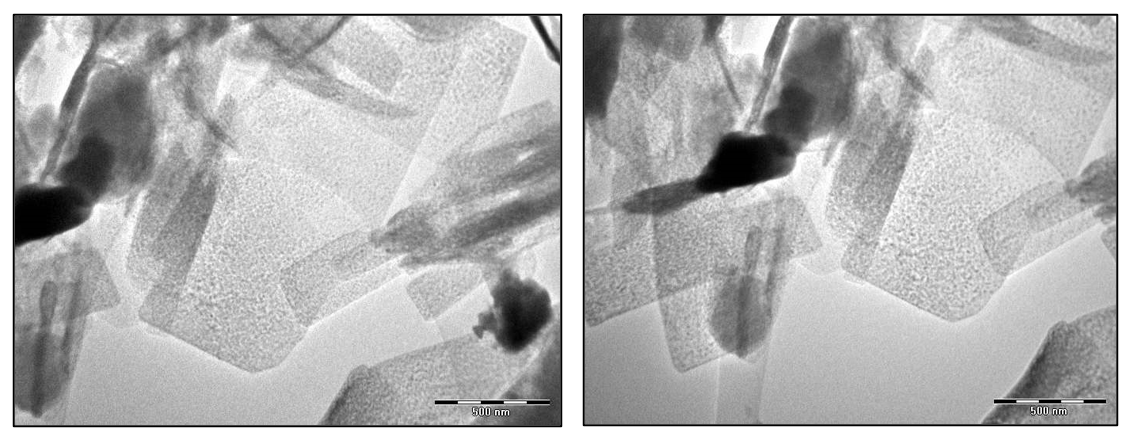
The TEM microscopy image of the CdSe quantum is captured at 500 nm size with the varied resolution to find the size of the particle. The shape of the CdSe sample observed at 500 nm and 200 nm is a dotted structure that is non-uniform and highly agglomerated as shown in Figure 8. The particle size for the pure CdSe nanoparticles calculated is 11.57 nm for 313 counts as seen in Table 3.
| Slice | Count | Particle Size (nm) | % Area |
|---|---|---|---|
| pH 10 | 313 | 11.57 | 23.108 |
Table 3: Table Represents Particle Size in nm, Particle Count, and % Area.
Photocatalytic Properties
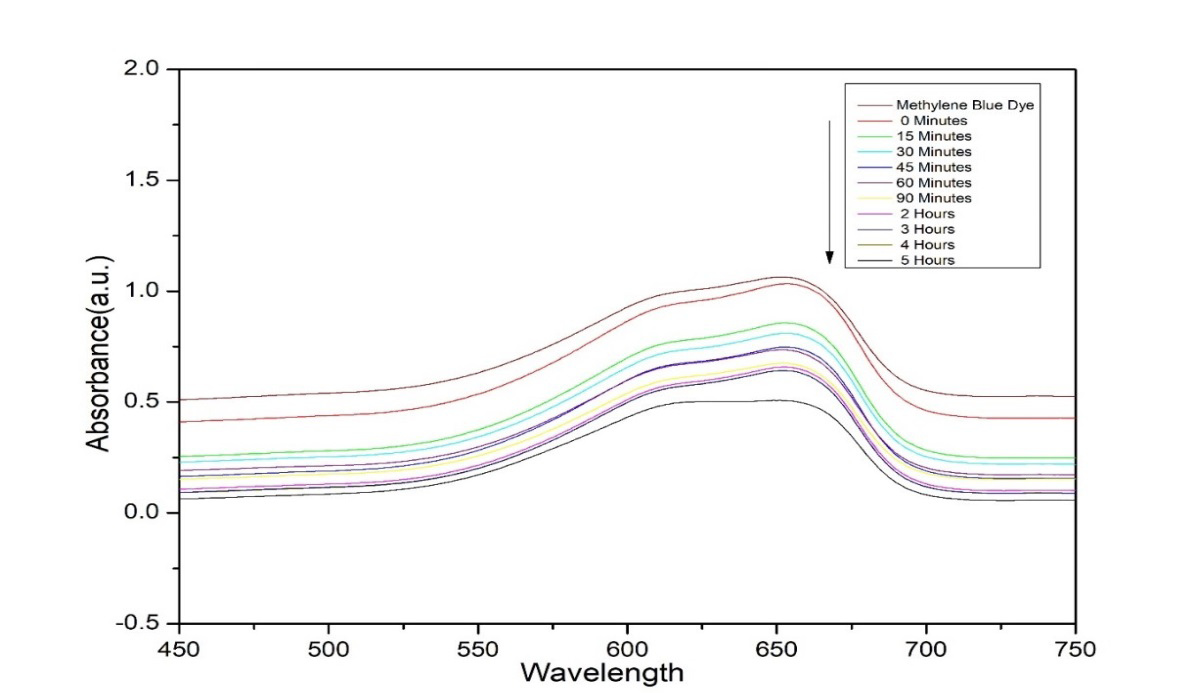
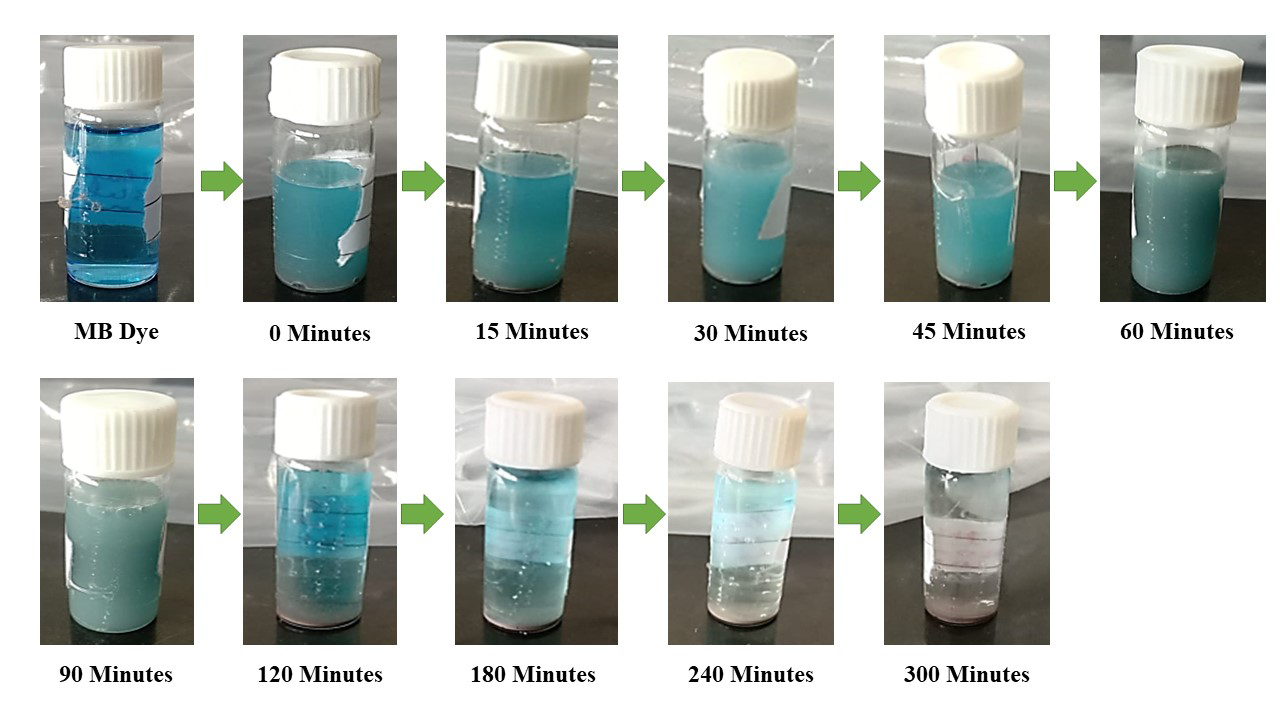
UV-Visible Spectroscopy Photocatalysis: The photocatalytic activity is identified for the CdSe quantum dots by the usage of Methylene blue dye in distilled water Elward JM, et al. [34]. The strong absorption peak was exhibited at 652 nm, this is used to evaluate the methylene blue contents in the solution Gao B, et al. [35]. The photocatalytic activity of the CdSe sample was evaluated by the addition of a 0.5 gm sample in the 150 ml of distilled water having added 0.25 ml Methylene blue dye Wang G, et al. [36]. Exposure to standard (Methylene Blue dye), dark condition (0 minutes), and UV light (15 minutes to 5 hours) was observed and a certain interval of time was shown in Figure 9 to measure the dye degradation [37].
Absorption spectra of the solution were taken out after a different duration of UV-light exposure with a CdSe sample Wang T, et al. [38]. It is evident from the data that dye degradation starts after 90 minutes and complete degradation is achieved after 5 hours [46].
Organic Dye (Methylene Blue) Photodegradation: Degradation of organic dye (methylene blue (MB)) 0.25 ml by synthesized CdSe powder in pH variation (from 5 to 10) to design the experimental setup to identify the photocatalytic activity of CdSe powder with varying pH Hyeon-Deuk K, et al. [39]. The experimental setup consists of a hot plate magnetic stirrer, a 500 ml beaker, and a black box fitted with UV light Morelli E, et al. [40]. The concentration of the dye is maintained at 0.25 ml at 150 ml of distilled water. The dye solution is stirred continuously during the adsorption test in dark and UV light (<420 nm) Mahmoud WE, et al. [41]. The intensity of the pure methylene blue solution is also characterized by UV-Vis spectrophotometry Kashyout AB, et al. [42]. The intensity of absorption of UV-Visible light by the dye solution was measured using a UV-Visible spectrophotometer Chu VH, et al. [43]. After the irradiation of UV (<420 nm) the intensity of the observed peak at 650 nm of methylene blue was to calculate the amount of dye present in the solution as represented in Figure 10 [44, 45].
kt t 0 A e A − =
A %Degradation 1 100 A = − ×
t
0 Where Ao and At are concentrations of the dye in the solution before and after exposure for a time duration t and k are the degradation rate constant. Ao and At are directly proportional to the intensity of absorption peak at 650 nm [47].
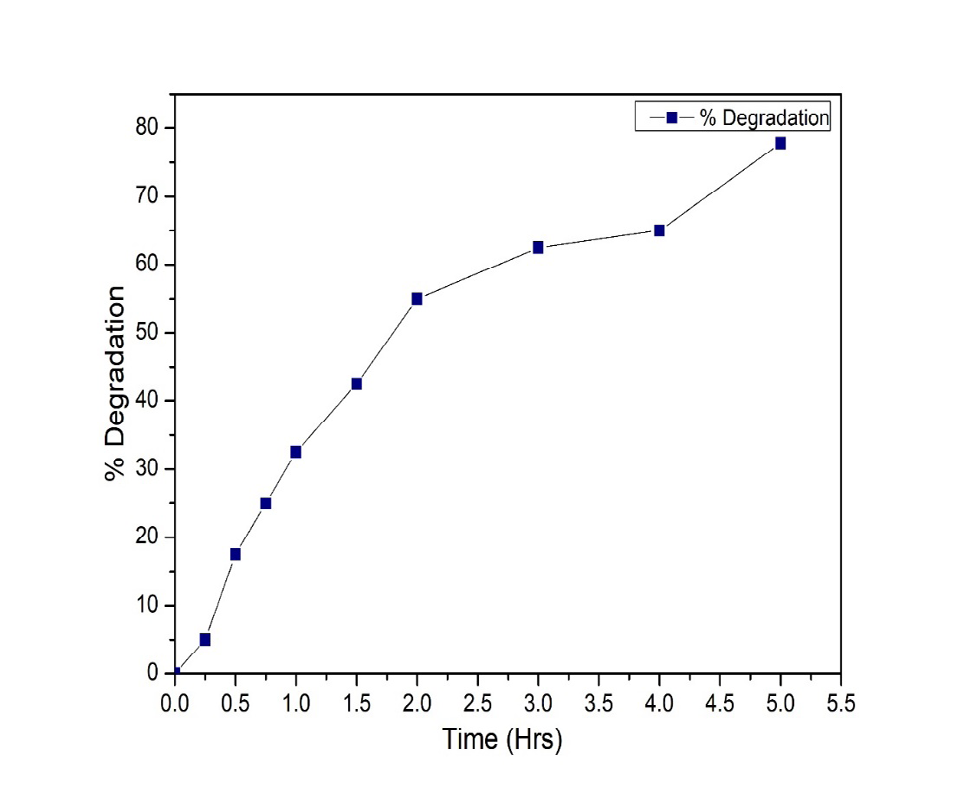
It is evident from our results shown in Figure 8 that almost 55% of dye degradation takes place in the first 2 hours however complete degradation is achieved after 3, 4, and 5 hours of exposure as seen in Figure 11 Tripathi GK, et al. [48]. The maximum degradation of MB Dye achieved is 77.82%.
Conclusion
CdSe quantum dots are fabricated using Solvo-Thermal processes to verify optical, morphological, and structural properties. The solvothermal method used is the easiest way to produce CdSe nanoparticles in the laboratory with fewer chemicals, low toxicity, and higher water solubility. The crystal size of CdSe nanoparticles is calculated as 8.06 nm in size. The crystalline nature of CdSe quantum dots is confirmed by SAED using the circular discontinuous space structure. The BET analyzer showed a pore size of 19.2 nm. Raman spectroscopy analysis shifts the peak beyond the bulk CdSe at 235 cm-1. Ethylene glycol is used in the preparation of CdSe to dissolve Se in the solution mixture and hydrazine hydrate is used as a reducing agent and stabilizer to form CdSe nanoparticles together. The FTIR data reveals chemical composition, stretching, and bending vibration at 3293 cm-1, 1610 cm-1, 1388 cm-1,1149 cm-1, and 962 cm-1. The UV-Spectroscopy reveals the direct band gap of the CdSe quantum dots at 2.47 eV using Tauc Plot analysis. Using the PL technique, a strong emission is observed at 590 nm, which is below 715 nm, representing the blue shift phenomenon which confirms that the material has fluorescent properties. The TEM image shows the agglomerated particles and the calculated particle size is 11.57 nm. The photocatalytic property of CdSe powder using MB Dye showed degradation of 77.82 % in 5 hours of UV light reaction under a black box.
Funding
This research received no external funding.
Acknowledgement
School of Nanotechnology, UTD-RGPV; UGC-DAE Consortium, Indore are acknowledged for providing necessary institutional facilities and encouragement.
Conflicts of Interest
All the authors declare no conflict of interest.
Compliance with Ethical Standards
All authors (Ambikesh Soni*, Shivanshu Shukla, Gagan Kant Tripathi, Priyavand Bundela, Pradeep Kumar Khiriya, and Purnima Swarup Khare) confirm this article does not contain any studies with human or animal subjects.
Competing Interests
The authors have no relevant financial or non-financial interests to disclose.
Research Data Policy and Data Availability Statements
The authors have not used any third-party data or sources used in this manuscript.
Statements and Declaration
The authors declare that no funds, grants, or other support were received during the preparation of this manuscript.
Author Contributions
All authors (Ambikesh Soni*, Shivanshu Shukla, Gagan Kant Tripathi, Priyavand Bundela, Pradeep Kumar Khiriya, and Purnima Swarup Khare) contributed to the study’s conception and design. Material preparation, data collection, and analysis were performed by Ambikesh Soni. The first draft of the manuscript was written by Ambikesh Soni and SS, GKT, PB, PK and PSK commented on previous versions of the manuscript. All authors (AS, SS, GKT, PB, PK and PSK) read and approved the final manuscript.
References
-
Kilina S, Velizhanin KA, Ivanov S, Prezhdo OV, Tretiak S, et al. (2012) Surface ligands increase photoexcitation relaxation rates in Cdse quantum dots. ACS Nano 6(7): 6515-6524.
-
Mohammed KA, AL-Kabbi AS, Zidan KM (2019) Synthesis and characterization of CdSe nanoparticles. AIP Conf Proc 2144(1): 1-9.
-
Srivastava P, Singh K (2012) Synthesis of CdSe nanoparticles by solvothermal route: Structural, optical and spectroscopic properties. Adv Mater Lett 3(4): 340- 344.
-
Davoodi M, Davar F, Mandani S, Rezaei, B, Shalan AE (2021) CdSe Quantum Dot Nanoparticles: Synthesis and Application in the Development of Molecularly Imprinted Polymer-Based Dual Optical Sensors. Ind Eng Chem Res 60(33): 12328-12342.
-
Morgan DP, Kelley DF (2020) What Does the Transient Absorption Spectrum of CdSe Quantum Dots Measure?. J Phys Chem C 124(15): 8448-8455.
-
Sadeghi S, Abkenar SR, Ow-Yang CW, Nizamoglu S (2019) Efficient White LEDs Using Liquid-state Magic-sized CdSe Quantum Dots. Sci Rep 9: 1-9.
-
Liu Z, Chang C, Zhang W, Yang M, Zhang Q (2019) Research on Ligand Properties of CdSe Quantum Dots. IOP Conf Ser Mater Sci Eng 562: 012067.
-
Fan XB, Yu S, Wang X, Li ZJ, Zhan F, et al. (2019) Susceptible Surface Sulfide Regulates Catalytic Activity of CdSe Quantum Dots for Hydrogen Photogeneration. Adv Mater 31(7): 1-7.
-
Mirnajafizadeh F, Ramsey D, McAlpine S, Wang F, Stride JA (2019) Nanoparticles for bio applications: Study of the cytotoxicity of water dispersible CdSe(S) and CdSe(S)/ ZnO quantum dots. Nanomaterials 9(3): 18-21.
-
Wagner AM, Knipe JM, Orive G, Peppas NA (2019) Quantum dots in biomedical applications. Acta Biomater 94: 44-63.
-
Kapatkar PS, Shettar RB, Kapatkar SB, Patil NR (2018) Synthesis, Structural and Optical Investigation of CdSe semiconductor Quantum Dots. IOP Conf Ser Mater Sci Eng 360: 012009.
-
Salem A, Saion E, Al-Hada NM, Kamari HM, Shaari AH, et al. (2017) Synthesis and characterization of CdSe nanoparticles via thermal treatment technique. Results in physics 7: 1556-1562.
-
Gao Y, Yin PG (2017) Synthesis of cubic CdSe nanocrystals and their spectral properties. Nanomaterial Nanotechnology 7: 1-6.
-
Raut VS, Lokhande CD, Killedar VV (2017) Studies on effect of pH on structural, optical and morphological properties of chemisynthesized CdSe grains. Int J Eng Res Technol 10(1): 568-572.
-
Mukhina MV, Korsakov IV, Maslov VG, Purcell-Milton F, Govan J, et al. (2016) Molecular recognition of biomolecules by chiral CdSe quantum dots. Scientific reports 6: 24177.
-
Bloom BP, Kiran V, Varade V, Naaman R, Waldeck DH (2016) Spin selective charge transport through cysteine capped CdSe quantum dots. Nano Lett 16(7): 4583-4589.
-
Santos CIDL, Carvalho MS, Raphael E, Dantas C, Ferrari JL, et al. (2016) Synthesis, optical characterization, and size distribution determination by curve resolution methods of water-soluble CdSe quantum dots. Materials Research 19(6): 1407-1416.
-
Azpiroz JM, De Angelis F (2015) Ligand Induced Spectral Changes in CdSe Quantum Dots. ACS Appl Mater Interfaces 7(35):19736-19745.
-
Rabouw FT, Kamp M, Dijk-Moes RJAV, Gamelin DR, Koenderink AF, et al. (2015) Delayed exciton emission and its relation to blinking in CdSe quantum dots. Nano letters 15(11): 7718-7725.
-
Brahim NB, Mohamed NBH, Echabaane M, Haouari M, Chaâbane RB, et al. (2015) Thioglycerol-functionalized CdSe quantum dots detecting cadmium ions. Sensors and Actuators B: Chemical 220: 1346-1353.
-
Surana K, Singh PK, Rhee HW, Bhattacharya B (2014) Synthesis, characterization and application of CdSe quantum dots. J Ind Eng Chem 20(6): 4188-4193.
-
Kauffer FA, Merlin C, Balan L, Schneider R (2014) Incidence of the core composition on the stability, the ROS production and the toxicity of CdSe quantum dots. J Hazard Mater 268: 246-255.
-
Malik P, Singh J, Kakkar R (2014) A review on CdSe quantum dots in sensing. Adv Mater Lett 5(11): 612-628.
-
Caram JR, Zheng H, Dahlberg PD, Rolczynski BS, Griffin GB, et al. (2014) Persistent interexcitonic quantum coherence in CdSe quantum dots. The journal of physical chemistry letters 5(1): 196-204.
-
Abdellah M, Karki KJ, Lenngren N, Zheng K, Pascher T, et al. (2014) Ultra long-lived radiative trap states in CdSe quantum dots. The Journal of Physical Chemistry C 118: 21682-21686.
-
Choi Y, Seol M, Kim W, Yong K (2014) Chemical bath deposition of stoichiometric CdSe quantum dots for an efficient quantum-dot-sensitized solar cell application. J Phys Chem C 118: 5664–5670.
-
Caram JR, Zheng H, Dahlberg PD, Rolczynski BS, Griffin GB, et al. (2014) Exploring size and state dynamics in CdSe quantum dots using two-dimensional electronic spectroscopy. The Journal of chemical physics 140(8): 084701.
-
Diroll BT, Murray CB (2014) High-temperature photoluminescence of CdSe/CdS core/shell nanoheterostructures. ACS Nano 8(6): 6466-6474.
-
Tohgha U, Deol KK, Porter AG, Bartko SG, Choi JK, et al. (2013) Ligand induced circular dichroism and circularly polarized luminescence in CdSe quantum dots. ACS nano 7(12):11094-11102.
-
Mahmoud WE, Yaghmour SJ, Al-Amri AM (2013) Enhancement of CdSe quantum dots luminescence by calcium ions. J Lumin 134: 429–431.
-
Deshpande MP, Garg N, Bhatt SV, Soni B, Chaki SH (2013) Study on CdSe nanoparticles synthesized by chemical method. Adv Mater Res 665: 267-282.
-
Amiri GR, Fatahian S, Mahmoudi S (2013) Preparation and Optical Properties Assessment of CdSe Quantum Dots. Mater Sci Appl 4(2): 134-137.
-
Mahmoud WE, Yaghmour SJ (2013) Synthesis, characterization and luminescence properties of thiol- capped CdSe quantum dots at different processing conditions. Opt Mater 35(3): 652-656.
-
Elward JM, Chakraborty A (2013) Effect of dot size on exciton binding energy and electron-hole recombination probability in CdSe quantum dots. J Chem Theory Comput 9: 4351-4359.
-
Gao B, Shen, C, Yuan S, Yang Y, Chen G (2013) Synthesis of highly emissive CdSe quantum dots by aqueous precipitation method. J Nanometre 2013: 4-11.
-
Wang GX, Park MS, Liu HK, Wexler D, Chen J (2013) Synthesis and characterization of one-dimensional CdSe nanostructures. Appl Phys Lett 88.
-
Tian, Jianjun, Rui Gao, Qifeng Zhang Shengen Zhang, et al. (2012) Enhanced performance of CdS/CdSe quantum dot cosensitized solar cells via homogeneous distribution of quantum dots in TiO2 film. The Journal of Physical Chemistry C 116(35): 18655-18662.
-
Wang T, Zhang S, Mao C, Song J, Niu H, et al. (2012) Enhanced electrochemiluminescence of CdSe quantum dots composited with graphene oxide and chitosan for sensitive sensor. Biosensors and Bioelectronics31(1): 369-375.
-
Hyeon-Deuk K, Prezhdo OV (2012) Multiple exciton generations and recombination dynamics in small Si and CdSe quantum dots: An ab initio time-domain study. ACS Nano 6(2): 1239-1250.
-
Morelli E, Cioni P, Posarelli M, Gabellieri E (2012) Chemical stability of CdSe quantum dots in seawater and their effects on a marine microalga. Aquat Toxicol 122- 123: 153-162.
-
Mahmoud WE (2012) Functionalized ME-capped CdSe quantum dots based luminescence probe for detection of Ba 2+ ions, Sensors Actuators. B Chem 164(1): 76-81.
-
Kashyout AB, Soliman, HMA, Fathy M, Gomaa EA, Zidan AA (2012) CdSe quantum dots for solar cell devices. Int J Photoenergy.
-
Chu VH, Nghiem LTH, Le TH, Vu DL, Tran HN, et al. (2012) Synthesis and optical properties of water soluble CdSe/ CdS quantum dots for biological applications. Adv Nat Sci Nanosci Nanotechnol (3).
-
Hines, Douglas A, Becker, Matthew A, Kamat, Prashant V (2012) Photoinduced surface oxidation and its effect on the exciton dynamics of CdSe quantum dots. J Phys Chem pp: 13452-13457.
-
Dzhagan VM, Lokteva I, Himcinschi C, Kolny-Olesiak J, Valakh MY, et al. (2011) The influence of pyridine ligand onto the structure and phonon spectra of CdSe nanocrystals. Journal of Applied Physics 109.
-
Tripathi GK, Sharma ID, Kant C, Pandey RR, Saini KK (2016) Characterization of the Photocatalytic Activity of Bismuth Oxychloride Nanostructures. Anal Lett 49: 1452-1466.
-
Tripathi GK (2015) Synthesis of visible light active biocl photocatalyst for energy and environmental applications. Int J Environ Eng Manag 3: 167-170.
-
Tripathi GK, Kurchania R (2017) Photocatalytic behavior of BiOX (X=Cl/Br, Cl/I and Br/I) composites/ heterogeneous nanostructures with organic dye. Opt Quantum Electron 49: 6.
- Solution-Processed Chiral Perovskites for Biomedical Applications
- Nanotechnology in Health Chemistry and Medicine: Current Challenges and Future Directions
- Human Exposure to Micro- and Nanoplastics: Pathways, Toxicity, and Intervention Strategies
- Exosome Nanomedicine for Cancer Therapy
- Micro and Nanoplastics–Plastisphere, Biotoxicity, Impact on Human Health, and Mitigation Strategies
- Process Validation of Cefixime Powder for Suspension Dosage Form, 50 mL