Caesarean Delivery in a German Population Based Birth Cohort with Special Focus on Maternal Request 1990-2013
Background: In the industrialized world, the proportion of caesarean sections (CS) is increasing over time. Estimating the incidence of caesarean delivery on maternal request (CDMR) to be 7–14% of all CS today. Previous studies described advanced maternal age, increasing maternal body mass index (BMI), multiple pregnancies, breech presentation, suspected low infant birthweight and private hospital status as reasons for the overall increase. The aim of this study was to evaluate the birth mode distribution in correlation to influencing factors over time. Methods: We analysed data on CDMR of the population-based Mainz birth registry from 1990-2013. The following known exposure were considered to be relevant: maternal age, BMI, diabetes, smoking and ethnicity, assisted reproductive technologies (ART), socioeconomic status of the family, infants birthweight, and year of data collection as a proxy for unknown risk factors. A logistic regression model quantifies the impact of these factors. Results: The overall proportion of CDMR was 4.1% of all births in the study period and 17.1% of all CS. The proportion of CDMR increased from 0.8% to 4.5% as well as CS from 16.4% to 29.5% from 1990 to 2013. The logistic regression model for CDMR showed significant results for maternal age, infants birthweight >90%ile, ART, smoking mothers, BMI, and maternal diabetes. However, a large proportion of the yearly increase remains unexplained. Conclusion: Since the CDMR proportion rises over time independently from the other factors, there have to be other factors influencing the CDMR rate.
Introduction
The proportion of women giving birth by CS is steadily increasing worldwide [1]. The CS rate increased from 20.7% in 1996 to 31.1% in 2006 in the USA [2]. This trend has also been observed in Germany; 15.3% in 1991 and 31.7% in 2012 [3]. The increase in CS has been attributed to aspects such as advanced maternal age or increasing maternal BMI, multiple pregnancies, breech presentation, suspected low infant birth weight and private hospital status [4]. Further aspects include organizational factors, obstetrician’s characteristics and maternal choice [5].
The term caesarean delivery on maternal request defines a caesarean delivery performed without medical indication [5]. The analysis of CDMR is complex, since it is necessary to differentiate it from CS as an outcome of a planned vaginal delivery and CS due to medical indication. Administrative hospital and health data in only allow medically relevant diagnosis / therapy and do not have codes or terms, specific to CDMR, its incidence remaining speculative.
The worldwide incidence of CDMR is estimated to be 7–14% of all CS [5, 6]. In 2010, the World Health Organization published a report to estimate the additional number of actually needed and the number of possibly overused CS, whereby countries with CS rates below 10% were considered to show underuse and countries with rates above 15% overuse. This study also estimated that in 2008, 6.2 million additional “unnecessary” sections were performed and CDMR seem to command a disproportionate share of global economic resources, at least in the industrialised world [7].
In 2006, a panel of experts at the National Institutes of Health reviewed literature and expert opinions on CDMR. The panel concluded that the evidence of CDMR and planned vaginal delivery does not provide the basis for a recommendation [8]. Since the evidence for potential risks and benefits of CDMR is very limited, additional studies are needed.
The aim of this study was to evaluate the birth mode distribution over time and the factors influencing the CS rate with special regard to maternal request and to develop hypothesis on the underlying causes.
Methods
Birth Registry Mainz Model
The “Mainz Model” (MaMo) was launched in 1990 as a screening project (birth registry) mainly to determine incidences and etiological causes of congenital anomalies. All neonates (livebirths, stillbirths, spontaneous abortions >15th gestational week, and induced abortions) born in Mainz receive standardized examinations after birth. The covered population-based area consists of the Mainz district (city and surrounding areas; approximately 95% coverage of all officially registered births of “Rheinhessen”) [9]. The registry surveys about 10% of all births in Rhineland- Palatine, Germany. The examinations on livebirths, including an ultrasound of the kidneys, were performed actively within the first three days of life by specially trained paediatricians of the MaMo. Anamnestic data as well as family history and environmental factors were collected from the midwives notes six weeks prior to birth. Additional knowledge on exposures was obtained from general practitioner notes, maternity passports and ward files; including medications, existing diseases and chronic conditions notified by the examining MaMo physicist before the actual examination to avoid recall bias.
Dataset and Definitions
Study period: MaMo data 1990 to 2013. Inclusion criteria: Term singleton livebirths (≥ 37 weeks of gestation). Outcome: Caesarean Section (CS)/Caesarean Delivery on Maternal Request (CDMR).
“Primary caesarean section” was defined as a procedure, which is planned before the woman is going into labour. The indication for a “secondary caesarean” delivery is given in an emergency, even if the caesarean delivery was planned from the very beginning.
The evaluation of CDMR is indirect, since our birth documentation system does not offer a specific variable, as it is not an official “term/diagnosis”. CDMR was defined as primary CS without any medical indication and calculated, excluding secondary CS and medical indications such as: placenta praevia, hydramnios, oligohydramnios, placental insufficiency, abnormal presentation, eclampsia, previous CS, placental abruption, infection of the newborn, foetal acidosis or heart beat deceleration, cephalo-pelvic disproportion or risk of uterine rupture [10].
Exposures / “Risk Factors” considered in the analyses:
- Maternal age: continuous variable by age at birth in full years.
- Maternal BMI: BMI ≥ 30 post-delivery.
- Assisted Reproductive Technologies (ART): Intra Cytoplasmatic Sperm injection (ICSI) and In Vitro Fertilization (IVF).
- Socioeconomic status (SES) of the family: Job description of mother and/or father is descripted by seven categories each: 1: housewives; 2: students; 3: social welfare recipients; 4: common labourer; 5: specialist workers; 6: master craftsmen/qualified employees/self-employed with small companies; 7: highly qualified employees like scientific worker or department managers/high officials/self-employed with larger companies. The highest job description of either mother or father was used for the calculation. Afterwards the SES of the family was divided into three categories: low, middle and high. Categories 1 to 4 corresponds to low, categories 5 and 6 to middle and category 7 to high SES. This method to describe the socioeconomic status of a family shows a high concordance to the method described by Winkler [10].
- Smoking status of the mother: positive if indicated cigarette consumption (never vs. ever) at the beginning or during pregnancy.
- Maternal emigrational background, categorized in seven groups: 1: German; 2: Middle-/ northern European / northern American; 3: Mediterranean countries; 4: Eastern Europe; 5: Middle East/ Northern Africa; 6: Asian; 7: Others.
- Large for gestational age: parameter chosen for high birthweight, defined as >90th percentile, common in birth research infants weight as measured in the delivery room [10, 11].
- Maternal diabetes; the information on maternal pre- existing diabetes mellitus or gestational diabetes was extracted from anamnestic data or insulin was notified as medication.
- Time (continuous by year of birth) was chosen as exposition and a proxy for unknown risk factors for CDMR maybe referring to lifestyle, “fashion” and as part of society thinking today.
Statistical Evaluation
Means and standard deviations were used for description of continuous measures. Descriptive statistics for discrete variables were presented as frequencies and proportions. To describe changes of the outcome of interest over time, percentages in four-year time periods were shown to facilitate interpretation and avoid low numbers. Due to rare missing data in relevant variables (<1%), we assumed “missing at random”, if not stated otherwise.
The interaction of the exposures, i. e. diabetes and LGA, etc. are addressed in the regression model. To estimate the effect size on the outcome of interest, a stepwise backwards logistic regression model was performed. Results were presented as odds ratio (OR) with 95% confidence interval (CI). Since the population- based dataset covers the complete and large cohort, considering p values below 0.05 as statistically significant. Spontaneous term singleton births were chosen for a valid comparison of CDMR cases. All analyses were performed using the statistical software SAS (version 9.2).
Ethics and Data Protection
The responsible ethics committee and data protection office approved the procedures and changes over time of the MaMo birth registry. An informed consent to use all routinely acquired (no additional data/samples was collected for the MaMo) data for scientific research is part of the admission contract between the patient and the university (opt in). The analysis data set consists of anonymous data and aggregated results are presented.
Results
Study Cohort Constitution
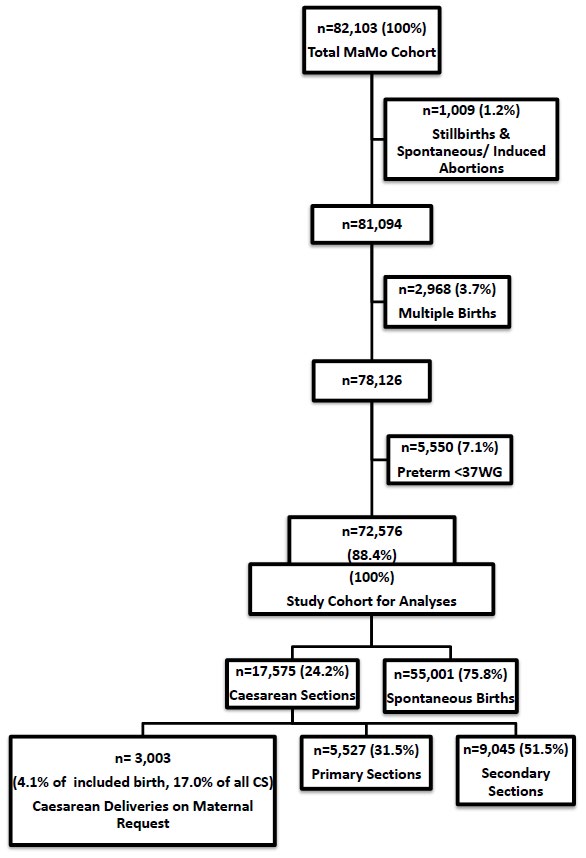
The MaMo cohort 1990-2013 included a total of 82,103 neonates. The demographic and clinical information of the infants before the application of the inclusion criteria are listed in Table 1. For the analysis 107 stillbirths, 702 spontaneous abortions, 200 induced abortions 3,135 multiples and, further 7,981 (9.8%) preterm births were excluded.
- n=82,103 n=72,576 n
- %
- Missing n
- %
- Missing
- Live births
- 81,094
- 98.8
- -
- Stillbirths
- 107
- 0.1
- -
- Spontaneous abortions (>15 WG)
- 702
- 0.9
- -
- Induced abortions
- 200
- 0.2
- -
- Multiple births
- 3,137
- 3.9
- 2
- Gestational age ≥ 37 WG
- 73,987
- 90.2
- Exclusion criteria
- Gestational age 34-36 WG
- 4,728
- 5.8
- 135
- Gestational age ≤ 33 WG
- 3,253
- 4
- LGA° (>90%ile)
- 6,346
- 7.7
- 355
- 6,334
- 8.7
- -
- Smoking (yes)
- 11,101
- 13.9
- 2,131
- 9,734
- 13.7
- 1,351
- BMI ≥ 30 (yes)
- 6,010
- 7.3
- -
- 5,315
- 7.3
- -
- Diabetes (yes)
- 4,008
- 4.9
- -
- 3,502
- 4.8
- -
- German background
- 59,248
- 72.2
- 756
- 52,424
- 72.2
- 573
- ART (yes)
- 1,513
- 1.8
- -
- 725
- 1
- -
- SES High
- Medium
- Low
- 10
- 60.4
- 14.2
- 12,674
- 7,279
- 44,510
- 1,0406
- 8,218
- 49,595 1,1616 mean (St. dev.) mean (St. dev.)
- Maternal age (years)
- 29.8 (5.3)
- 243
- 29.7(5.3)
- 70
Table 1: Differences between the whole data set (1) and analysis data (2); MaMo cohort1990-2013.
Table 1: Differences between the whole data set (1) and analysis data (2); MaMo cohort1990-2013. WG: Week of Gestation; LGA: Large for gestational age; ART: Assisted reproductive technologies; SES: Socio-economic status The analysis dataset consists of 72,576 live born infants. Out of these 24.2% (n=17,575) were delivered by CS. Subdivided 31.5% (n=5,527) were primary CS, and 17.0% (n=3,003) of all sections had a CDMR. Out of term live birth 4.1% had a CDMR over the study period (Figure 1). The average gestational age at birth was 39.6 weeks with an average birthweight of 3,443 g, bearing in mind that the preterm births were excluded.
Birth Modes in the Study Cohort over Time
While the proportion of spontaneous births decreased from 74.0% in 1990-1993 to 65.2% in 2010-2013, CS increased from 16.4% to 29.5% and the proportion of CDMR increased from 0.8% in 1990-1993 to 4.5% in 2010-2013.
Potential Risk Factors for CS and CDMR and Changes over Time
Average maternal age increased from 28.1 years in 1990 to 31.1 years in 2013. The mean maternal age was 29.4 for spontaneous births, 31.1 for primary CS, 30.2 for secondary CS and 31.9 for CDMR. Figure 2 shows the increase in CS and CDMR by increasing maternal age and Figure 3 by year.
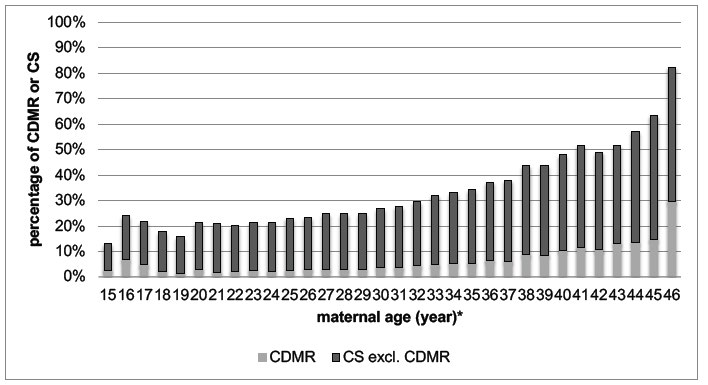
*excluded: age<15/n=13 and age>46/n=15 CS: caesarean section CDMR: caesarean delivery on maternal request Figure 2: CDMR and CS total by maternal age; MaMo analysis data set 1990–2013 (n=72,576).
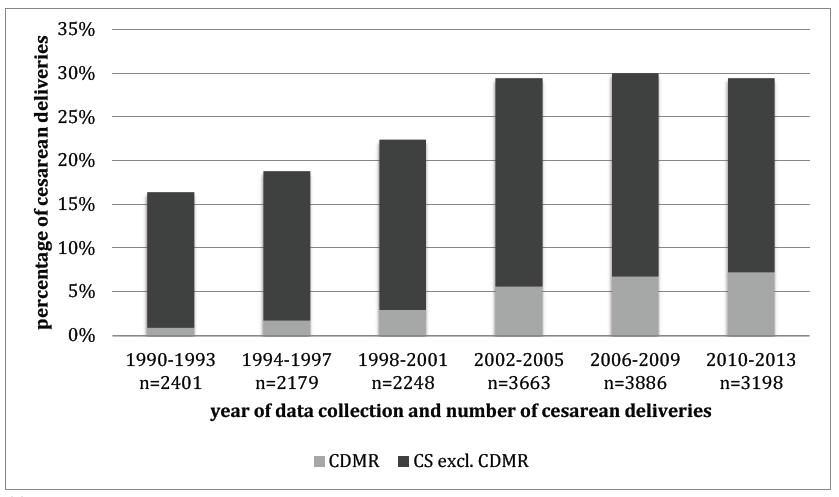
CS: caesarean section CDMR: caesarean delivery on maternal request Figure 3: CDMR and CS total by year of data collection; MaMo analysis data set 1990–2013 (n=72,576).
The proportion of mothers with a BMI ≥ 30 was 7.3% in the study cohort and increasing from 6.3% in 1990-1993 to 12.7% in 2010-2013. The percentage was also higher in the group of CDMR compared to spontaneous births (11.0 vs. 4.4).
In Mainz the first IVF case occurred in 1990, the first ICSI in 1994. The proportion of ART in the study cohort increased from 0.04% in 1990-1993 to 1.9% in 2010- 2013. The proportion of ART was higher in primary CS, secondary CS and CDMR compared to spontaneous births (1.8%/1.5%/2.5% vs. 0.7%) (Table 2).
The percentage of smoking mothers decreased from 17.0% in 1990 to 7.9% in 2013 not influencing the birth mode.
The proportion of pre-existing diabetes mellitus or
gestational diabetes was higher in CDMR than in spontaneous births (10.2% vs. 4.1%). The proportion of infants, who were large for gestational age, was higher in CDMR than in spontaneous births (13.2% vs. 8.0%) (Table 2).
The proportion of CS nearly doubled over time from 16.4% in 1990-1993 to 29.5% in 2010-2013, whilst CDMR increased from 0.8% in 1990-1993 to 4.5% in 2010-2013, a fivefold increase.
| Risk factors | Outcome | |||||
|---|---|---|---|---|---|---|
| Spont. Births n=55,001 | Primary CS n=5,527 | Secondary CS n=9,045 | CDMR n=3,003 | |||
| Maternal age (years) | Mean (St. dev.) | 29.4 (5.2) | 31.1 (5.2) | 30.2 (5.3) | 31.9 (5.5) | |
| ART (yes) | n (%) | 355 (0.7) | 99 (1.8) | 139 (1.5) | 74 (2.5) | |
| Smoking status (yes) | 6,828(13.7) | 708(12.8) | 1,148(12.7) | 412(13.7) | ||
| German (yes) | 2,135(70.9) | 4,014(72.7) | 6,513(72) | 2,135(70.9) | ||
| BMI ≥ 30 | 3,119 (6.3) | 587(10.6) | 936(10.4) | 380(12.7) | ||
| Diabetes (yes) | 2,026 (4.1) | 392 (7.1) | 580 (6.4) | 306(10.2) | ||
| LGA (yes) | 3,986 (8.0) | 550(10) | 1,016(11.2) | 396(13.2) | ||
| SES | high | 4,727 (9.5) | 673(12.2) | 965(10.7) | 371(12.3) | |
| mid | 30,524(61.2) | 3,333(60.4) | 5,616(62.1) | 1,862(61.9) | ||
| low | 7,629(15.3) | 694(12.6) | 1,150(12.7) | 349(11.6) |
Table 2: Potential risk factors for CS and CDMR in live born term singletons; MaMo analysis data set (n=72,576). CS: caesarean se
Logistic Regression Model for Caesarean Delivery on Maternal Request
birth. Each parameter is contributing an individual effect in the given context. From the start model SES and migration background were excluded due to no significant effect. ART led to the most significant impact, independent of the other factors (OR: 1.55). Furthermore, the probability for CDMR increased per year of data collection independently of all other included known factors (Table 3).
- Table 3 shows the risk estimates (odds ratios, 95% confidence intervals and p-values) of the logistic regression end model for the outcome CDMR versus spontaneous
- Factor
- OR
- CI p-value
- Infant
- Birthweight (>90%ile)
- 1.49
- 1.33, 1.66
- <0.0001
- Maternal
- ART (yes)
- 1.55
- 1.21, 1.99
- 0.0006
- BMI ≥ 30 (yes)
- 1.44
- 1.29, 1.62
- <0.0001
- Smoking (yes)
- 1.43
- 1.28, 1.59
- <0.0001
- Diabetes (yes)
- 1.31
- 1.15, 1.49
- <0.0001
- Maternal age (by year)
- 1.07
- 1.06, 1.07
- <0.0001
- Independent
- Time (per year)
- 1.09
- 1.09, 1.10
- <0.0001
Table 3: Final models after stepwise backwards logistic regression for caesarean delivery on maternal request; MaMo Analysis
Comments
The MaMo birth cohort covers a complete population including the Mainz district. Comparing birthweight values to the German perinatal survey (singleton) or the maternal age to the German birth statistics, the results are in concordance [11, 12].
The point estimate of CS doubled, forceps deliveries tend towards null and vacuum-extractions remained stable. The German Federal Statistical Office reported a similar trend for CS from 1991 to 2012, corroborating our findings [3]. Similar trends are observed in other high-income countries like the USA with an about 30% increase of CS from 1996 to 2006 or in Australia from 1998 to 2007 [2].
The worldwide incidence of CDMR is estimated to be 7-14% of all caesarean deliveries. In the USA the incidence is 2.5% of all deliveries [5, 6, 13]. Most of the publications do not exclude emergency indications for CS, resulting in low to moderate relevance to CDMR incidence definition. One study from Scotland offers evidence of high relevance to CDMR. Wilkinson, et al. reported a CDMR rate of 7.7% of all singleton caesarean deliveries [13]. Other studies also reported CDMR rates of 7% and 8% of all CS [5, 6].
As expected, the overall point prevalence for CDMR amount to 4.1% of all deliveries and 17.1% of all CS in our cohort and are thus even higher compared to data from previous reports [5, 6]. Furthermore the strict definition 12 of CDMR has to be held in favour and hints towards an underestimate of previous results. All studies indicate an increase in CDMR rate over time [5, 6]. Prediction for the future base on rising numbers.
Previous works described advanced maternal age, increasing maternal BMI, multiple pregnancies, breech presentation, suspected low infant birthweight and private hospital status as reasons for the observed increase in CS [4]. We tested the following known parameters:
- Year of data collection,
- maternal age,
- ART,
- maternal BMI ≥ 30,
- maternal smoking,
- gestational or preexisting diabetes as well as
- a high birthweight, which yielded significant associations to an increased CDMR rate.
The average maternal age increased by three years within a period of 24 years. According to the official German birth statistics, the age of primipara in the former West German federal states also increased from 28.2 years in 1995 to 29.2 years in 2010 [14]. Possible reasons are longer education periods and extended periods of professional establishment [14]. Maternal age was highly significant associated with a higher proportion of CDMR. Timofeev, et al. [15] also described an almost doubled prevalence caesarean delivery rate in women above 35 years comparing to women younger than 20 years. This effect might be associated with higher rates of failure to progress and foetal distress in advanced maternal age this could partwise explain the higher rates of secondary CS in our cohort [15, 16].
We estimate, that in future maternal age will continue to increase with associated problems in childbearing women such as higher diabetes rates, chromosomal abnormalities, increase in the risk of miscarriage and the necessity of ART [17]. On the other hand, there is the possibility of higher rates of adverse outcomes in neonates of older mothers, since pregnancies after ART can lead to lower birth weight and shorter gestation [18]. If so, medical care as well as financial resources will be challenged additionally.
The proportion of ART in term singleton life birth was 1.0% and increased from 0.04% to 1.9% in the last years. The frequency of ART was more than five times higher in the group of CDMR compared to spontaneous births [13]. It seems these mothers are adviced to choose a CDMR or made this choice themselves out of fear after the challenging pregnancy development.
In previous studies, advanced maternal age was held responsible for rising numbers of pregnancies due to ART with a higher rate of twin- or triple-pregnancies [19, 20]. Additionally by some authors it was pointed out that pregnancies after ART lead to lower birthweight and shorter gestation, with higher rates of caesarean section [18, 21, 22]. We also found highly significant higher rates of CDMR, even after exclusion of multiples, stillbirths and preterm infants, still making ART one strong factor among many contributing factors.
A large observational study of more than 1,000,000 Chinese women found a positive association between maternal obesity and increased risk of CS and CDMR [23]. The authors concluded that due to the growing prevalence of obesity worldwide, the number of CS will also grow in the future [23]. We also found a growing proportion of maternal obesity over time and BMI ≥ 30 was positively associated with CDMR in the regression model and would therefore support their assumption for the future.
Previous literature presents contradictory results in CS rates depending on maternal SES. Lindquist, et al. [24] and Räisänen, et al. [25] described women with lower SES to be more likely to have a CS. On the other hand, in 2014 Shaaban, et al. [26] and Heredia-Pi, et al. [27] described a significant higher CS rate in women from Egypt and Mexico compared to spontaneous births, CDMR consists of a larger proportion of high SES (9.5% vs. 12.3%). This results might, at least interfere partially by the higher maternal age, in the group of high SES of the family. On the other hand, the effect did not change the regression model.
The proportion of smoking pregnant women halved over time and were equally distributed within the group of CDMR (13.7%). Smoking was remained a risk factor for CDMR in the logistic regression model (OR=1.43). These findings were surprising, since a positive smoking status should be associated with a lower SES and lower birthweight and therefore with a lower CDMR rate, but many factors lead to the decision for CDMR.
A large percentage of childbearing women in European high-income countries have an emigrational background [28]. In 2014, 34.6% of children in Germany up to 5 years of age had a migration background [29]. There is also wide international variation in CS rates among all births that range from less than 1% in some African countries to more than 40% in Brazil, Dominican Republic or Cyprus [30]. In the MaMo cohort, nearly one third of mothers have a non- German background. The regression model did not reveal significant differences between CDMR rates in women with or without emigrational background, in part be due to the large variety in this aggregated group. Gestational diabetes (with or without Insulin use) is a common metabolic disorder, which increasingly affects 2-10% of pregnant women today [31]. Its incidence varies by ethnic origin and diagnostic criteria [31]. The increase worldwide is postulated to be due to a rise in maternal body mass index and age [32]. Otherwise, the benchmarks for the diagnosis of gestational diabetes as well as an implemented screening for it have changed pregnancy as such. Pregnancies of woman with pre-existing diabetes or complicated by gestational diabetes may be associated with excessive foetal growth, leading to infants with macrosomia and may lead to higher rates of caesarean section [33]. The intensified treatment reduces these risks [34]. It can also be speculated that mothers with diagnosed pre-existing or gestational diabetes are more willing to make a decision or they get a recommendation for a planned CS from their obstetrician. Nevertheless, pre-existing or gestational diabetes showed a relevant, statistically significant, higher proportion of CDMR in the logistic regression model. In addition, a high birthweight (LGA) was a significant risk factor for CDMR in the model. Since 92.8% of the mothers with infants who were LGA had no history of diabetes, there is a very small interaction between the two factors in our cohort. The higher rate of CDMR is interacting with LGA and a higher rate of cephalo-pelvic disproportions, which results in a medical advice followed by the maternal choice of a planned CS. A minor influence could also be explained by increasing maternal BMI or repeated caesarean sections [34]. Both to be seen in the context of diabetes, equal to strong interaction in between these variables.
The logistic regression start model showed highly significant results for maternal age, maternal BMI ≥ 30, diabetes, birth weight >90%ile, ART, smoking and year. The high birthweigth was the only foetal factor. It can be assumed that large fetus have influenced the decision for a CS.
The proportion of CDMR increased more than fivefold over time. As time remains an independent risk factor for CDMR we estimate it being proxy for unknown risk factors affecting the increase of CDMR. These include hypothesis on possible reasons we could not analyse, i. e. organizational factors such as maternal convenience and choice for better planning reliability or obstetrician’s recommendation. The factor “private hospital status” might contribute as well.
Betran, et al. [35] described the proportion of CS at 21.1% in developed and only 2% in least developed countries. The authors also discussed that in least developed countries with high levels of maternal, infant and neonatal mortality and low CS rates the access to CS needs to be improved. On the other hand, high CS rates may be an indicator for maternal mortality in developed countries. This assumption is based on the data from the United Kingdom Confidential Enquiry into Maternal Deaths reported by Hall et al. showing a 2.84 times greater maternal mortality after elective CS comparing to vaginal delivery. Based on the underlying data consideration should be given to whether CDMR can lead to a higher maternal mortality [36].
Strength of this work include:
- Coverage of a complete population-based dataset, prospectively excluding selections like ascertainment bias.
- Active data ascertainment (examination standards and coding kept over time) and size of the cohort.
- As a result the low number of missing’s leading to a high internal and external validity.
Limitation of this work constitute that CDMR was defined by exclusion only. Cases were concerned CDMR if not categorized otherwise. However, it can be assumed that the actual number is even higher, because of “hidden” CDMR within secondary CS, thus resulting in a conservative approach and further effects are more likely changing effects away from the null. As usual in epidemiological analysis, the Mainz cohort might differ from the rest of Germany.
Large population based prospective cohorts like the
MaMo are an excellent basis for complex scientific questions like determining the proportion of CDMR and calculate differences between risk groups. Since the number of CDMR by year rises constantly there have to be further variables affecting the CDMR rate. Underlying hypothesis include a tendency to convince the becoming mothers or the benefits of CS or stricter indications, or maternal “convenience”.
Conclusion
The proportion of women giving birth by CS as well as CDMR is steadily increasing over time. The logistic regression model for CDMR showed significant results for maternal age, smoking, diabetes, and BMI ≥ 30, birthweight >90percentile, ART conception, and the year of data collection. As time remains an independent risk factor for CDMR and as proxy for unknown factors, it can be concluded, that further reasons leading to the increase of CDMR. Most likely organizational factors such as maternal convenience. Future research should focus on the reasons for the increase of CDMR, as well as risks and benefits for mother and child and its impact on health politics.
Acknowledgment
Special thanks to Professor Michael S. Urschitz (Division of Paediatric Epidemiology, Institute of Medical Biostatistics, Epidemiology, and Informatics, University Medical Centre of the Johannes Gutenberg-University) for his professional view and advice.
References
-
DGGG-German Society for Gynecology and Obstetrics (2010) Absolute and relative indications for cesarean section. AWMF guideline 015/054.
-
Martin JA, Hamilton BE, Sutton PD, Ventura SJ, Mathews TJ, et al. (2009) Births: final data for 2006. Natl Vital Stat Rep 58(24): 1-85.
-
(2012) Share of caesarean sections decreased by 0.4 percentage points in 2012. Press release, Federal Office of Statistics, Nr: 357.
-
(2016) Press Release. Federal Statistical Office.
-
Naftalin J, Paterson-Brown S (2008) A pilot study exploring the impact of maternal age and raised body mass index on caesarean section rates. J Obstet Gynaecol; 28(4):394-397.
-
Thomas J, Paranjothy S (2001) RCOG Clinical Effectiveness Support Unit. The National Sentinel Caesarean Section Audit Report. RCOG Press, London, UK.
-
Barber EL, Lundsberg L, Belanger K, Pettker CM, Funai EF, et al. (2011) Contributing Indications to the Rising Cesarean Delivery Rate. Obstet Gynecol 118(1): 29-38.
-
Gibbons L, Belizán JM, Lauer JA, Betrán AP, Merialdi M, et al. (2012) Inequities in the use of cesarean section deliveries in the world. Am J Obstet Gynecol 206(4): 331e1-331-e19.
-
(2006) NIH State-of-the-Science Conference Statement on cesarean18 delivery on maternal request. NIH Consens State Sci Statements 23: 1-29.
-
(2016) State Statistical Office of Rhineland-Palatinate. Statistical yearbook.
-
Winkler J, Stolzenberg H (1999) The social class index in the Federal Health Survey. Healthcare 61: 178-183.
-
Voigt M, Rochow N, Schneider KTM, Hagenah HP, Scholz R, et al. (2014) New percentile values for the body measurements of newborn singles: Results of the German perinatal survey from 2007–2011 with the participation of all 16 federal states. Z Obstetrics Neonatol 218(05): 210-217.
-
(2018) Facts & Figures. Society & state. Population. Statistisches Bundesamt.
-
Wilkinson C, McIlwaine G, Boulton-Jones C, Cole S (1998) Is a rising caesarean section rate inevitable? Br J Obstet Gynaecol 105(1): 45-52.
-
(2012) Geburten in Deutschland. Statistisches Bundesamt.
-
Timofeev J, Reddy UM, Huang CC, Driggers RW, Landy HJ, et al. (2013) Obstetric complications, neonatal morbidity, and indications for cesarean delivery by maternal age. Obstet Gynecol 122(6): 1184-1195.
-
Ecker JL, Chen KT, Cohen AP, Riley LE, Lieberman ES (2001) Increased risk of cesarean delivery with advancing maternal age: Indications and associated factors in nulliparous women. Am J Obstet Gynecol 185(4): 883-887.
-
Heffner LJ (2004) Advanced maternal age-how old is too old? N Engl J Med 351(19): 1927-1929.
-
Schieve LA, Meikle SF, Ferre C, Peterson HB, Jeng G, et al. (2002) Low and very low birthweight in infants conceived with use of assisted reproductive technology. N Engl J Med 346(10): 731-737.
-
Wilcox LS, Kiely JL, Melvin CL, Martin MC (1996) Assisted reproductive technologies: estimates of their contribution to multiple births and newborn hospital days in the United States. Fertil Steril 65(2): 361-366.
-
Bergh T, Ericson A, Hillensjö T, Nygren KG, Wennerholm UB (1999) Deliveries and children born after in-vitro fertilisation in Sweden 1982�95: a retrospective cohort study. Lancet 354(9190): 1579-1585.
-
Helmerhorst FM, Perquin DAM, Donker D, Keirse MJNC (2004) Perinatal outcome of singletons and twins after assisted conception: A systematic review of controlled studies. BMJ 328(7434): 261-265.
-
Luke B, Stern JE, Kotelchuck M, Declercq ER, Cohen B, et al. (2015) Birth Outcomes by Infertility Diagnosis: Analyses of the Massachusetts Outcomes Study of Assisted Reproductive Technologies (MOSART). J Reprod Med 60(11-12): 480-490.
-
Zhou Y, Blustein J, Li H, Ye R, Zhu L, et al. (2015) Maternal obesity, caesarean delivery and caesarean delivery on maternal request: a cohort analysis from China. Paediatr Perinat Epidemiol 29(3): 232-240.
-
Lindquist A, Kurinczuk JJ, Redshaw M, Knight M (2015) Experiences, utilisation and outcomes of maternity care in England among women from different socio-economic groups: findings from the 2010. National Maternity Survey 122(12): 1610-1617.
-
Räisänen S, Gissler M, Kramer MR, Heinonen S (2014) Influence of delivery characteristics and socioeconomic status on giving birth by caesarean section – a cross sectional study during 2000–2010 in Finland. BMC Pregnancy Childbirth 14: 120.
-
Shaaban MM, Sayed Ahmed WA, Khadr Z, El-Sayed HF (2014) Rising cesarean section rates, a patient’s perspective: experience from a high birth rate country. Clin Exp Obstet Gynecol 41(4): 436-439.
-
Heredia-Pi I, Servan-Mori EE, Wirtz VJ, Avila-Burgos L, Lozano R (2014) Obstetric Care and Method of Delivery in Mexico: Results from the 2012 National Health and Nutrition Survey. PloS ONE 9(8): e104166.
-
Teixeira C, Correia S, Victora CG, Barros H (2013) The Brazilian Preference: Cesarean Delivery among Immigrants in Portugal. PloS ONE 8(3): e60168.
-
(2014) Population and employment. Population with a migration background. Results of the microcensus. Statistisches Bundesamt.
-
WHO (2011) World Health Statistics, World Health Organization.
-
Centers for Disease Control and Prevention (2008) National Diabetes Fact Sheet: General Information and National Estimates on Diabetes in the United States, 2007. Atlanta, GA, U.S. Department of Health and Human Services, Centers for Disease Control and Prevention.
-
Hunt KJ, Schuller KL (2007) The increasing prevalence of diabetes in pregnancy. Obstetrics and Gynecology Clinics of North America 34(2): 173-199.
-
Ostlund I, Hanson U, Bjorklund A, Hjertberg R, Nord E, et al. (2003) Maternal and fetal outcomes if gestational impaired glucose tolerance is not treated. Diabetes Care 26(7): 2107-2111.
-
Langer O, Rodriguez DA, Xenakis MJ, McFarland MB, Berkus MD, et al. (1994) Intensified versus conventional management of gestational diabetes. American Journal of Obstetrics and Gynecology 170(4): 1036-1047.
-
Betran AP, Merialdi M, LauerJA, Bing-Shun W, Thomas J, et al. (2007) Rates of caesarean section: analysis of global, regional and national estimates. Paediatr Perinat Epidemiol 21(2): 98-113.
- Postpartum Maternal Mental Health - A Narrative Review
- Beta HCG in Cervico-Vaginal Secretion as a Predictor of Preterm Delivery
- Successful Management of Mid Trimester Foetal Death with Major Placenta Previa by Expectant Management Followed by Induction of Labour
- To Evaluate the Expression of Egr2 Gene in Term Low Birth Weight Newborns
- Impact of Maternal Obesity on Maternal and Foetal Outcomes: A Prospective Cohort Study from Northern India
- ‘’Benefit of Pulsatile GnRH Therapy in Treatment of Functional Hypothalamic Amenorrhea (FHA) and Congenital Hypogonadotropic Hypogonadism(CHH) in Infertile Patients Over Canonical Gonadotropins with IVF –A Short Communication’’