Porous Media Characterization of Bhogpara and Nahorkatiya Oil Fields of Upper Assam Basin
Bhogpara and Nahorkatiya oil fields are the depleted and matured oil fields of Upper Assam Basin. The recoveries of oil in these fields are getting decreased day by day as conventional methods are unable to recover more oil. The demand for using an unconventional method becomes an attractive option for the matured oil fields. For using unconventional methods like enhanced oil recovery requires a proper characterization of porous media. Characterization and determination of rock properties are the key factors for managing and enhancing oil recoveries. This paper deals with porous media characterization of Bhogpara and Nahorkatiya oil fields of Upper Assam Basin to determine the applicability of enhanced oil recovery techniques for improving its oil recovery rate. The rock characterization was done by carrying out Petrographic analysis, Sieve analysis, and Porosity & Permeability determination. The various analysis of porous media of Bhogpara and Nahorkatiya oil fields shows that they are good candidates for enhanced oil recovery processes.
Introduction
Characterization of the reservoir rock is an important key for estimation of porous media properties to manage oil and gas recovery. Rock properties such as absolute and relative permeability are critical to the characterization of oil and gas reservoirs and are key factors to managing, and enhancing resource recovery [1]. Rock characterization can be done by observing the thin section slides under a microscope, known as Petrography study.
This is the study of mineral composition of rocks which gives us clues about the source rock, environment of deposition, digenetic history, tectonic setup of the source area, etc. and thus helps us in understanding the geologic history of the study area. Rock characterization can further be done by Scanning Electron Microscope (SEM) which is used to provide accurate description of the reservoir rock surface topography. The SEM is used to attain the pore size distribution of the rock, besides three dimensional views of the minerals. Besides many metric properties, the topology of the structure is also highly relevant for any kind of transport, with the idea of the way the structural units are interconnected [2]. The grain size distribution analyses helps to examine the coarseness and fineness of the grains present in the reservoir core samples. The value of Klinkenberg’s permeability obtained after applying the correction represents the permeability to a gas at infinite pressure or to a liquid that does not react with the component minerals of the rock.
The pore structures of natural materials like rocks, soils etc., as well as those of many synthetics play a critical role in controlling the physical properties and processes in rocks [3, 4, 5].
Experimental Analysis
Materials
The porous media selected were from Bhogpara and Nahorkatiya (Deohal) oil fields of the eastern part of Upper Assam Basin. The core samples were taken from a depth of 3827 - 3837 m and 3836 - 3839 m respectively. Petrographic studies of thin section slides were carried out under Leica microscope. The three dimensional photographs of the rock samples were taken by the Scanning Electron Microscope (SEM). Grain size distribution of the rock samples was done in a mechanical shaker and ASTM sieves. The porosity of various samples of Bhogpara and Nahorkatiya porous media was obtained using TPI-219 Teaching Helium Porosimeter, Coretest systems. The Air permeability of various samples was calculated by Gas Permeameter, Vinci Technologies.
Methods
Rock Petrography and SEM Analysis: Petrography is the study of mineral composition of rocks which gives us clues about the source rock, environment of deposition, diagenetic history, tectonic setup of the source area etc, helps us in understanding the geologic history of the study area. Petrographic studies of thin section slides are prepared from selected cutting samples of Bhogpara oil field and Nahorkatiya oil field.
SEM is a type of electron microscope that produces images of a sample by scanning it with a focused beam of electrons. SEM can achieve resolution better than 1 nanometer (nm). Specimens can be observed in high vacuum, low vacuum and in environmental SEM specimens can be observed in wet conditions. The spatial resolution of the SEM depends on the size of the electron spot, which in turn depends on both the wavelength of the electrons and the electron-optical system which produces the scanning beam.
Grain Size Distribution: Mechanical analysis of the core sample of BH(A) and NH(B) have been undertaken for understanding grain size distribution of the sedimentary formations. This has been done by mechanically analyzing the sample with the help of a mechanical shaker and various sieves by sieve analysis method [6]. Initially these consolidated samples have been poured in water in beakers for a few days. Most of the samples have been found to be disintegrated in the process. Remaining hard portion of the samples which remained consolidated has been stirred by fingers gently. In this process, the whole sample has been found disaggregated. The disaggregated sample have been cleaned by washing with water and decanting them from the beaker and then dried. Sieving is commonly used in determining the grain size distribution of a particular core sample. The dried sample is placed in the uppermost sieve in a set of stacked sieves. The stack of sieves arranged in order so that the coarsest sieve is at the top with finer ones below (with a pan at the bottom to catch any sediment that passes through the lowest and finest sieve) is placed on a shaking machine. After ten minutes of shaking, samples collected from each sieve and from pan are weighed and further calculations and graphical analysis are done to study grain size analysis.
Porosity: The porosity of various samples of BH(A) and NH(B) porous media were obtained using TPI-219 Teaching Helium Porosimeter, Coretest systems. The TPI-219 is a manually operated Helium Porosimeter that is primarily used to determine the grain volume of a sample of earth material. The basic principle behind the measurement is Boyle’s Law which describes the relationship between the volume of a dry ideal gas and its pressure. The equations used for the measurement of porosity are:
$$V_{ref} = \frac{V_{billet removed}}{\frac{P_{ref removed}}{P_{cup removed}} - \frac{P_{ref full}}{P_{cup full}}}$$
$$V_{grain} = V_{billet removed} + \left( \frac{P_{ref full}}{P_{cup full}} - \frac{P_{ref sample}}{P_{cup sample}} \right) \times V_{ref}$$
$$V_{Bulk} = \frac{4}{3} \pi r^2 h$$
$$\Phi = porosity = \frac{Bulk vol. - Grain vol.}{Bulk vol.} \times 100$$
Air Permeability: The Air permeability of various samples was calculated by Gas Permeameter, Vinci Technologies. The Gasperm is a research quality instrument but it can be used for routine core analysis when rapid sample turn around and throughput is desirable. A selectable, separate back pressure flow facility permits accurate control of steady state gas flow and core pressure over the range of 0-2,000 cc/min and 0- 200 psi, enabling a greater control on Darcy flow conditions in cores with permeabilities in the range from less than 0.1 md to in excess of 10d. Two mass flow meters of respective range of 0-20 and 0-2000 cc/min together with a 0-8 psig differential pressure transmitter are used to sense gas flow and pressure drop across the sample and therefore provides an accurate determination of permeability, when the transmitters have been correctly calibrated. The instrument can be used with any standard Hassler-type core holder. Rapid changeover of core holder is permitted to switch from core diameter of 1” and 11/2” or any other diameter. Confining pressures up to 400 psig can be applied to the cores, and displayed on the Gasperm console. Using the differential pressure, gas flow rate and core dimensions the permeability was calculated by using the formula [7]:
μ
2 L QPb Air or gas permeability in Darcy’s = _K_a =
2 2 2 1 P P A
− ) ( Where in; Viscosity of the gas in cp = μ Volumetric flow rate in cc/s = Q Standard reference pressure of the flow meter in atm = Pb Inlet Pressure in atm = P1 From instrument reading we get Pressure difference between inlet and outlet = P Δ Outlet Pressure in atm = P_2 = _P1 + P Δ Length of core in cm = L Cross sectional area of core in cm = A
Results & Discussion
Rock Petrography and SEM Analysis
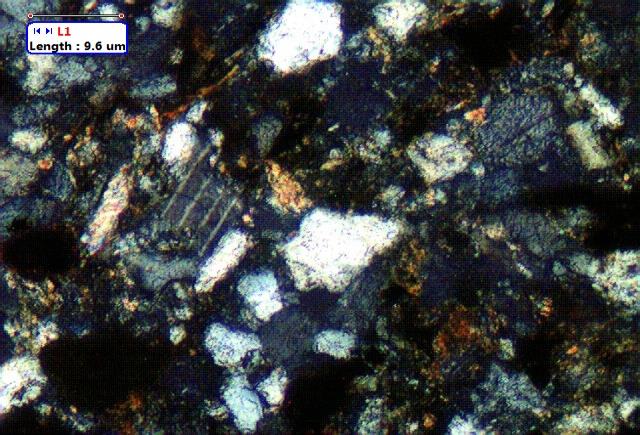
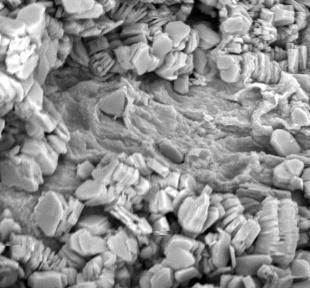
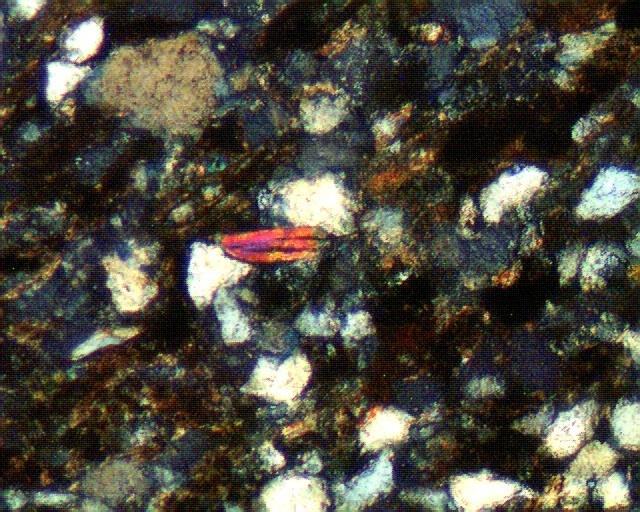
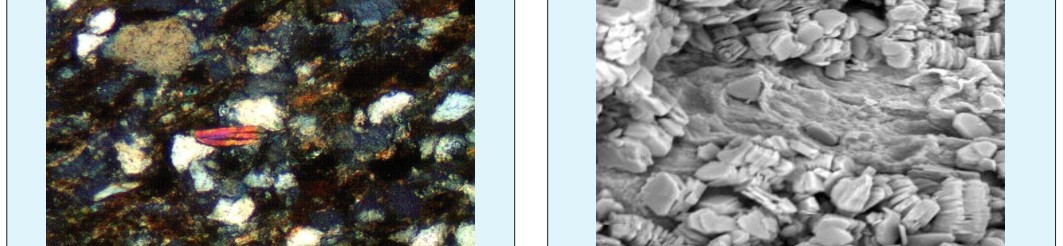
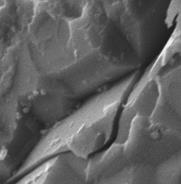
Thin section slides of BH(A) and NH(B) core samples shows the presence of minerals like feldspar, quartz, mica and rock fragments. While chlorides and cherts were also present in BH(A). Feldspars are a group of rock- forming tecto-silicate minerals making approximately 60% of the Earth's crust. Quartz is made up of a continuous framework of SiO4 silicon–oxygen tetrahedra and oxygen being shared between two tetrahedra, giving an overall formula SiO2. The mica group includes materials having close to perfect basal cleavage. Some slides also shows presence of chert, which is a fine- grained silica-rich microcrystalline, cryptocrystalline or micro-fibrous sedimentary rock that may contain small fossils. Plagioclase feldspar was also seen in some slides which are often identified by its polysynthetic twinning which shows the presence of sodium and calcium atoms and observed as oblique fractures under cross polarized light. Some slides also shows the presence of clay in both BH(A) and NH(B) core samples but the quantity of clay content is more in case of BH(A) than in NH(B). Clay is a fine-grained soil that combines one or more clay minerals with traces of metal oxides and organic matter. SEM images of sandstone recovered from BH(A) shows the presence of Kaolinite and quartz overgrowth. SEM images of sandstone recovered from NH(B) also shows Kaolinite and presence of microfracture. Kaolinite is a clay mineral with the chemical composition Al2Si2O5(OH)4. The kaolinite in the book form and quartz overgrowths can disintegrate in the pore filling spaces causing a reduction in porosity and permeability (Figures 1-16) [8].
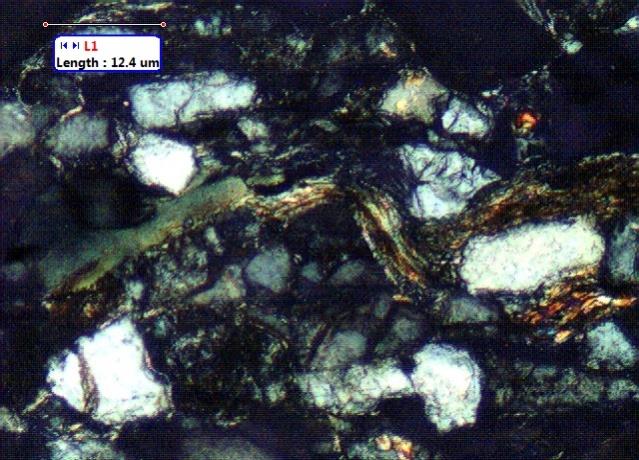
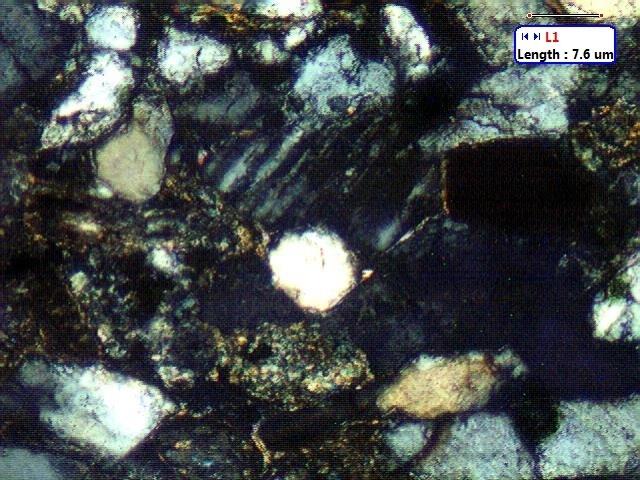
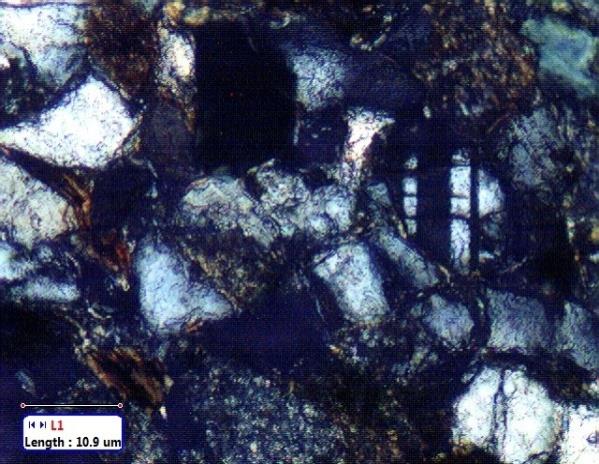
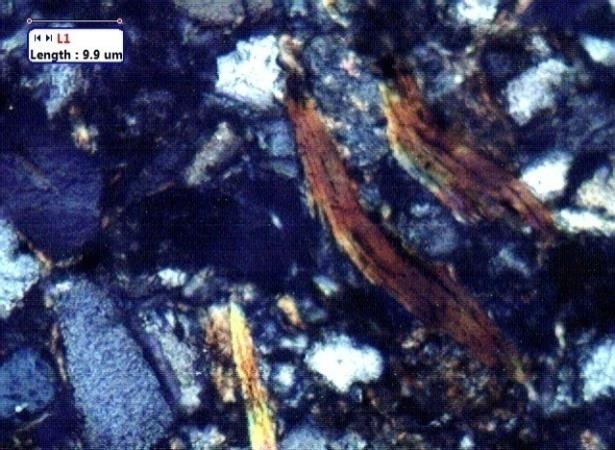
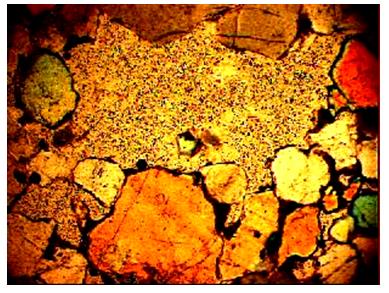
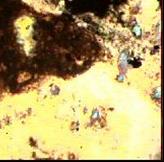
Figure7: Thin section images of sandstone recovered from BH(A) (depth=3827-3837m) showing the presence of clay.
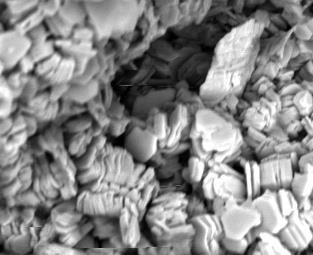
![Figure 16: SEM images of sandstone recovered from BH(A) (depth=3827-3837m)showing a pore. The predominant clay type from SEM was kaolinite which was present in all the samples examined. Photographs from SEM showed quartz overgrowths in BH(A) core samples. Quartz, diagenetic mica, feldspar form the main pore filling mineral phase [9,10]. The presence of chlorite restrict pore throat and consequently reduce permeability [11,12]. Petrophysical evaluations with high clay as in case of BH(A) underestimate the saturation of hydrocarbons if the conductivity of the clays is not considered [13]. By contrast, porosity values could be overestimated when petro physicists do not have the appropriate understanding of the occurrence of the different clays through the formations, as each has a unique way of affecting porosity. The replacement of chlorite by calcite in the model changes the total porosity only slightly as the tool response parameters for the two minerals are very similar (i.e. chlorite and calcite have similar densities). However, the addition of chlorite does have a considerable impact on water saturation, and effective porosity [13]. The books of kaolinite present in both BH(A) and NH(B) reduces permeability in the porous media [14].](/fulltextimages/1906/fig_16.jpeg)
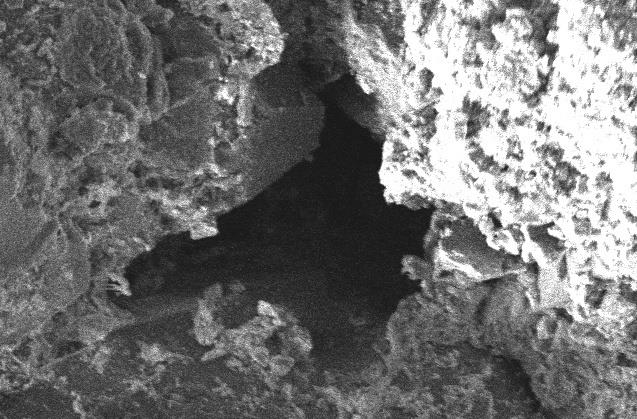
Figure 16: SEM images of sandstone recovered from BH(A) (depth=3827-3837m)showing a pore. The predominant clay type from SEM was kaolinite which was present in all the samples examined. Photographs from SEM showed quartz overgrowths in BH(A) core samples. Quartz, diagenetic mica, feldspar form the main pore filling mineral phase [9, 10]. The presence of chlorite restrict pore throat and consequently reduce permeability [11, 12]. Petrophysical evaluations with high clay as in case of BH(A) underestimate the saturation of hydrocarbons if the conductivity of the clays is not considered [13]. By contrast, porosity values could be overestimated when petro physicists do not have the appropriate understanding of the occurrence of the different clays through the formations, as each has a unique way of affecting porosity. The replacement of chlorite by calcite in the model changes the total porosity only slightly as the tool response parameters for the two minerals are very similar (i.e. chlorite and calcite have similar densities). However, the addition of chlorite does have a considerable impact on water saturation, and effective porosity [13]. The books of kaolinite present in both BH(A) and NH(B) reduces permeability in the porous media [14].
Grain Size Distribution
Grain size distribution of conventional core samples of BH(A) appeared very fine grained and NH(B) appeared coarse grained as observed in Table 1 and in Table 2 respectively. Lee et al (1989) [15] and Torabi et al (2013) [16] found that coarse grained rock samples have the highest permeabilities and oil production was higher in case of coarse grained than in fine grained rocks due to larger pore-throat size [15, 16, 17].
Sieve Mesh No. Size in mm = M Size in Phi (Ф) units Ф = log(M)/-0.30103 Wt. % Cumulative wt. % Size Class
60 0.25 2 9.6 9.6 fine sand 80 0.177 2.5 7.3 16.9 fine sand 120 0.125 3 31.7 48.6 very fine sand
- 170
- 0.088
- 3.5
- 23.62
- 72.22 very fine sand
- 230
- 0.0625
- 4
- 15.12
- 87.34 very fine sand
- 325
- 0.044
- 4.5
- 4.26
- 91.6 coarse silt
- Pan
- 7.46
- 99.06 coarse silt
Table 1: Grain size distribution of Bhogpara BH (A) sand.
- Sieve Mesh No. Size in mm = M Size in Phi (Ф) units Ф = log(M)/-0.30103 Wt. % Cumulative wt. %
- Size Class
- 25
- 0.5
- 0
- 4.02
- 4.02
- Very coarse sand
- 40
- 0.35
- 0.49
- 13.89
- 17.91
- Very coarse sand
- 60
- 0.25
- 1
- 26.64
- 44.55
- Coarse sand
- 80
- 0.177
- 1.51
- 17.68
- 81.54
- Coarse sand
- 120
- 0.125
- 2
- 19.31
- 63.86
- Medium sand
- 230
- 0.0625
- 3
- 4.88
- 95.2
- Very Fine sand
- 325
- 0.044
- 3.51
- 2.92
- 98.12
- Coarse silt
Table 2: Grain size distribution of Nahorkatiya NH(B) sand.
The porosities obtained from the core samples of BH(A)and NH(B) are shown in Table 3 & 4. The core samples from both Bhogpara and Nahorkatiya oil field shows that with increase in depth, the value of porosity increases. In more deeply buried, thermally mature
| Conventional Core Sample | Depth (m) | V (cc) ref | V (cc) grain | V (cc) bulk | ɸ (%) |
|---|---|---|---|---|---|
| BH(A) #1 | 3837.2 | 4.21034 | 83.0846 | 100.393 | 17.24 |
| BH(A) #2 | 3839.7 | 3.7797 | 68.5328 | 85.938 | 18.26 |
| BH(A) #3 | 3842.2 | 4.46282 | 80.9182 | 101.469 | 21.56 |
| BH(A) #4 | 3846.2 | 5.92476 | 116.9160 | 141.272 | 24.26 |
Table 3: Porosities obtained of the BH(A) core samples.
| Conventional Core Sample | Depth (m) | V (cc) ref | V (cc) grain | V (cc) bulk | ɸ (%) |
|---|---|---|---|---|---|
| NH(B) #1 | 3836 | 3.88737 | 70.4844 | 88.385 | 18.78 |
| NH(B) #2 | 3837 | 4.00328 | 72.5861 | 91.021 | 19.34 |
| NH(B) #3 | 3838 | 4.19166 | 76.00159 | 95.304 | 20.25 |
| NH(B) #4 | 3839 | 4.53320 | 82.19431 | 103.069 | 21.90 |
Table 4: Porosities obtained of the NH(B) core samples.
Air Permeability
The air permeabilities of various core samples of Bhogpara and Nahorkatiya oil field are shown in Table 5. The Kliq values are also determined by using Klinkenberg theory. With increase in depth, Kair and Kliq shows an SI. No Location Core Samples Depth Kair Kliq 1.
BH(A) # 1 3837.2 0.5128 0.09 2. BH(A) #2 3839.7 0.529813 0.29 3. BH(A) #3 3842.2 0.54779 0.39 4. BH(A) #4 3846.2 0.55984 0.45 Bhogpara increasing trend for both Bhogpara and Nahorkatiya oil field. Comparing permeability values with porosity, it shows that lower porosity corresponds to lower permeability; however it is simply a fundamental characteristic of the porous media [19].
| 5. | Nahorkatiya | NH(B) #1 | 3836 | 0.398359 | 0.05 | ||
| 6. | NH(B) #2 | 3837 | 0.558819 | 0.07 | |||
| 7. | NH(B) #3 | 3838 | 0.701428 | 0.24 | |||
| 8. | NH(B) #4 | 3839 | 0.995203 | 0.47 |
Table 5: Permeability values obtained of BH(A) and NH(B) core samples. The water-oil relative permeability curves as obtained by
Table 5: Permeability values obtained of BH(A) and NH(B) core samples. The water-oil relative permeability curves as obtained by Das et.al shows that for both BH(A) and NH(B), the cross over point of water saturation and oil saturation is more than 50% which shows that both BH(A) and NH(B) are water wet reservoirs and the water wet condition of a reservoir core is favorable for EOR processes [20].
Conclusion
The petrographic analysis and SEM analysis shows the presence of Kaolinite, Chlorite and Quartz overgrowth. The presence of Kaolinite, Chlorite and Quartz overgrowth generally causes reduction in porosity and permeability but some slides also shows the presence of microfractures which may lead to increase in porosity. In this study it was found that as depth increases in the two core samples BH(A) and NH(B), porosity and permeability increases this may be because porosity-depth relationships are consistent with petrographic results, which show that porosity in shallowly buried (<3000m), immature to marginally mature rocks was controlled by mechanical compaction and mineral cementation. This increase in porosity and permeability is a favourable condition for EOR. The earlier study also proved that both BH(A) and NH(B) are water wet reservoirs, which is again a favourable condition for EOR. BH(A) core samples are fined grained whereas NH(B) are course grained, therefore comparing both, NH(B) may have more oil recovery than BH(A) because coarse grained core samples generally have higher permeability.
References
-
David WH, John RW, Peter T, Leonardi CR (2000) Characterizing flow in oil reservoir rock using SPH: Absolute Permeability. International Journal for numerical and analytical methods in geomechanics pp: 1-24.
-
Hans-Jorg Vogel (2002) Topological Characterization of Porous Media. Mecke KR, Stoyan D (Eds.), Springer- Verlag Berlin Heidelberg, pp: 75-92.
-
Emmanuel S, Anovitz LM, Day-Stirrat RJ (2015) Effects of coupled chemo-mechanical processes on the evolution of pore-size distributions in geological media. Rev Mineral Geochem 80(1): 45-60.
-
Navarre-Sitchler AK, Cole DR, Rother G, Jin L, Buss HL, Brantley SL (2013) Porosity and surface area evolution during weathering of two igneous rocks. Geochim Cosmochim Acta 109: 400-413.
-
Royne A, Jamtveit B (2015) Pore-scale controls on reaction-Driven Fracturing. Rev Mineral Geochem 80(1): 25-44.
-
Grim RE (1958) Concept of diagenesis in argillaceous sediments. Amer Assoc Petroleum Geologists Bull 42(2): 246-253.
-
Carroll D (1970) Clay minerals, a guide to their X-ray identification. Geol Soc Amer Spec 126: 88.
-
Shalaby MR, Hakim MH, Abdullah WH (2013) Diagenesis in the Middle Jurassic Khatatba Formation sandstones in the Shoushan Basin, northern Western Desert, Egypt. Geological J.
-
Folk RL, Andrew PB, Lewis DW (1970) Detrital sedimentary rock classification and nomenclature for use in New Zealand. New Zealand J of Geology and Geophysics 13(4): 937-968.
-
Scotchman IC, Johnes, LH, Miller RS (1989) Clay diagenesis and oil migration in Brent Group sandstones of NW Hutton Field, UK North Sea. Clay Minerals 24: 339-374.
-
Strong GE (1993) Diagenesis of Triassic Sherwood Sandstone Group rocks, Preston, Lancashire, UK: a possible evaporitic cement precursor to secondary porosity. Geological Society, London, Special Publications 73: 279-289.
-
Iwuagwa CJ, Leberkmo JF (1981) The role of authigenic clay in some reservoir characteristics of the basal Belly River Sandstone, Pembina Field, Alberta. Bull. of Canadian Petroleum Geology 29(4): 479-491.
-
Vallee M (2011) Back to the Rocks: New Petrophysical Model for Siliciclastics Engaging Old Petrological Techniques. AAPG Annual Convention and Exhibition, Houston, Texas, USA, pp: 1-16.
-
Tucker ME (2009) Sedimentary Petrology: An Introduction to the Origin of Sedimentary Rocks, John Wiley & Sons, New York, pp: 59-60.
-
Lee M, Aronson JL, Savin SM (1989) Timing and conditions of Permian Rotliegend sandstone diagenesis, southern North Sea: K/Ar and oxygen isotopic data. Amer Assoc of Petroleum Geologists Bull 73(2): 195-215.
-
Torabi A, Fossen H, Braathen A (2013) Insight into petrophysical properties of deformed sandstone reservoirs. Amer Assoc of Petroleum Geologists Bull 97(4): 619-637.
-
Zhdanov VP (2009) Coarse-grained model of long- term supply of oil. J Euro Phy J B 71: 289-292.
-
Nelson PH (1994) Permeability-Porosity relationship in sedimentary rocks. The Log Analyst 35(3): 38-62.
-
Ehrenberg SN, Nadeau PH (2005) Sandstone vs. Carbonate petroleum reservoirs: A global perspective on porosity-depth and porosity-permeability relationships. AAPG Bulletin 89(4): 435-445.
-
Das BM, Gogoi SB (2015) Relating IFT with Oil Recovery with special reference to Bhogpara porous media of Upper Assam Basin. Journal of Petroleum Engineering & Technology 5(1): 1-8.
- Nigeria’s Vulnerability in the Face of Global Energy Policy
- A Simulation Study of Investigation of Optimum Oil Production Performance by Applying Various Gas Injection Methods in Oil Reservoir
- Characterization of Permo-Triassic Reservoirs through Thermal Maturity Assessment of Westphalian Source Rocks in the Cheshire Basin
- Influence of Microwax on the Rheological and Thermal Behaviour of a Wax Crude Oil
- Real-Time Monitoring and Performance Optimization of Steam Injection in Heavy Oil Reservoirs Using Fiber Optic Sensing and Integrated Predictive Simulation Models
- Rapid On-Site Determination of the Total Petroleum Hydrocarbon Content of Soils by Handheld Fourier Transform Near-Infrared Spectroscopy: Development of a Global, Site- and Scanner- Independent Calibration Model