Investigation of the Impact of Scale Inhibitors: Nonionic Surfactants for Scale Deposition Control in Oilfield
In this work two non-ionic surfactants (1-Octanol ethoxylate (OE-8.7) and Methylcyclohexanol ethoxylate (MCHE-9) were prepared by the reaction of their hydrophobs with ethylene oxide for used as a novel scale inhibitors in the oilfields. Their structures were characterized by FT-IR, 1HNMR and SEM. Evaluation of the performance of these inhibitors was investigated for CaCO3 scale. From the results, the minimum inhibitor concentration (MIC) 10 ppm for scale inhibitor MCHE-9 and 50 ppm for scale inhibitor OE-8.7. The inhibition efficiency of inhibitor MCHE-9 & EO-8.7 were 61.5% & 64.3% at inhibitor dosage of 10 ppm & 50 ppm, respectively. OE-8.7 and MCHE-9, led to modifications in the morphology of scales particles as observed by SEM. These inhibitors distorted the crystal lattice of the precipitates, thus delayed the formation of scales crystal. From the induction time study, inhibitor MCHE-9 had the longest induction time of CaCO3 precipitation. Therefore; the scale inhibitor MCHE-9 was the suitable inhibitor used technically and economically feasible to improve oilfield scale deposition.
Introduction
Scale is an inorganic precipitation or coating shaped on the surface of metal, rock, wellbore tubulars or alternative material [1, 2, 3]. The most common inorganic scales that can be found in oilfields worldwide are sulfate and carbonate scales. Sulfate and carbonate scales are formed by two different mechanisms. Sulfate scales, namely calcium Sulfate (CaSO4), Strontium Sulfate (SrSO4) and barium Sulfate (BaSO4), are formed as a result of blending of incompatible brines, specifically formation brine and injected seawater. Carbonate scales deposited due to the drop in pressure in the production wells in which discharges dissolved CO2 [4, 5, 6].
Ca 2+ (aq) +2HCO3-(aq) CaCO3 (s) + CO2 (aq) + H2O (1) Ba2+ (Sr2+, Mg2+ or Ca2+) + SO42 - BaSO4 (s) (SrSO4, MgSO4 or CaSO4) (2)
Continuous scale growth can eventually block the pores in the oil flow pathways, damage the production system and decrease productivity. Also caused decrease in permeability in the near wellbore area of a reservoir (formation damage). Both formation damage and wellbore scaling can lead to a great reduction in oil production and causing a high cost operations. This problem can cost the oil producers millions of dollars per year in productivity loss and overhaul expense [7, 8, 9, 10]. The most economical and practical process to overcome this problem is using chemical scale inhibitors. The scale inhibitors can prevent formation of carbonate and sulfate scale and polycarboxylates are of great interest in this line or to slow the nucleation and growth of the scale. In many cases, the amounts of inhibitors work at very low doses [11, 12, 13, 14, 15]. Recent thrust in scale inhibitor development is environment friendly, low molecular weight polymers, having anionic, cationic and neutral or ampholytic groups; which are stable at higher temperatures [16, 17, 18, 19, 20].
In this paper, preparation, characterization and evaluation/comparison of CaSO4, BaSO4 and SrSO4 scales inhibiting efficiency of methylcyclohexaol ethoxylate (MCHE-9) and 1-octanol ethoxylate (OE-8.7) were performed. X-ray diffraction (XRD) and electron microscopy (EMS) were used in studying the changes in crystal shape, size and morphology. In addition, the efficacy and the applicability of the inhibitors were done. Furthermore, the morphology and the particle size distribution of the resulting CaSO4, BaSO4 and SrSO4 precipitates were also comparatively examined. The understanding of scale inhibition kinetics to predict scale formation, the right use of scale inhibitor and development of scale inhibitor were presented.
Expremintal
Materials
The used materials included: 1-Octanol (>99%, Merck- Schuchardt), methylcyclohexanol (commercial grade, Labor Chemie Apolada, Germany), ethylene oxide (Eastern Company for Industrial Gases) and potassium hydroxide (Aldrich), 0.45-mm filter paper, Deionized water, EDTA, CaCL2, MgCL2, BaCL2, NaCL, KCL, NaHCO3, Na2SO4, SrCL2.
Instruments
Several characterization techniques were employed in order to identify the changes in clay: Fourier X'Pert PRO PANalytical transform infrared spectroscopic (FTIR) Hosny R, et al. Investigation of the Impact of Scale Inhibitors: Nonionic Surfactants for Scale Deposition Control in Oilfield. Pet Petro Chem Eng J 2019, 3(2): 000189.
measurements were performed using Nicolet IS-10 FTIR over the wave number 4000-400 cm-1. The crystalline phases of the different samples were investigated using Powder X-ray diffraction. XRD patterns of the samples were analyzed at room temperature using Corporation, Netherlands diffractometer with Cu Ka radiation in the 2θ range (5-80°) at a scanning rate of 0.05 S -1. The standard diffraction data was identified according to the International Center for Diffraction Data (ICDD) software with PDF-4 release 2011 database.
Preparation of Brines
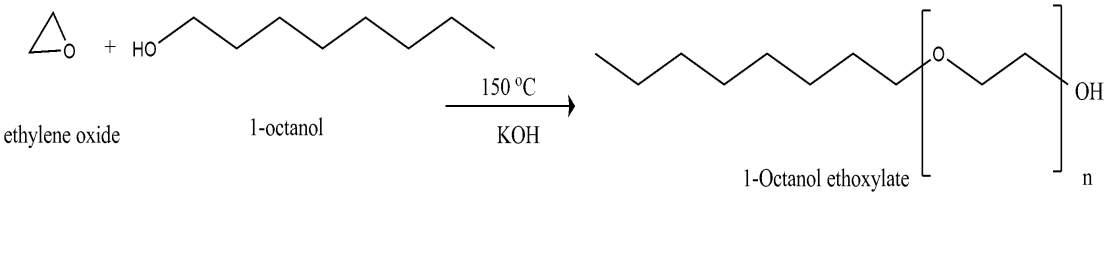
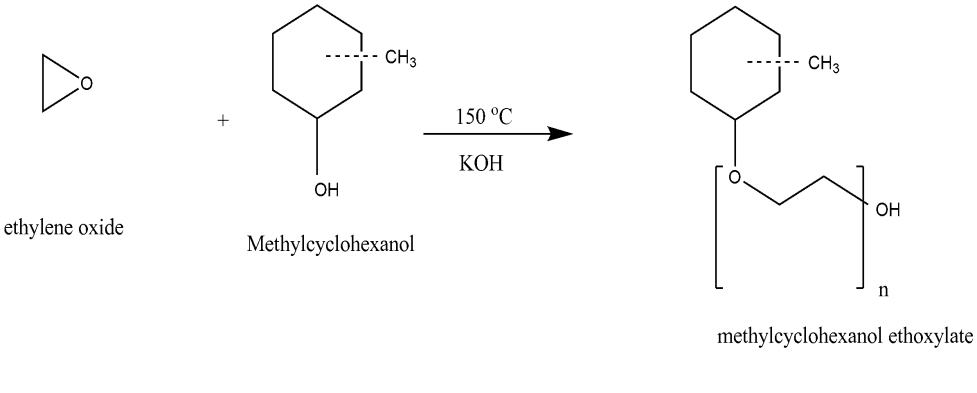
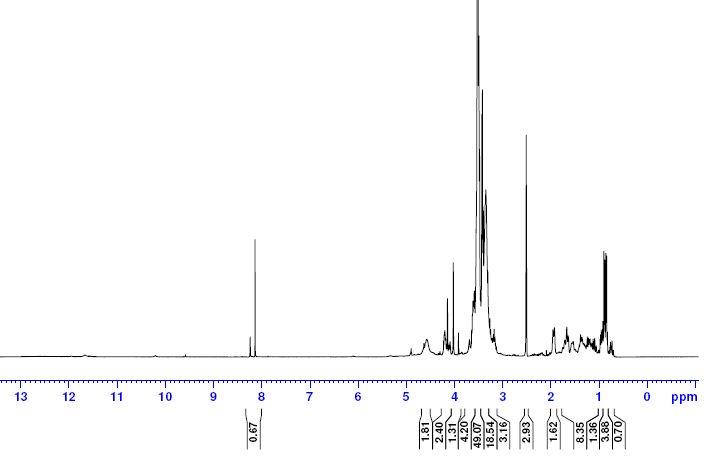
Synthetic formation water and water injection (Barton and Angsi seawaters) were made up according to the analyses in Table 1. Brines were prepared for each run by dissolving the salts in deionized water. Therefore, the formation water and seawater were filtered through a 0.45-mm filter paper before using in order to remove any particulate material. Inhibitor solutions were prepared by dissolving inhibitors in seawater. Four salts used for the preparation of synthetic formation water and injection water were computed based on the ionic compositions given in Table 2. Synthesis of Scale Inihibitors The ethoxylation of the two aliphatic alcohols were carried out using a lab scale ethoxylation unit which is connected to a bubbler of gaseous ethylene oxide and a mercury manometer to control the amount of the ethylene oxide gas passes through the reaactor. The reaction was oxygen free by passing nitrogen gas before starting the reaction for product safety requirements. The nonionic surfactants were prepared by reacting gaseous ethylene oxide with the alcohol at 150 °C using KOH catalyst in the reactor and a flow of N2 gas was passed through reactants for about 5 min to exclude the ambient oxygen. The N2 stream was changed to ethylene oxide which was kept at a rate not exceeding its rate of consumption by observing the pressure of the gas inside the reaction vessel through the mercury manometer [21]. At the end of the reaction, the flow of ethylene oxide gas was replaced with N2 stream to purge out the unreacted ethylene oxide. The progress of the reaction was identified by checking the increase in weight of the reaction mixture. The obtained ethoxylated alcohol was purified from the byproduct polyethyleneglycol formed by weibull method [22]. The product was characterized by FT-IR and the average number (n) of ethylene oxide (EO) units, was determined through 1HNMR. These procedures are represented in Figures 1 & 2.
Copyright© Hosny R, et al.
The prepared, 1-octanol ethoxylate and methylcyclohexanol ethoxylate nonionic surfactants were designated by OE-8.7 and MCHE-9 respectively where the number at the end represents the average number of EO units condensed per one molecule of the alcohol.
Hosny R, et al. Investigation of the Impact of Scale Inhibitors: Nonionic Surfactants for Scale Deposition Control in Oilfield. Pet Petro Chem Eng J 2019, 3(2): 000189.
φ=ρ_1(Ca2+)ρ2(Ca2+)ρ0(Ca2+)ρ_2(Ca2+) Equation (1) ρ0(Ca2+) was the total concentrations of Ca2+(mg/L), ρ1(Ca2+) was the concentrations of Ca2+(mg/L) in the presence of the 1-Octanol ethoxylate (OE-8.7) and Methylcyclohexanol ethoxylate (MCHE-9), ρ2(Ca2+) was the concentrations of Ca2+(mg/L) in the absence of the 1- Octanol ethoxylate (OE-8.7) and Methylcyclohexanol ethoxylate (MCHE-9).
Jar Test
The aim of this study was to determine efficiency of scale inhibitor in preventing BaSO4 oil field scales forming due to mixing of synthetic brines (formation water and seawater) at high concentration of barium at various temperatures (50–95 °C). The experimental procedures used to determine the efficiency of scale inhibitor are as follows: 1. For each experiment of carbonate oil field scales, the two brine solutions, 100 ml of seawater containing Copyright© Hosny R, et al.
inhibitor and 100 ml of formation water were put in clean glass bottles [23]. The bottles were then covered and retained inside the oven and were heated to the required temperature for 1 h. 2. After 1 h, the bottles were removed from the oven, and seawater was added to formation water and shaken strongly by hand for 60 s and then retained back in the oven. The mixture was left undisturbed for 4 h. After this the mixture was removed from the oven and then was immediately filtered through a 0.45-mm filter paper. 3. The crystals on the filter paper were dried in a humidity oven, and the weight of dried crystal sample was measured by Electronic Top Pan Balance.
Inhibitor Efficiency Evaluation
The inhibition performance of CaCO3 scale using the two inhibitors of 1-Octanol ethoxylate (OE-8.7) and Methylcyclohexanol ethoxylate (MCHE-9) were tested according to the China National Standard (GB/T16632- 2008), the static evaluation test for qualifying scale inhibiting properties of the inhibitor was conducted. The concentrations of Ca2+ in the formation water were 1908.25 mg/L, while in the injection water 1503.93 respectively mg/L. The waters with different quantity of the inhibitors were kept in a volumetric flask. The pH of the solutions was adjusted to 6.8 with borax buffer solution. Then, the configured brines were kept at 80 °C for 10 h in a thermostat water bath. After that, they were cooled to room temperature and filtered by a filter film. The test of the mass concentration of Ca2+ ion was also followed the method specified by the standard TM0374- 2007 and SY/T 5673-1993. Inhibitor efficiency (η) was calculated based on remaining Ca2+ ion in solution according to the following equation (2).
− = c c
2 1 100% 0 1 X c c η
Equation (2)
− Where C2 was the concentration of Ca2+ ion after inhibitor functions, C1 was the concentration of Ca2+ ion in the brines of which 50 mL deionized water without anions was added in the third step, C0 was the mass concentration of Ca2+ ion of the solution with no inhibitor [24].
Results and Discussion
Characterization of the Prepared Inhibitors
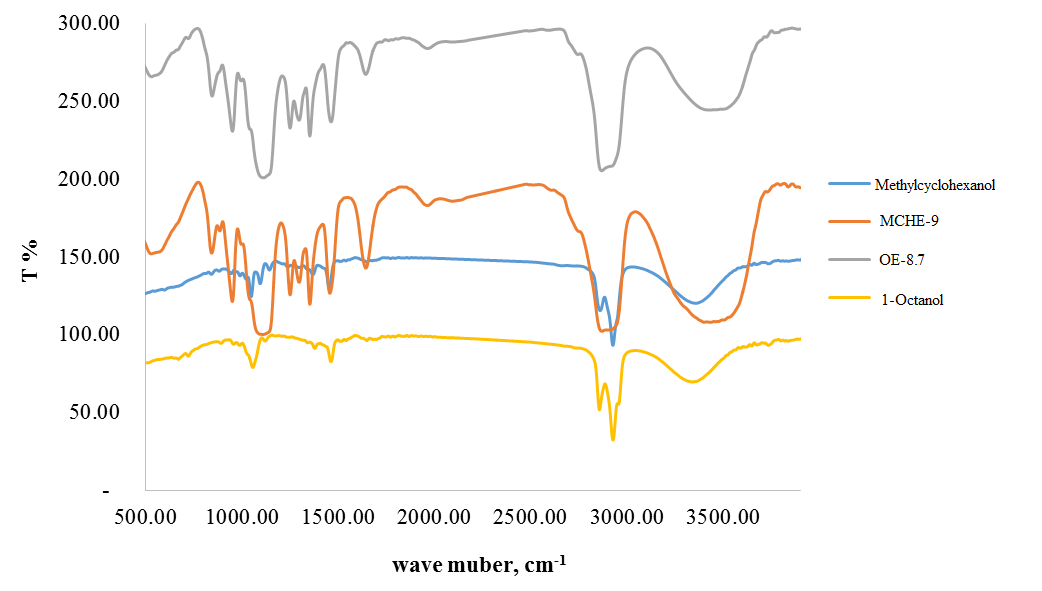
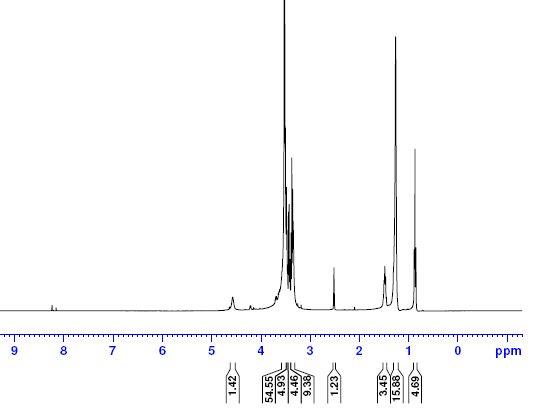
The characterization of the prepared inhibitors has been done using FT-IR and 1HNMR. The results obtained are given in Figures (3,4 & 5).
Hosny R, et al. Investigation of the Impact of Scale Inhibitors: Nonionic Surfactants for Scale Deposition Control in Oilfield. Pet Petro Chem Eng J 2019, 3(2): 000189.
Copyright© Hosny R, et al.
Analysis of Water
The extended analysis for formation and injection water sample is given in Tables 1 & 2. From these analysis the interest anions are sulfate, and chloride which can be Hosny R, et al. Investigation of the Impact of Scale Inhibitors: Nonionic Surfactants for Scale Deposition Control in Oilfield. Pet Petro Chem Eng J 2019, 3(2): 000189.
measured experimentally according to ASTM D4327 by ion chromatography (IC) in a single run Dionex IC model DX 600 equipped with high capacity columns. Alkaline species (CO3-, OH-, and HCO3-) were determined according to ASDTM D3875 instrument calculations were done using Alkalinity calculator ver.2.10 (USGS). The total dissolved solids (TDS) and pH were determined experimentally according to ASTM D-1888 and ASTM D1293 Salinity value was calculated upon chloride content value.
Copyright© Hosny R, et al.
| Total Dissolved Solids | 67874.3 mg/l | pH | 6.7 @ 25 oC | ||
|---|---|---|---|---|---|
| Salinity | 62129.1 mg/l | Density | 1.05679 g/ml @ 60 F | ||
| Hardness | 16540.1mg/l | ||||
| Constituents | mg/L | Constituents | mg/L | ||
| Lithium | 0.17 | Chloride | 37654.00 | ||
| Sodium | 19208.00 | Bicarbonate | 36.6 | ||
| Potassium | 518.80 | Sulfate | 5650.00 | ||
| Magnesium | 2859.44 | Iron | 1.18 | ||
| Calcium | 1908.25 | Cupper | 0.12 | ||
| Barium | 18.25 | Strontium | 19.49 |
Table 1: Extended analysis for formation water sample.
| Total Dissolved Solids | 40089.4 mg/l | pH | 6.88 @ 25 oC | ||
|---|---|---|---|---|---|
| Salinity | 37207.5 mg/l | Density | 1.03496 g/ml @ 60 F | ||
| Hardness | 9980.2 mg/l | ||||
| Constituents | mg/L | Constituents | mg/L | ||
| Lithium | 0.86 | Chloride | 22550.00 | ||
| Sodium | 11180.16 | Bicarbonate | 36.6 | ||
| Potassium | 345.87 | Sulfate | 2801.00 | ||
| Magnesium | 1511.64 | Iron | 1.92 | ||
| Calcium | 1503.93 | Cupper | 0.07 | ||
| Barium | 51.66 | Strontium | 105.70 |
Table 2: Extended analysis for injection water sample.
Jar Tests
Maximum Scale Mass in Bench Study: Figure 6 shows the maximum scale mass formed (mg) of mixing water (formation: injection). The maximum scale mass formed (291.2 ppm at 40% formation water) was observed to be increased with increasing the percent of injection water. The higher the solids precipitate, the higher was sulfate of selected ions. This indicates that, at greater solid
0 50 100 150 200 250 300 350
$$ \mathrm {E} = \frac {1}{2} \mathrm {A} ^ {2} + \mathrm {B} ^ {2} $$
$$ \square $$ $$ \mathrm {E} = \mathrm {E} _ {1} + \mathrm {E} _ {2} + \dots + \mathrm {E} _ {n} $$ $$ \square $$ $$ \mathrm {E} = \frac {1}{2} \mathrm {A} ^ {2} + \mathrm {B} ^ {2} $$ $$ \square $$ ppm
0 20 40 60 80 100 120
% of Formation Water
precipitation shows the edge–face contact between particles involved greater interparticle interactions leading to an increase in both precipitation of selected ions. We can concluded that the two waters are incompatible and lead to formation of permenant scales with different amount according to different ratios of mixing waters [25].
$$ \mathrm {E} = \mathrm {E} _ {1} + \mathrm {E} _ {2} + \dots + \mathrm {E} _ {n} $$ $$ \square $$ $$ \mathrm {E} = \frac {1}{2} \mathrm {A} ^ {2} + \mathrm {B} ^ {2} $$ $$ \square $$ Figure 6: Maximum scale mass formed (mg) verses mixing water (formation: injection).
Hosny R, et al. Investigation of the Impact of Scale Inhibitors: Nonionic Surfactants for Scale Deposition Control in Oilfield. Pet Petro Chem Eng J 2019, 3(2): 000189.
Copyright© Hosny R, et al.
Maximum Scale Formed with Inhibitors
To determine the minimum amount scale formed of the two scale inhibitors (MCHE-9 & OE-8.7), each tested sample was measured with precipitation weight two or three times, and the arithmetic mean was calculated as shown in Figures 7 & 8. The scale inhibitor was completely compatible with the formation and injection waters. From the obtained data, the inhibitor concentration in ppm was plotted on the horizontal axis, and the magnitude of its corresponding maximum amount scale formed mg/l on the vertical axis as shown in figures (7&8). In these curves, the minimum amount of scale formed for scale inhibitor MCHE-9 and OE-8.7 are 159.8 and 147.9 mg/l at inhibitor concentration 10 and 50 ppm, respectively.
Effeciency of the Prepared Scale Inhibitors
The calcium carbonate scale inhibition performance of MCHE-9 (Mwt = 510 g/mole) and OE-8.7 (Mwt = 514.8 g/mole) was shown in Figures 9 & 10. The inhibition effeciency of inhibitor MCHE-9 was 61.5% at 10 ppm. Figure 9. With respect to inhibitor OE-8.7, it was clear that inhibition efficiency gradually increases with the increase in the concentration of inhibitor Figure 10 and exhibits the best inhibition performance, which was as high as 64.3% in the concentration of 50 ppm. These results indicate that the capacity of the interaction between hydroxyl groups with Ca2+ was stronger than that between ether groups with Ca2+. It may be illustrated that the oxygen atom within the hydroxyl cluster reacts with water molecule to make H bonds, rising the solubility of the size organic part of prepared scale inhibitors and also the chelate impact between it and calcium ion. Besides, the oxygen atom within the hydroxyle cluster will sorb on the surface of carbonate crystal and stop its growth; the same effect was predicted for the ether group with weaker interaction than that of hydroxyl group. Its value mentioning that the effectiveness of the prepared inhibitors depends on the sort of functional groups in its molecular structure.
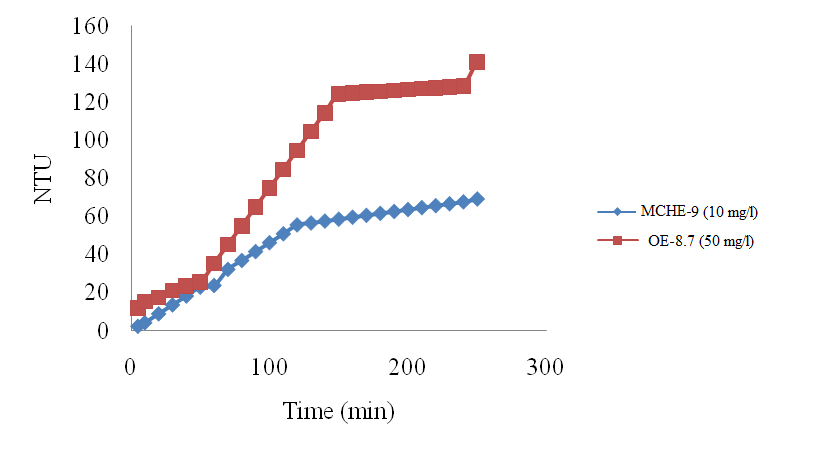
Effect of the Scale Inhibitor on Induction Time of Scale Formation
We can say that the induction time is the amount from the start till the salt is deposited. Figure 11 illustrates the curves of (NTU) before and when the inhibition treatment of the calcium carbonates solution with time. In this curve, for inhibitor MCHE-9 (intial concentration = 10 mg/l @ 25oC) turbidity measerment was slightly increase till the first 60 mins followed by fast increasing in the turbidity of the solution till 160 mins constant with time till inorganic salt is created and reach to the equlibirium state. With respect to inhibitor OE-8.7 (50 mg/l initial concentration @25oC) turbidity measerment was slightly increase till the first 80 mins followed by slower increasing in the turbidity of the solution till 120 mins after that the scale amount become constant with time till inorganic salt is created and reach to the equlibirium state. As shown in the figure, inhibitor MCHE-9 longest induction time of CaCO3 precipitation within the time of study.
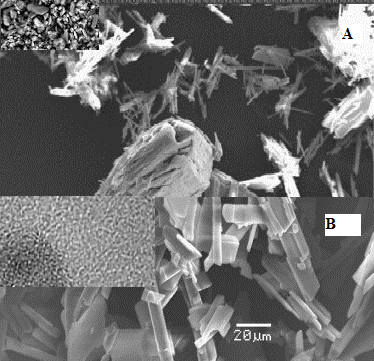
SEM of the Formed Scale
The scaled samples were examined by SEM to observe the particle size and morphology of the precipitates in the absence and presence of the two scale inhibitors. Figure 12 shows the formation of CaCO3 scale during flow of injection and formation waters has been observed by Scanning Electron Microscopy (SEM) micrographs which show CaCO3 crystals formation. The maximum size of CaCO3 crystals precipitated from mixed brines was about 5 µm in the worst mixing ratios. Figure 13 presents the SEM image of CaCO3 precipitate at 10 ppm of MCHE-9 and 50 ppm of OE-8.7. For these images, the morphology of the crystals is very different from either of the non- inhibited solutions. From the SEM images, it can be Hosny R, et al. Investigation of the Impact of Scale Inhibitors: Nonionic Surfactants for Scale Deposition Control in Oilfield. Pet Petro Chem Eng J 2019, 3(2): 000189.
observed that in the absence of inhibitor Figure 12, the CaCO3 crystals exhibited a lot of large regular crystals. In the presence of MCHE-9 inhibitor, the CaCO3 crystals are less, small and brittle with random distribution in the solution also the crystal aggregate was become unclear compared with in the absence of inhibitor as shown in Figure 13. A small crystal of calcium with huge defects and irregular structure was observed in the presence of the OE-8.7 scale inhibitor as shown in the top left image in Figure 13 (A&B). In General, a difference in morphology between the CaCO3 precipitate was observed in the presence of inhibitor especially in case of inhibitor MCHE- 9.
In case of the presence of inhibitor OE-8.7, CaCO3 crysatl was become more amorphous and the formed crystal unstable and having mulicrystal forms compared with the other inhibitor.
Copyright© Hosny R, et al.
Scale Inhibitor Mechanism
To mitigate the problem of mineral scaling, chemicals and scale inhibitors are widely used. With antiscalant addition, scale inhibition occurs by disrupting one or more aspects of the crystallization process. Generally MCHE-9 and OE-8.7 scale inhibitors do not eliminate the scaling constituents or its tendency; instead they delay the onset crystallization (nucleation phase of crystallization) and we found that they retard the growth of mineral salt crystals (growth phase of crystallization). These scale inhibitors control mineral scale through mainly one scale inhibitors mechanism that is scale inhibitors could keep more scale-forming positive ion (e.g., Ca2+) in the solution from being precipitated through complexation action. There is another suggested mechanism that pridected from SEM morphology where the scale inhibitors could interact with mineral nuclei to disrupt the crystallization process and keep the crystal particles dispersed in the aqueous suspension, rendering them less prone to sedimentation or adhesion onto the equipment surfaces.
Conclusion
1. In this study, new two inhibitors (OE-8.7 and MCHE-9)
were prepared to prevent or delay the scale formation. 2. Evaluation of the performance of these scale inhibitors was investigated for CaCO3 scale. 3. The inhibition efficiency of inhibitor MCHE-9 & EO-8.7 were 61.5% & 64.3% at inhibitor dosage of 10 ppm & 50 ppm, respectively. 4. The scale inhibitor MCHE-9 is a technically and economically appropriate inhibitor to improve the scale deposition of oilfields.
References
-
Hosny R, Desouky SEM, Ramzi M, Abdel-Moghny Th, El-Dars FMS, et al. (2009) Estimation of the Scale Deposits Near Wellbore via Software in the Presence of Inhibitors. Journal of Dispersion Science and Technology 30(2): 204-212.
-
Hosny R, Desouky SEM, Ramzi M, Abdel-Moghny TH, El-Dars FMS, et al. (2007) Novel scalechem program for monitoring and enhancing dissolution of scale deposits near wellbore. Material Science Research India 4(2): 251-261. Hosny R, et al. Investigation of the Impact of Scale Inhibitors: Nonionic Surfactants for Scale Deposition Control in Oilfield. Pet Petro Chem Eng J 2019, 3(2): 000189.
-
Al-Tammar JI, Bonis M, Choi HJ, Salim Y (2014) Saudi Aramco downhole corrosion/scaling operational experience and challenges in HPHT gas condensate producers. SPE international oilfield corrosion conference and exhibition, Aberdeen, Scotland.
-
Chen T, Neville A, Yuan M (2005) Calcium carbonate scale formation-assessing the initial stages of precipitation and deposition. J Pet Sci Eng 46(3): 185- 194.
-
Bezerra MCM, Rosario FF, Rosa KRSA (2013) Scale management in deep and ultradeep water fields. Offshore Technology Conference, Brazil.
-
Awan MA, Al-Khaledi SM (2014) Chemical treatments practices and philosophies in oilfields. SPE international oilfield corrosion conference and exhibition, Aberdeen, Scotland.
-
Ramzi M, Hosny R, El-sayed M, Fathy M, Abdel Moghny Th (2016) Evaluation of scale inhibitors performance under simulated flowing field conditions using dynamic tube blocking test. Int J Chem Sci 14(1): 16-28.
-
Demadis KD, Stathoulopoulou A, Ketsetzi A (2007) Inhibition and control of colloidal silica: can chemical additives untie the “Gordian Knot” of scale formation?. Corrosion 2007, Nashville, Tennessee.
-
Dawe RA, Zhang Y (1997) Kinetics of calcium carbonate scaling using observations from glass micromodels. J Pet Sci Eng 18(3–4): 179-187.
-
Chen T, Chen P, Montgomerie H, Hagen T, Heath S, et al. (2013) Scale squeeze treatments in short perforation and high water production ESP wells- application of oilfield scale management toolbox. International petroleum technology conference, Beijing, China.
-
Kelland MA (2011) Effect of various cations on the formation of calcium carbonate and barium sulfate scale with and without scale inhibitors. Ind Eng Chem Res 50(9): 5852-5861.
-
Garcia AV, Thomsen K, Stenby EH (2006) Prediction of mineral scale formation in geothermal and oilfield operations using the Extended UNIQUAC model: Part II. Carbonate-scaling minerals. Geothermics 35(3): 239-284. Copyright© Hosny R, et al.
-
Fan C, Kan AT, Zhang P, Lu H, Work S, et al. (2012) Scale prediction and inhibition for oil and gas production at high temperature/high pressure. SPE J 17(2): 379-392.
-
El-Said M, Ramzi M, Abdel-Moghny T (2009) Analysis of oilfield waters by ion chromatography to determine the composition of scale deposition. Desalination 249(2): 748-756.
-
Drela I, Falewicz P, Kuczkowska S (1998) New rapid test for evaluation of scale inhibitors. Water Res 32(10): 3188-3191.
-
MacAdam J, Parsons SA (2004) Calcium carbonate scale formation and control. Rev Environ Sci Bio/Technol 3(2):159-169.
-
Levanyuk OV, Overin AM, Sadykov A, Parkhonyuk S, Lungwitz BR, et al. (2012) A 3-year results of application a combined scale inhibition and hydraulic fracturing treatments using a novel hydraulic fracturing fluid, Russia. SPE international conference on oilfield scale, Aberdeen, Scotland.
-
Lakshmi DS, Senthilmurugan B, Drioli E, Figoli A, et al. (2013) Application of ionic liquid polymeric microsphere in oil field scale control process. J Pet Sci Eng 112: 69-77.
-
Kumar T, Vishwanatham S, Kundu SS (2010) A laboratory study on pteroyl-l-glutamic acid as a scale prevention inhibitor of calcium carbonate in aqueous Hosny R, et al. Investigation of the Impact of Scale Inhibitors: Nonionic Surfactants for Scale Deposition Control in Oilfield. Pet Petro Chem Eng J 2019, 3(2): 000189. solution of synthetic produced water. J Pet Sci Eng 71(1-2): 1-7.
-
Khormali A, Petrakov D (2014) Scale inhibition and its effects on the demulsification and corrosion inhibition. IJPGE 2(1): 22-33.
-
Barakat Y, Mead AI, Ibrahim V (2010) Surfactants with Natural Hydrophobic Tails Polyoxyethylenated Cholesterol-Surface Tension and CMC. Journal of applied science research 6(8): 1273-1290.
-
Longman GF (1976) The Analysis of Detergents and Detergent Products, John Wiley and Sons, London.
-
Ostroff AG (1967) Comparison of some formation water classification systems. AAPG Bull 51(3): 404- 416.
-
Poynton N, Miller A, Konyukhov D, Leontieff A, Ganiev L, et al. (2008) Squeezing scale inhibitors to protect electric submersible pumps in highly fractured, calcium carbonate scaling reservoirs. SPE Russian Oil and Gas Technical Conference and Exhibition, Moscow, Russia.
-
Tortolano C, Chen T, Chen P, Montgomerie H, Hagen T, et al. (2014) Mechanisms, new test methodology and environmentally acceptable inhibitors for co- deposition of zinc sulfide and calcium carbonate scales for high temperature application. SPE International Oilfield Scale Conference and Exhibition, Aberdeen, Scotland. Copyright© Hosny R, et al.
- Nigeria’s Vulnerability in the Face of Global Energy Policy
- A Simulation Study of Investigation of Optimum Oil Production Performance by Applying Various Gas Injection Methods in Oil Reservoir
- Characterization of Permo-Triassic Reservoirs through Thermal Maturity Assessment of Westphalian Source Rocks in the Cheshire Basin
- Influence of Microwax on the Rheological and Thermal Behaviour of a Wax Crude Oil
- Real-Time Monitoring and Performance Optimization of Steam Injection in Heavy Oil Reservoirs Using Fiber Optic Sensing and Integrated Predictive Simulation Models
- Rapid On-Site Determination of the Total Petroleum Hydrocarbon Content of Soils by Handheld Fourier Transform Near-Infrared Spectroscopy: Development of a Global, Site- and Scanner- Independent Calibration Model