Octane Index, A Feasible Performance Indicator of Motor Gasoline
Determination of the octane number of motor gasoline is a costly and time-consuming procedure that requires the use of a testing engine that may not be available in small or out-of-the-way laboratories. orrelations between the octane number of motor gasoline and its physical and chemical properties were used to derive simple and applicable equations for the calculation of an octane index using gasoline properties that are easily and routinely measured. The gasoline properties considered include its density, boiling points, characterization factor and its cyclic compounds content.
Introduction
A great many products are produced from petroleum. Such products may have widely different properties and performance characteristics which are not always easy to specify and control. Good specifications must ensure high quality without being too stringent. The prime quality criterion for petroleum products is their reliable performance in engines or appliances for which they are prepared. Standard procedures for testing the performance of different products have been set by different organisations.
Octane number is one of the most important performance characteristics of motor gasoline. It is in general an indicator of the combustion characteristics of gasoline and of the maximum compression ratio that can be safely used in spark-ignition engines without knocking. While increasing the compression ratio improves engine efficiency, it increases at the same time the probability of knocking, which increases in turn the required octane number of gasoline.
For this reason, several alternative methods for the determination of a knocking index of motor fuels have been proposed over the years but have not so far been generally accepted or approved. Such methods include FTIR and near infrared on-line analyzers (ASTM D-2885). Other possible methods for the calculation of octane numbers are based on chromatographic or spectrometric analyses, Knock-limited spark advance (KLSA) or NMR data. All such methods, however, are just as costly and time-consuming as the laboratory methods generally used for the determination of octane numbers.
The objective of this work is to define an octane index that is a better indicator of the knocking characteristics of the fuel and which can at the same time be easily and accurately calculated from other gasoline properties that are easily and routinely measured in even small or out-of- the-way laboratories. The calculation of an octane index is equally useful when the fuel sample is too small to allow determination of its octane number, and when the expected octane number of a blend is required before the actual blending, as commercially-available motor gasoline is in most cases a blend of different products of different characteristics and properties which are produced in different units in the petroleum refinery such as topping, reforming and cracking units.
The gasoline properties that have been considered for the calculation of an octane index can be either physical or chemical properties, which can be considered separately or in combination.
Correlation Between the Octane Number of Motor Gasoline and its Physical Properties
Single Properties
The most important single properties of gasoline that can be accurately correlated with its octane number are its density and boiling points.
Of all properties of gasoline, its density is probably the easiest to measure. Its measurement, on the other hand, is carried out on a routine basis. A simple significant correlation between the density and the octane number is to be expected, given that a direct relationship between the density and aromatic content of gasoline is indicated on the one hand (Figure 1)[1], and a direct relationship exists on the other hand between the aromatic content of gasoline and its octane number. A significant correlation was in fact found between the Research Octane number of unleaded motor gasoline and its specific gravity using a computer-run regression analysis. A correlation equation was derived with a correlation factor not exceeding 0.52 and an average error not less than 1.9% [2].
![Figure 1: The relationship between the specific gravity and aromatics in a series of motor gasolines [1].](/fulltextimages/4071/fig_1.jpeg)
Work done on the correlation between the research octane number and its boiling points demonstrates significant correlation between the octane number and the 90% boiling point in particular. The equation derived, however, based on the 90% boiling point is not simple and the mean difference between the measured and calculated octane numbers is of the order of 1.6, a difference that is higher than what is normally acceptable [3].
Combined Properties
The correlation between the octane number and a single physical property can be significant but is not in general sufficient for the accurate determination of an octane index. Hence several properties were considered in combination, or an index that is based on a number of such properties such as the Watson Characterization Factor. Better and more significant correlations would in this case be expected. Characterization Factor: The Watson characterization factor is an index generally used for the classification of petroleum oils. It is defined by the following equation:
√ Where: K = the characterization factor d = the relative density at 15.6°C T = the average molar boiling point (Kelvin).
A significant relationship was found between the research octane number and the characterization factor of unleaded motor gasoline. This relationship was evident in particular in the case of motor gasoline with higher octane numbers and lower characterization factors and hence gasoline with higher aromatic and naphthenic contents. The following equation was derived for the calculation of the octane index (OI) on the basis of this relationship:
The difference between the research Octane Number and the octane index as calculated applying this equation was not more than 1, which is an acceptable value although it is slightly higher than the reproducibility value as given for the octane number which is 0.7 (ASTM D-2699). Furthermore, this equation applies only in a rather small range of characterization factors (between 11.0 and 11.5) [4].
Copyright© Al-Haj Ibrahim H.
Characterization Factor and 90% Boiling Point: In order to investigate the relationship between the octane index and the Characterization Factor and 90% boiling point, samples of Syrian and European (Octel) [5] gasoline and platformate from the refineries of Homs and Banias were used, in addition to other types of gasoline. The gasoline samples were divided into three groups:
- Samples of European gasoline (350 samples).
- Samples of Syrian gasoline and platformate (520 samples).
- Samples of Syrian and European gasoline and other samples (860 samples).
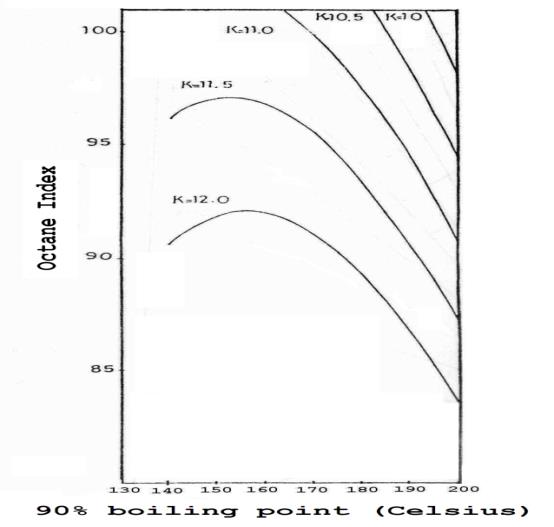
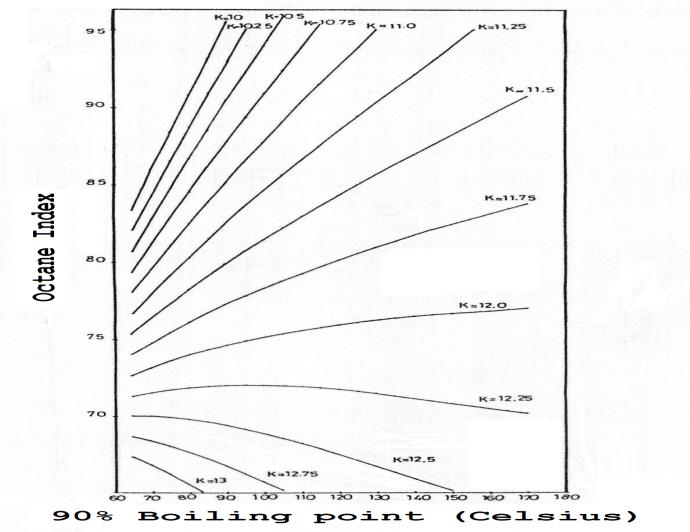
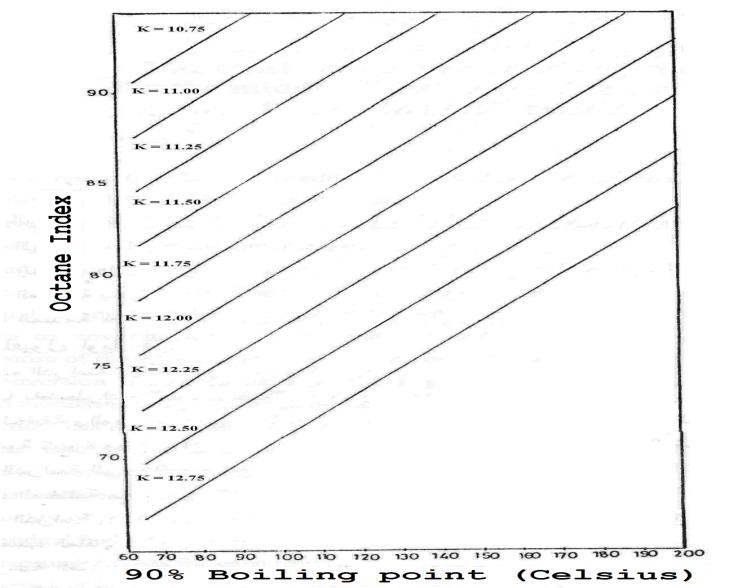
In this study, the least square method was used in conjunction with a computer programme for the study of correlations between several variables [6, 7]. The resultant equations for the calculation of the octane index for each of the three groups of gasoline are given in Table 1 and Figures 2-4. Of the equations thus derived, the second equation derived for the different types of Syrian gasoline gave better results with a correlation index of 0.96 and an error of 1.6% (or about an octane number of 1.3), where the average octane number was 82.8. This equation is:
Where: OI = Octane Index K = Characterization Factor, where t90% = 90% boiling point (°C), where This equation was tested on different gasoline samples with different characterization factors. These samples were divided into three groups as follows:
- Naphthenic oils with characterization factor in the range 10.9-11.3 (Table 2). Agreement between the calculated octane index and the measured research octane number was good and the difference being less than 0.7 in 13 out of 19 samples (or 68 %). In one sample only, the difference was greater than 1 (or 5 %).
- Mixed-base oils with characterization factor in the range 11.4-12.1 (Table 3).
Agreement between the calculated octane index and the measured research octane number was not good in this case. In only 9 samples out of 42 (or 21 %) was the difference between the calculated octane index and the measured research octane number less than 0.
12.5-12.6 (Table 4). In one sample only out of 9 samples (or 11 %), was the difference less than 1.
This demonstrates that the derived equation may be applied only in the case of naphthenic oils with characterization factor in the range 10.5-11.4, but it may not be applied in the case of mixed- or paraffinic-based oils with lower cyclic compounds content and lower octane numbers. Since most commercial oils, however, are in fact naphthenic-based with higher octane numbers, the derived equation may be safely and accurately applied for the estimation of their octane index.
| 90 % | |||||||||||||||||||||||
|---|---|---|---|---|---|---|---|---|---|---|---|---|---|---|---|---|---|---|---|---|---|---|---|
| S | No. of | s | Octan | e | Characterization | C | orrelatio | n | E | rro | r | ||||||||||||
| G | asoline Sample | s | Boiling | Derived Equation | |||||||||||||||||||
| ample | No. | Factor | Factor | (%) | |||||||||||||||||||
| Point | |||||||||||||||||||||||
| Samples of European gasoline | 350 | 90-100 | 138-200 | 10.5-12.0 | OI345.24061.552964 K 0.8727042 t 1762. 28 K/t 90% 90% Figure 2 | 0.69 | 2.2 | ||||||||||||||||
| Samples of Syrian gasoline and platformate | 520 | 65-100 | 65-160 | 10.0-12.8 | OI29. 34929. 098076 K2. 554884 t 90% 0. 2129467 K t 38.82359 K/t 90% 90% Figure 3 | 0.96 | 1.6 | ||||||||||||||||
| Samples of Syrian and European gasoline and other samples | 860 | 65-100 | 65-200 | 10.0-12.8 | OI 211.098411.96977 K0.1268662 t 90% Figure 3 | 0.84 | 2.7 |
Table 1: Derived equations for the calculation of the octane index for each of the three groups of gasoline.
Copyright© Al-Haj Ibrahim H.
| Characterization Factor | 90% Boiling Point (°C) | Research Octane No. | Octane Index | Difference | ||||||||||
|---|---|---|---|---|---|---|---|---|---|---|---|---|---|---|
| 10.96 | 145 | 99.5 | 99.5 | 0.0 | ||||||||||
| 11.07 | 148 | 98.3 | 97.7 | 0.6 | ||||||||||
| 11.18 | 157 | 96.0 | 97.0 | 1.0 | ||||||||||
| 11.19 | 155 | 95.5 | 96.3 | 0.8 | ||||||||||
| 11.19 | 153 | 96.2 | 95.9 | 0.3 | ||||||||||
| 11.20 | 157 | 96.1 | 96.5 | 0.4 | ||||||||||
| 11.21 | 154 | 95.2 | 95.7 | 0.5 | ||||||||||
| 11.22 | 142 | 93.5 | 93.2 | 0.3 | ||||||||||
| 11.25 | 156 | 94.7 | 95.1 | 0.4 | ||||||||||
| 11.25 | 158 | 94.4 | 95.4 | 1.0 | ||||||||||
| 11.26 | 152 | 93.3 | 94.1 | 0.8 | ||||||||||
| 11.27 | 153 | 94.0 | 94.0 | 0.0 | ||||||||||
| 11.29 | 153 | 93.6 | 93.6 | 0.0 | ||||||||||
| 11.29 | 151 | 93.2 | 93.2 | 0.0 | ||||||||||
| 11.30 | 156 | 94.3 | 93.8 | 0.5 | ||||||||||
| 11.30 | 151 | 92.9 | 93.0 | 0.1 | ||||||||||
| 11.31 | 156 | 94.6 | 93.6 | 1.0 | ||||||||||
| 11.32 | 152 | 92.7 | 92.7 | 0.0 | ||||||||||
| 11.32 | 142 | 89.3 | 90.8 | 1.5 |
Table 2: Comparison between Research Octane Number and calculated Octane index for naphthenic oils.
| Characterization Factor | 90% Boiling point (°C) | Research Octane No. | Octane Index | Difference | ||||||||||
|---|---|---|---|---|---|---|---|---|---|---|---|---|---|---|
| 11.43 | 153 | 87.8 | 90.2 | 2.4 | ||||||||||
| 11.45 | 152 | 87.5 | 89.6 | 2.1 | ||||||||||
| 11.46 | 150 | 89.2 | 89.1 | 0.1 | ||||||||||
| 11.47 | 149 | 90.5 | 88.8 | 1.7 | ||||||||||
| 11.48 | 151 | 89.3 | 88.8 | 0.5 | ||||||||||
| 11.48 | 147 | 85.8 | 88.3 | 2.5 | ||||||||||
| 11.49 | 164 | 90.0 | 90.2 | 0.2 | ||||||||||
| 11.49 | 153 | 90.6 | 88.8 | 1.8 | ||||||||||
| 11.49 | 153 | 88.8 | 88.8 | 0.0 | ||||||||||
| 11.49 | 155 | 90.8 | 89.1 | 1.7 | ||||||||||
| 11.50 | 147 | 84.9 | 87.8 | 2.9 | ||||||||||
| 11.52 | 147 | 88.6 | 87.4 | 1.2 | ||||||||||
| 11.59 | 152 | 85.8 | 86.3 | 0.5 | ||||||||||
| 11.59 | 155 | 84.4 | 86.7 | 2.3 | ||||||||||
| 11.59 | 156 | 86.7 | 86.7 | 0.1 | ||||||||||
| 11.63 | 152 | 85.5 | 85.4 | 1.1 | ||||||||||
| 11.64 | 147 | 83.4 | 84.7 | 1.3 | ||||||||||
| 11.67 | 153 | 81.0 | 84.5 | 3.5 | ||||||||||
| 11.71 | 148 | 83.3 | 83.2 | 0.1 | ||||||||||
| 11.72 | 147 | 79.7 | 82.9 | 3.2 | ||||||||||
| 11.73 | 147 | 79.7 | 82.7 | 3.0 | ||||||||||
| 11.75 | 150 | 79.9 | 82.4 | 2.5 | ||||||||||
| 11.75 | 186 | 89.0 | 84.9 | 4.1 | ||||||||||
| 11.75 | 179 | 88.0 | 84.5 | 3.6 | ||||||||||
| 11.77 | 187 | 87.0 | 84.4 | 2.6 | ||||||||||
| 11.77 | 170 | 86.5 | 83.3 | 3.2 | ||||||||||
| 11.78 | 173 | 87.0 | 83.2 | 3.8 |
Table 3: Comparison between Research Octane Number and calculated Octane index for mixed-base oils.
Copyright© Al-Haj Ibrahim H.
| 11.79 | 149 | 82.3 | 81.4 | 0.9 |
|---|---|---|---|---|
| 11.79 | 171 | 86.0 | 82.8 | 3.2 |
| 11.80 | 173 | 83.0 | 82.7 | 0.3 |
| 11.82 | 173 | 85.5 | 82.1 | 3.4 |
| 11.85 | 190 | 85.0 | 81.6 | ¾ |
| 11.85 | 157 | 77.8 | 80.5 | 2.7 |
| 11.87 | 184 | 80.0 | 81.2 | 1.2 |
| 11.89 | 166 | 83.0 | 79.9 | 3.1 |
| 11.89 | 179 | 89.0 | 80.9 | 8.1 |
| 11.90 | 159 | 77.0 | 79.3 | 2.3 |
| 11.93 | 176 | 83.0 | 79.1 | 3.9 |
| 11.95 | 162 | 81.0 | 78.2 | 2.8 |
| 11.97 | 172 | 83.0 | 77.9 | 5.1 |
| 11.99 | 147 | 77.0 | 76.8 | 0.2 |
| 12.10 | 154 | 81.0 | 74.3 | 6.7 |
Table 4: Comparison between Research Octane Number and calculated Octane index for mixed-base oils.
| Research Octane No. | 90% Boiling Point (°C) | Research Octane No. | Octane Index | Difference | ||||||||||
|---|---|---|---|---|---|---|---|---|---|---|---|---|---|---|
| 12.53 | 110 | 62.0 | 67.8 | 5.8 | ||||||||||
| 12.63 | 65 | 68.3 | 69.3 | 1.0 | ||||||||||
| 12.63 | 65 | 66.6 | 69.3 | 2.7 | ||||||||||
| 12.64 | 65 | 69.1 | 69.2 | 0.1 | ||||||||||
| 12.64 | 66 | 67.0 | 69.2 | 2.2 | ||||||||||
| 12.65 | 65 | 67.3 | 68.2 | 1.9 | ||||||||||
| 12.65 | 65 | 66.6 | 69.2 | 2.6 | ||||||||||
| 12.66 | 65 | 67.0 | 69.1 | 2.1 | ||||||||||
| 12.69 | 68 | 67.0 | 68.8 | 1.3 |
Table 5: Comparison between Research Octane Number and calculated Octane index for paraffinic oils.
Copyright© Al-Haj Ibrahim H.
Correlation between the Cyclic Compounds Content of Motor Gasoline and its Octane Number
The above results indicate a significant relationship between octane numbers and the cyclic compounds content of motor gasoline [8]. The cyclic compounds in gasoline may be either unsaturated aromatic compounds or saturated cycloalkanes, where the effect of these two groups on the octane number is quite different. For the aromatic compounds, the blending octane numbers vary between a minimum of 99 for benzene and a maximum of 171 for 1,3,5-ethyl benzene. For the cycloalkanes, on the other hand, the blending octane numbers vary between a minimum of 43 for ethyl cyclohexane and a maximum of 141 for cyclopentane. Taking such differences into consideration along with the relative abundance of these two groups of compounds in motor gasoline, it can be assumed that the average blending octane number of aromatic compound equals twice the blending octane number of cycloalkanes. For this reason the factor (C+2A) is used in correlation studies between cyclic compounds and octane numbers, where C represents the volume percent of cycloalkanes and A represents the volume percent of aromatic compounds.
Based on a correlation study between this factor and the octane number, the following simple equation was derived:
The correlation factor for this equation was 0.90 and the average error 5.0%. Comparison of the calculated octane index and the measured octane number for different samples of gasoline indicates that the above equation may be applied for gasoline samples where the factor (C+2A) is greater than 110, and where the difference between the measured and calculated values would be less than 1 [9]. This equation, however, may not be very practical because determination of the aromatic and cycloalkane contents of gasoline is not one of the tests routinely carried out in most refineries.
Conclusion
The octane quality of motor gasoline may be estimated using simple and easy-to-measure gasoline properties. The equation derived from the correlation between the octane index and the characterization factor in particular provides an easy and accurate means of determining the combustion characteristics of most commercially- available gasoline. Better correlation may be obtained between the octane index and the cyclic compounds content, but the fact that the determination of the cyclic compounds content of gasoline is not one of the tests routinely carried out in most refineries limits its advantage and practicality.
Nomenclature
A = Volume percent of aromatic compounds C = Volume percent of cycloalkanes d = Relative density at 15.6°C K = Characterization Factor OI = Octane Index T = Average molar boiling point (Kelvin). t90% = 90% boiling point (°C)
References
-
Allinson JP (1975) Criteria for quality of petroleum products. Applied Science Publishers, Essex, UK, pp: 3.
-
Al-Haj Ibrahim H (1996) Correlation between the Octane Number of motor gasoline and its specific gravity. Proceedings of the 36th Science Week, Aleppo, Syria, pp: 79-89. Copyright© Al-Haj Ibrahim H.
-
Al-Haj Ibrahim H, Qassimi MM (1997) Correlation between the octane number of motor gasoline and its boiling range. Journal of King Saud University- Engineering Sciences 9(2): 311-317.
-
Al-Haj Ibrahim H, Qassimi MM (1997) Relationship between the Research Octane Number and the Characterization Factor of unleaded motor gasoline (in Arabic). Bassel Al-Assad Journal for engineering sciences 6: 33-50.
-
Associated Octel Company (1988-1993) European gasoline survey. The Associated Octel Co. Ltd, London.
-
Miller AR (1981) Basic programs for scientists and engineers. Sybex Inc.
-
Hurlburt HZ (1980) Curve fitting by computer. Hydrocarbon Process 59(8): 107-111.
-
Bhaskarahoa BK (1990) Modern Petroleum Refinery Processes. Oxford and IBH Publishing Co.
-
Al-Haj Ibrahim H, Qassimi MM (2000) Determination of calculated octane index for motor gasoline. The Arabian Journal for science and engineering 25(2B): 179-186. Copyright© Al-Haj Ibrahim H.
- Nigeria’s Vulnerability in the Face of Global Energy Policy
- A Simulation Study of Investigation of Optimum Oil Production Performance by Applying Various Gas Injection Methods in Oil Reservoir
- Characterization of Permo-Triassic Reservoirs through Thermal Maturity Assessment of Westphalian Source Rocks in the Cheshire Basin
- Influence of Microwax on the Rheological and Thermal Behaviour of a Wax Crude Oil
- Real-Time Monitoring and Performance Optimization of Steam Injection in Heavy Oil Reservoirs Using Fiber Optic Sensing and Integrated Predictive Simulation Models
- Rapid On-Site Determination of the Total Petroleum Hydrocarbon Content of Soils by Handheld Fourier Transform Near-Infrared Spectroscopy: Development of a Global, Site- and Scanner- Independent Calibration Model