Investigation of Methane/Diesel RCCI Combustion and Emissions at Full Load State Condition by Multi-Dimensional Modeling
As a result of recent focus on the control of Low Temperature Combustion (LTC) modes, dual-fuel combustion strategies such as Reactivity Controlled Compression Ignition (RCCI) have been developed. In this study, Considering the FIRECHEMKIN algorithm, a numerical approach is devised to assess the temperature and concentration effect of intake methane as a low reactive fuel in the combustion and emission characteristics of RCCI combustion to evaluate the parameters involved in this study, the calculations are performed at full load state at the engine speed of 1400 rpm in which the worst engine condition regarding exhaust gas emissions is occurred. The results demonstrate that the increment of intake temperature does not necessarily lead to a higher cylinder temperature and pressure. Furthermore, the role of equivalence ratio is more dominant compared to the role of intake temperature for the net production of Soot in the EVO. The conclusions can open a new prospect for the future researches. Differential scanning colarimetry (DSC) analyzer gave thermogram curves revealing one glass transition temperature for PMMA/PVAc blends except at (20/80) composition, this indicates that the system is miscible except at (20/80) composition. But, PVC/PS blends showed two glass transition temperatures so the system is immiscible. FTIR analysis for PMMA/PVAc blends depicted a weak interaction between the two polymers and solvent due to the miscibility establishment, whilst for PVC/PS blends, there was no interaction between two polymers to establish the miscibility, this indicates immiscible system. Calculations of Flory –Huggins interaction parameter for two systems was performed and the results pointed to miscible blend for PMMA/PVAc blends and immiscible blend for PVC/PS blends. So there is a good agreement between the experimental results and calculations of interaction parameter based on Flory – Huggins theory.
Introduction
Simultaneous reduction of particulate matter (PM) and nitrogen oxides (NOx ) emissions from diesel exhaust is the key to current research activities [1]. Therefore, new combustion concepts should be developed to meet stringent standards. Nowadays, Low Temperature Combustion (LTC) strategies, including Homogeneous and Premixed Charge Compression Ignition (HCCI/PCCI), are receiving more attention due to their potential for simultaneously reducing soot and NOx emissions. b from Investigation of Methane/Diesel RCCI Combustion and Emissions at Full Load State Condition by Multi-Dimensional Modeling Direct Injection (DI) diesel engines according to Cao, et al. [2]. For the HCCI mode, in-cylinder homogeneity may cause rapid combustion by simultaneous ignition throughout the cylinder space and the mixture can be susceptible to great combustion noise. It is also very tough to control the combustion phases. Premixed charge compression ignition (PCCI) ignition has been evolved from the HCCI combustion mode for the sake of better control over the start of combustion (SOC). It is not fully homogeneous like HCCI and achieves desired ignition delay through extensive use of EGR.
Pet Petro Chem Eng J
In this strategy, PM can be reduced by promoting the mix of fuel and air prior to combustion. Meanwhile, NOx is reduced by using lean fuel/air mixture as well as high exhaust gas recirculation (EGR) rate to cool the combustion temperature down. However, because of the low volatility and high flammability of diesel, there are still some problems yet to be solved for PCCI engine, including the formation of homogeneous mixture, ignition control, limited operating range, excessive wall impingement and so on according to Imtenan, et al. [3].
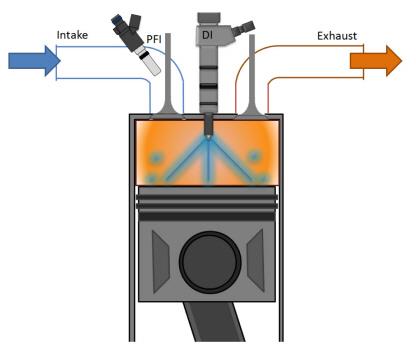
Reactivity controlled compression ignition (RCCI) is the newest approach where multiple fuels of different reactivity are injected at scheduled intervals which governs the reactivity of the charge in the cylinder for the desired combustion duration and magnitude as described by Cha, et al. [4]. Mainly, in this approach, relatively low reactive fuel (low cetane number) Such as natural gas or gasoline is injected (port injection) very early in the engine cycle which mixes with the air homogeneously. Later on, a higher reactive fuel like diesel is injected directly into the cylinder; it creates pockets of different air–fuel ratios and reactivity, which govern the onset of combustion at different times and rates. Figure 1 shows the schematic of RCCI combustion strategy, referred to Cha, et al. [4].
Nowadays, computational tools like CFD play a fundamental role in improving combustion strategy and emission reduction. By reference to extensive studies on modeling of conventional diesel combustion, there are quantitatively limited publications on 3D-CFD simulation of RCCI combustion and most works have been conducted experimentally. Moreover, it is worth investigating the effect of low reactive fuel parameter in the RCCI combustion with more details.
Inagaki, et al. [5] Set an experimental method and investigated PCCI with two different reactive fuels by which they succeeded to run the engine at higher loads with minimal EGR. They represented that the stratification of fuel reactivity makes it possible to reduce the heat release rate. In addition, the control over the combustion phasing beyond PCCI combustion is achieved. Handford, et al. [6] investigated the effect of diesel pilot fuel injection (high reactivity) on combustion in RCCI combustion strategy experimentally. They concluded that by increasing of pilot fuel in the compression stroke, the range of use of EGR and engine load can be increased.
Li, et al. [7] investigated the combustion and emission characteristics of a methanol/diesel RCCI engine by multi- dimensional model coupled with detailed chemical kinetics mechanism. The results showed that with increased methanol, the lower CN of methanol results in longer ignition delay and lower combustion rate at initial combustion stage, which decreases the peak of HRR. Also, the equivalence ratio distribution is more homogeneous with the increment of premixed methanol, and it leads to larger area of high combustion temperature which is beneficial for reduction of HC and CO emissions.
Li, et al. [8] studied a numerical parametric method in the methanol/diesel RCCI combustion. They concluded that initial temperature and EGR rate are the most important operating parameters in the overall engine performance and emissions due to their significant influence on the combustion temperature. Moreover, methanol fraction dramatically affects NOx and Soot emissions by varying the local fuel-rich and high temperature regions.
Jia, et al. [9] identified factors affecting the performance and emissions output of a heavy-duty diesel engine using split diesel injection strategy. The experimental results indicated that retarding the SOI of the first injection pulse made the fuel-air mixture more stratified, forming regions with locally rich equivalence ratios. They also revealed that reducing the compression ratio from 17 to 14 at various engine speeds had favorable effects on NOx emissions but increased UHC emissions.
Kakaee, et al. [10] investigated the influences of engine speed, initial temperature and fuel composition on RCCI combustion and emissions by KIVA-3V CFD code. The numerical results illustrated that by increasing engine speed, the available time for occurrence of chemical reactions is reduced, which results in more incomplete combustion. Increment of initial temperature increases the reaction rate, which increases NOx and advances combustion phasing.
Wang, et al. [11] experimentally investigated the effect of operational parameters on RCCI combustion performance and emissions. The results showed that in order to extend the RCCI operating range to lower loads, the proportion of diesel injection should be raised to increase the global reactivity of the in-cylinder charge. Also, ultra-high EGR rate or too early fuel injection can lead to unstable combustion, making combustion phasing control extremely difficult.
Wang, et al. [12] conducted an experimental investigation to assess explore the effects of direct- injection (DI) fuel properties in RCCI combustion. The results demonstrated that a higher cetane number DI fuel allows more advanced SOI timing, more EGR, and higher premixed ratio. In addition, there is a competing relationship between DI fuel cetane number and EGR/premixed ratio in controlling the combustion and emissions.
The scope of the present work is to cover the shortages of the limited numerical studies regarding the CNG/diesel RCCI combustion and prospects the future studies. In this regard, the RCCI combustion of methane/diesel is investigated by utilizing CFD code AVL- FIRE coupled with CHEMKIN code. The parametric computations are performed at the engine speed of 1400 rpm and full load state which is the worst engine condition regarding exhaust gas emissions.
Model Formulation
Engine Specification and Geometry Meshing
The characteristics of OM-355 RCCI engine is shown in table 1. In RCCI mode, 90% of the diesel fuel is replaced by the natural gas (methane) and air mixture in the compression stroke. 10% of the high reactivity fuel or pilot fuel (diesel) is used for the ignition source of the charge.
Air flow rate was derived from the measured pressure drop across an orifice installed on a surge tank. Mass flow rates of diesel and natural gas fuels were measured by volumetric flow meters. Temperature of cooling water, lubricating oil, inlet air and exhaust gas were also measured to ensure proper engine operating conditions. The inlet and exhaust air temperatures were measured by K-type thermocouple made by Testo Co in Germany. The exhaust emissions were also measured by AVL 4000 exhaust gas analyzer was made by AVL Co in Germany.
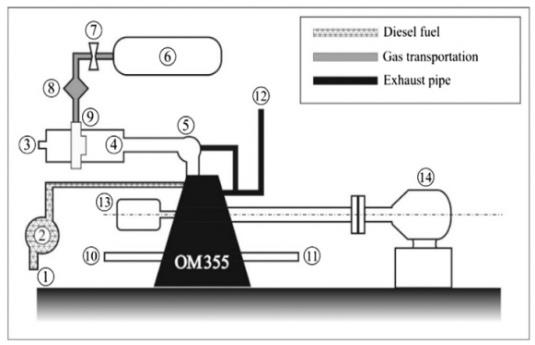
Schematic of test bench set up based on Maghbouli, et al. [13], can be seen in the Figure 2 which consists of 1: Diesel fuel input. 2: Pump. 3: Air input. 4: Intake manifold. 5: Turbocharger. 6: Natural gas tank. 7: Valve. 8: Regulator.9: Natural gas and air mixer. 10: Coolant in. 11: Coolant out. 12: Exhaust outlet. 13: Shaft encoder. 14: Dynamometer.
| Piston shape: Cylindrical bore | Aspiration: Turbocharged |
|---|---|
| No. of nozzles/injector: 4 | Make and model: Mercedes–Benz |
| Nozzle opening pressure: 195 (bar) | Cylinders: |
| 6, In-line-vertical | |
| IVC: 61ºCA after BDC | Piston crown shape: Cylindrical |
| EVO: 60ºCA before BDC | Bore · stroke: |
| 128 (mm) · 150 (mm) | |
| Max. power: 240 (HP) at 2200 (rpm) | Capacity: 11.58 (lit) |
| Max. torque: 824 N m at 1400 (rpm) | Compression ratio: 16.1:1 |
Table 1: Engine Specifications.
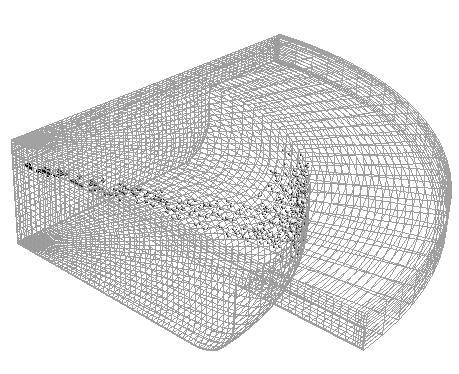
The computational mesh was created using AVL ESE Diesel Tool (FIRE engine simulation environment user manual 2014). Details of the computational mesh used are given in Figure 3. The computation used a 90 degree sector mesh (the diesel injector has four Nozzle holes) with 25 nodes in the radial direction, 20 nodes in the azimuthally direction and 5 nodes in the squish region at top dead center. Having the ground of the bowl meshed with two continuous layers, one can calculate the heat transfer through the piston wall, precisely. The final mesh is composed of a hexahedral dominated mesh. Number of cells in the mesh was about 64,000 and 36,000 at BDC and TDC, respectively. The present resolution was found to achieve adequately grid independent results.
Flow Field, Spray and Combustion Models
The turbulent, three dimensional transient conservation equations of mass, momentum, energy and species are computed through applying finite-volume in AVL FIRE.
Continuity equation for species m and energy equation in terms of specific internal energy is formulated in AVL FIRE as given in equation (1) and equation (2), respectively.
$$ \frac {\partial \rho_ {m}}{\partial t} + \nabla . \left(\rho_ {m} \mathrm {u}\right) = \nabla . \left[ \rho D \nabla \left(\frac {\rho_ {m}}{\rho}\right) \right] + \dot {\rho} _ {m} ^ {c} + \dot {\rho} ^ {s} \delta_ {m l} $$ (1) $$ \mathrm {E} = \mathrm {E} _ {1} + \mathrm {E} _ {2} + \dots + \mathrm {E} _ {n} $$ $$ \mathrm {E} = \frac {1}{2} \mathrm {A} ^ {2} + \mathrm {B} ^ {2} $$ $$ \frac {\partial}{\partial t} (\rho \mathrm {I}) + \nabla . (\rho u \mathrm {I}) = - P \nabla . u + \left(1 - A _ {0}\right) \sigma : \nabla u - \nabla . \mathrm {J} + A _ {0} \rho \varepsilon + Q ^ {c} + Q ^ {s} $$ (2) $$ \mathrm {E} = \frac {1}{2} \mathrm {A} ^ {2} + \mathrm {B} ^ {2} $$ $$ \mathrm {E} = \mathrm {E} _ {1} + \mathrm {E} _ {2} + \dots + \mathrm {E} _ {n} $$ Where c m ρ in equation (1) and c Q in equation (2) are the source terms that need to be calculated by combustion model. Mathematical descriptions of these terms are as follows:
( 3 ) $$ \mathrm {E} = \frac {1}{2} \mathrm {A} ^ {2} + \mathrm {B} ^ {2} $$
$$ \dot {\rho} _ {m} ^ {c} = W _ {m} \dot {\omega} _ {m} $$
$$ \mathrm {E} = \frac {1}{2} \mathrm {A} ^ {2} + \mathrm {B} ^ {2} $$
M
( ) ( 4 ) $$ = - \sum_ {\mathrm {m} = 1} ^ {\mathrm {M}} \dot {\omega} _ {m} \left(\Delta h\right) $$ $$ \mathrm {E} = \mathrm {E} _ {1} + \mathrm {E} _ {2} + \dots + \mathrm {E} _ {n} $$ m f m Q h ω ° m 1 c Considering the above equations, one can be declared that the ultimate goal of a sample combustion model is to define the chemical species net production rates m ω . In order to calculate the molar production rate of chemical species participated in chemical kinetics mechanism, the gas phase kinetics library of CHEMKIN-II is coupled with AVL FIRE.
In agreement of Patel, et al. [14], the chemical kinetics mechanism of n-heptane including 29 species and 52 elementary reactions is developed. Subsequently, it is used to calculate the detailed chemical kinetics of both diesel (n-heptane) and methane (CH4) combustion.
The standard WAVE model devised by Liu, et al. [15] was deployed for the primary and secondary atomization modeling of the resulting droplets. In this model, the growth of an initial perturbation on a liquid surface is linked to its wave length and other physical and dynamic parameters of the injected fuel and the domain fluid. Drop parcels are injected with characteristic size equal to the Nozzle exit diameter (blob injection). The injection rate profile is rectangular type and consists of four injection schemes, i.e. single injection and three split injection cases.
The Dukowicz model was applied for treating the heat- up and evaporation of the droplets which is described by Dukowicz [16]. This model assumes a uniform droplet temperature. In addition, the rate of droplet temperature change is determined by the heat balance which states that such that the heat convection from the gas to the droplet either heats up the droplet or supplies heat for vaporization.
The spray-wall interaction model represented in the simulations was based on the spray-wall impingement model developed by Naber, et al. [17]. This model assumes that a droplet which hits the wall is affected by rebound or reflection based on the Weber number.
Emission models
For the calculation of NOx formation, a 4 species (N, NO, N2O and NO2) and 9 reactions NOx mechanism were utilized. That have been reduced from the GRI-Mech 3.0 NOx mechanism and added to the n-heptane/CH4 reaction mechanism. The soot formation rate is explained as a model which is based on the difference between soot formation and soot oxidation investigated by Hiroyasu, et al. [18].
Initial Conditions
All simulations are computed at full load state and performed from IVC to EVO. The initial conditions for the base case are indicated in the Table 2.
| Engine Speed [rpm] | 1400 |
|---|---|
| Injected diesel fuel [mg/inj] | 8.39 |
| Initial equivalence ratio | 0.5 |
| SOI-EOI [°CA] | 325-343 |
| Intake temperature [K] | 300 |
| Intake pressure [bar] | 1.01 |
Table 2: Initial condition for the base case.
For validating numerical results, 1600 rpm and 2200 rpm cases have been simulated with the similar initial conditions to the contents of Table 2 as well as 1400 rpm case.
Generally, the controlling strategies of RCCI combustion include injection timing, local equivalence ratio, intake temperature, fuel blend composition and reactivity. In this study, local equivalence ratio and intake temperature have been selected as controlling strategies. For the parametric studies, equivalence ratio and intake temperature are varied as 0.4/0.5/0.6 and 300/315/330/345/360 K, respectively.
Results and Discussion
Model Validation
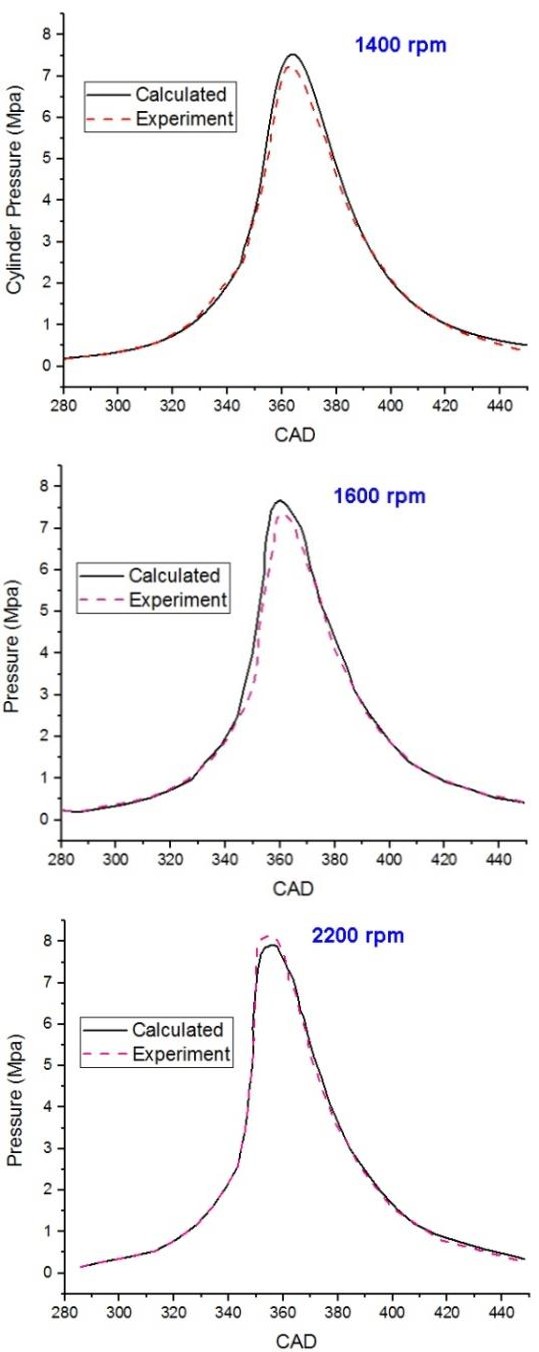
Figure 4a & 4b compare the cylinder pressure and heat release rate (HRR) with the experimental data at the various engine speeds. Experimental HRR is evaluated through a single zone diagnostic algorithm on the basis of the in-cylinder pressure distribution. In general, the location and magnitude of the main heat release rate is predicted accurately. However, for the main peak of HRR and high temperature condition, the simulations predict slightly higher cylinder pressure and HRR in comparison with the corresponding experimental data. These differences can be attributed to the over-prediction of the spray breakup and evaporation process during the injection event. In general, for different cases, the maximum differences of numerical and experimental cylinder pressure and HRR results are 4% and 9%, respectively.
Figure 4a: Comparison of measured and predicted in-cylinder pressure at the various engine speeds.
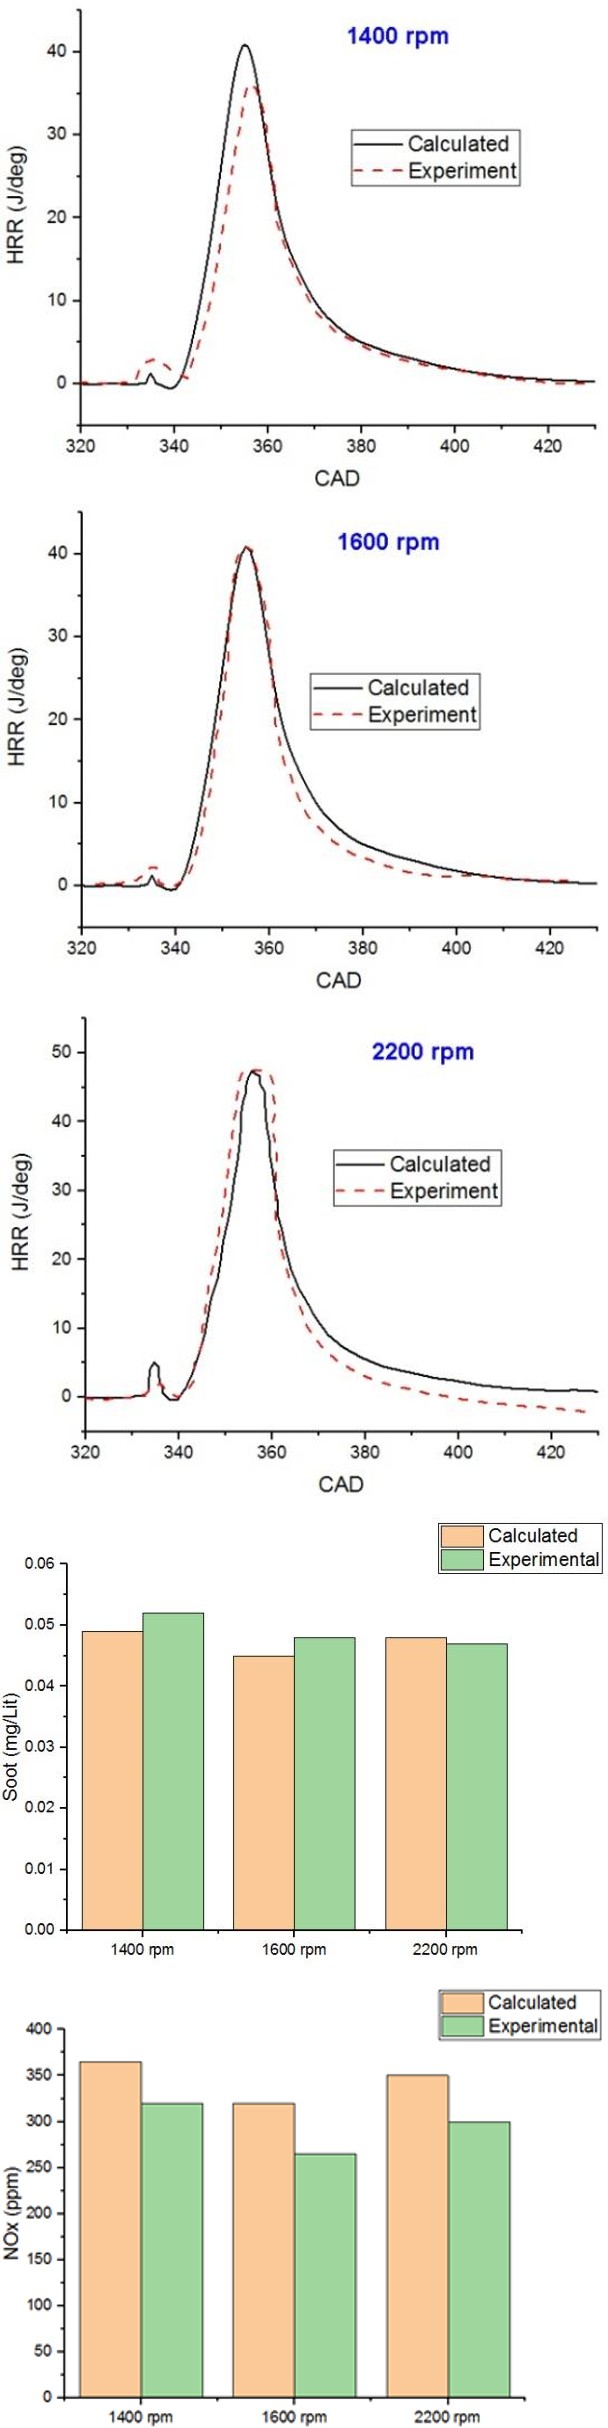
Figure 4b: Comparison of measured and predicted HRR histories at the various engine speeds.
Figure 5a & 5b compares calculated exhaust NOx and Soot emissions with the experimental values at different engine speeds. Clearly, good agreement is obtained between the numerical and experimental values.
Figure 5a: Comparison of measured and predicted exhaust NOx for the base case.
Figure 5b: Comparison of measured and predicted exhaust Soot for the base case. Effect of CH4 Concentration on Combustion and Emission Parameters Figure 6a indicates the history of the in-cylinder pressure, HRR and temperature for the various CH4 equivalence ratios. As a conclusion, increasing in equivalence ratio results in the peak of cylinder pressure and temperature as well. 0.1 increment in equivalence ratio raises the peaks of pressure and temperature of the high temperature combustion (HTC) period approximately for 0.9 MPa and 210 K, respectively. Additionally, in the HRR curve depicted in Figure 6b, the first peak of HRR related to the LTC condition is independent on the equivalence ratio variation, whilst the second peak of HRR or high temperature heat release raises right after equivalence ratio increases.
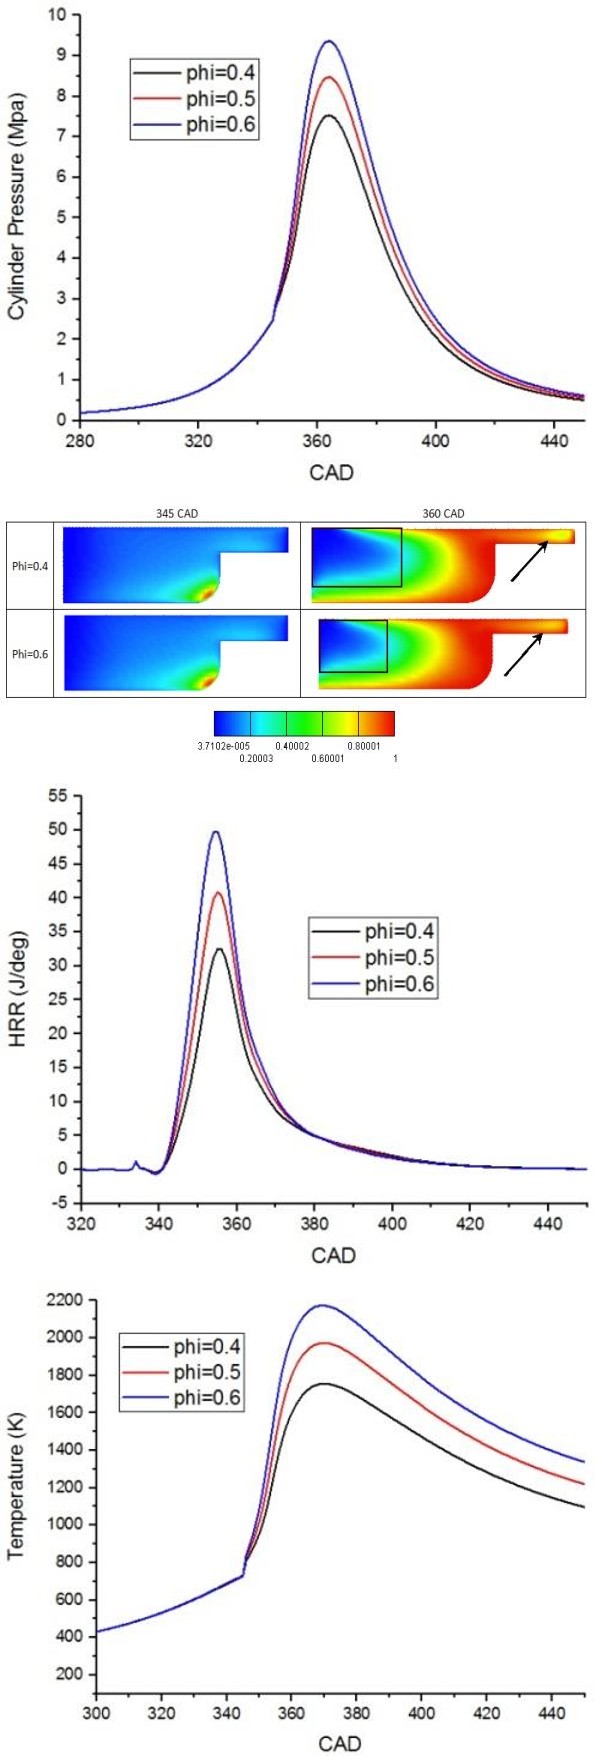
Figure 6a: History of the in-cylinder pressure for the various CH4 equivalence ratios.
Figure 6b: History of the HRR for the various CH4 equivalence ratios.
Figure 6c: History of the temperature for the various CH4 equivalence ratios.
Figure 7 demonstrates the contours of reaction progress variable at 345 CAD (LTC mode) and 360 CAD (HTC mode) for Phi=0.4 and 0.6 cases. Zehni, et al. [19] have already explained that formaldehyde (CH2O) and hydroxyl (OH) radicals are respectively the symptoms of LTC and HTC onset. In consideration of that figure, LTC mode is initiated at the corner of piston bowl in both cases without any obvious difference. On the other side, more flame development for Phi=0.6 is observed in squish and center regions compared to Phi=0.4. It is due to the more sufficient methane concentration for Phi=0.6 case. Hence, it can be concluded that CH2O formation is independent of initial equivalence ratio, whilst OH radical formation is fully related to equivalence ratio.
Figure 8 shows the history of the in-cylinder NOx, Soot and CH4 mass fraction for the various CH4 equivalence ratios.
Figure 8a shows that when Phi is 0.6, NOx production is quite high compared to the lower equivalence ratio cases. The reason is related to the direct dependence of NOx production on the in-cylinder temperature, as higher equivalence ratios cause higher cylinder temperature and consequently higher NOx production. Figure 8b indicates that with increasing equivalence ratio, Soot production is increased as well. The reason behind that is the more equivalence ratio is the higher fuel rich combustion zones would be. Therefore, increase of temperature and oxidation rate cannot compensate for the production rate of Soot. Figure 8c reveals that CH4 mass fraction increases when equivalence ratio becomes higher. It is worth noting that for various equivalence ratio cases, CH4 consumption is so that the concentrations of CH4 becomes equal at 387 crank angle degree and the trend of similar concentration is continued up to EVO.
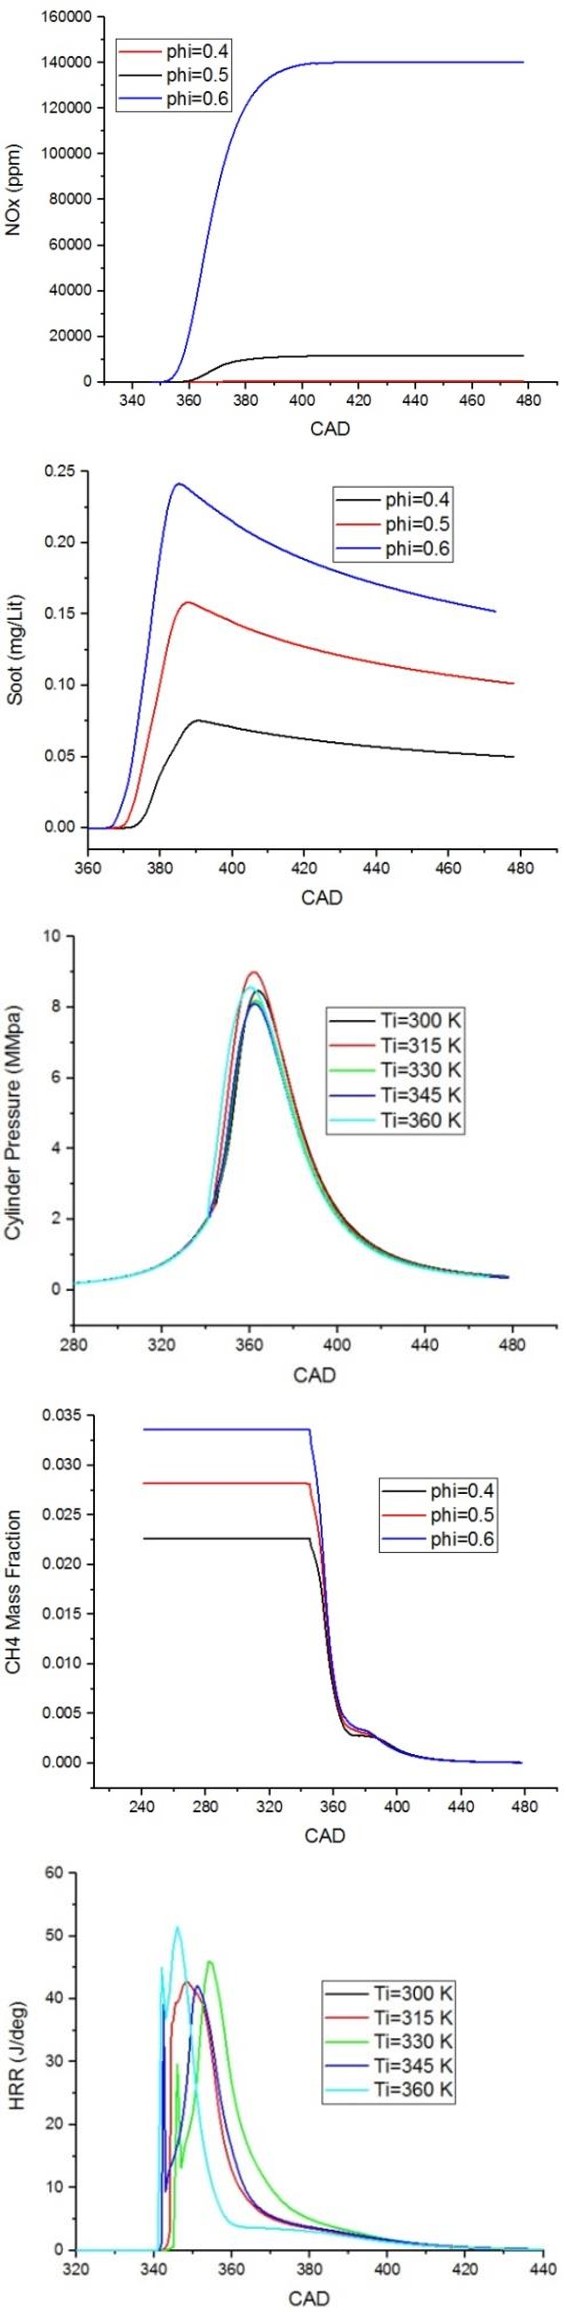
Figure 8a: History of the NOx for the various CH4 equivalence ratios.
Figure 8b: History of the Soot for the various CH4 equivalence ratios.
Figure 8c: History of CH4 mass fraction for the various CH4 equivalence ratios.
Effect of Intake Temperature on Combustion and Emission Parameters
Figure 9 indicates the evolution of the in-cylinder pressure, HRR and temperature for the various intake temperatures. As can be seen from the mentioned curves, with increasing intake temperature, peaks of LTC and HTC are advanced. It is originated from this fact that the higher reaction rate causes the combustion phasing advance. Consequently, the pressure and temperature increase advance. But, increasing intake temperature does not necessarily lead to the higher peak of cylinder pressure and temperature; as the peak of cylinder pressure and temperature for the case of 315 K intake temperature are in the first and second rank, accordingly. It is mainly due to the effect of higher ignition delay for the case of lower intake temperature. Higher ignition delay leads to higher air-fuel mixing and premixed combustion. One can conclude that the compromise between mixture formation and intake temperature parameter determines the magnitude of the peak of HRR, cylinder pressure and temperature.
Figure 9b: History of the HRR for the various intake temperatures.
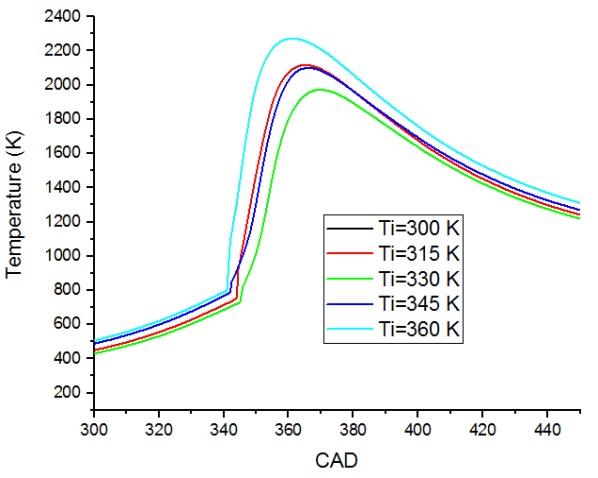
Figure 9c: History of the temperature for the various intake temperatures.
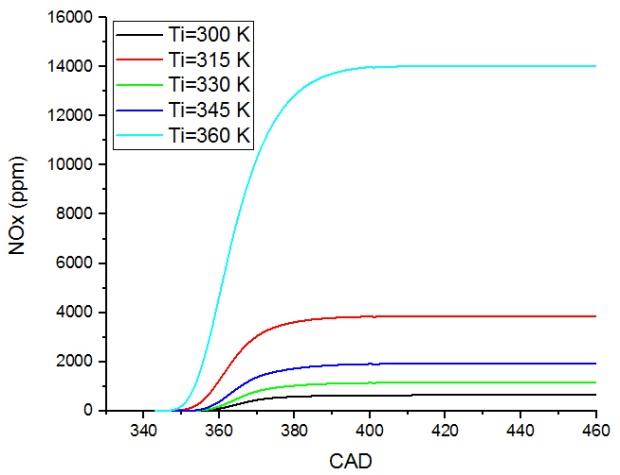
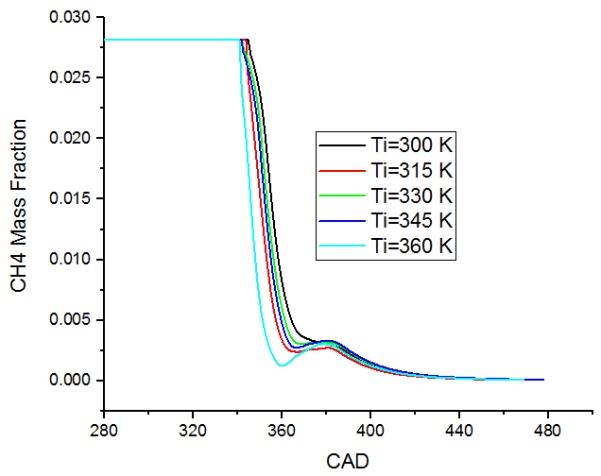
Figure 10 & 11 illustrate that with increasing intake temperature, exhaust NOx and Soot are increased as well. It can be implied from this fact that increasing temperature ignition delay is shortened and it may cause to the incomplete mixing of fuel and air and consequently formation of the initial nucleus of Soot. Additionally, Soot oxidation cannot be compensated with higher temperature and exhaust Soot emission increased. Hence, it is deduced that for semi-homogeneous mixture of RCCI combustion the intake temperature is required to be in a medium range in order to not increasing NOx and Soot, simultaneously.
Figure 12 reveals the history of CH4 mass fraction for the various intake temperatures. Increase of CH4 consumption rate with increasing temperature is evident. From TDC up to 370 CAD, it can be seen the formation of CH4 instead of its consumption. It stems from the following reaction mechanism in which OH radical is reversely converted to CH4 at high temperature condition. CH4+O = CH3+OH
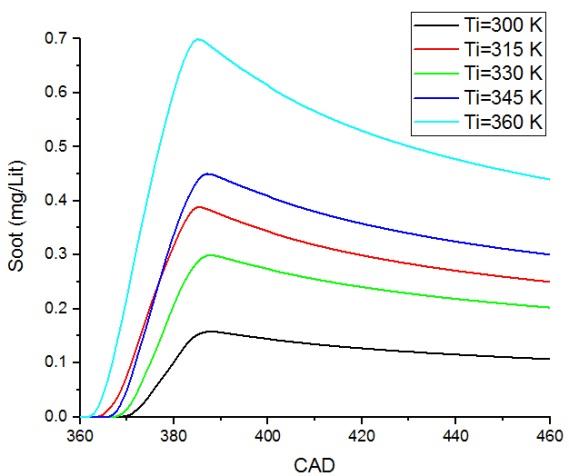
Figure 12: History of CH4 mass fraction for the various intake temperatures Figure 13 indicates the contours of equivalence ratio, temperature, NOx and Soot at 420 CAD. At this crank angle degree the parameters are tend to be constant until EVO. It can be seen that although the temperature distribution seems to be similar for all the cases but, for the 330 K case, the area of high equivalence ratio is wider than the other cases. In general, the area of NOx and Soot formation is similar to the area of high temperature and equivalence ratio. As can be seen, higher NOx and Soot areas are located in the central part of the combustion chamber except for the NOx of 330 K case which is being in the bowl of piston as well. Higher Soot concentration for the case of 330 K concludes that higher temperature does not lead to higher Soot oxidation in the RCCI combustion necessarily and the role of equivalence ratio distribution is the dominant factor.
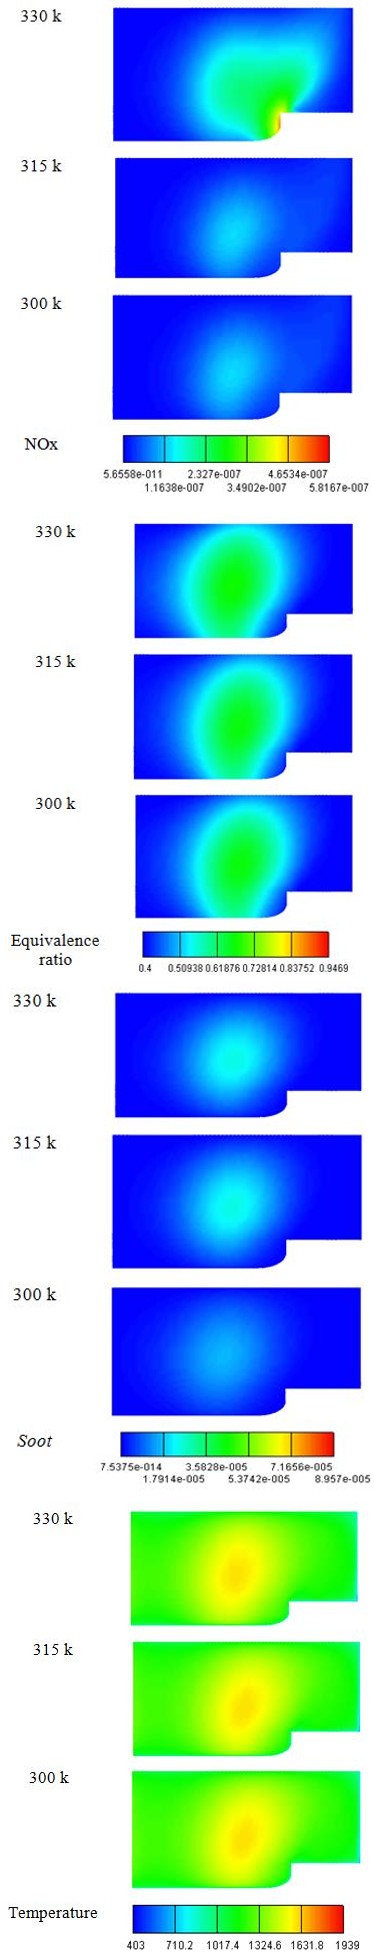
Figure 13a: Contours of equivalence ratio at 420 CAD for the various intake temperatures.
Figure 13b: Contours of temperature at 420 CAD for the various intake temperatures.
Figure 13c: Contours of NOx at 420 CAD for the various intake temperatures.
Figure 13d: Contours of Soot at 420 CAD for the various intake temperatures.
Conclusion
1. In this study, the RCCI combustion and emission of methane/diesel was investigated by CFD code AVL- FIRE coupled with CHEMKIN code. The calculations were at the engine speed of 1400 rpm and full load mode in which the worst engine condition regarding exhaust gas emissions was occurred. The main conclusions are as follows:
2. The first peak of HRR which is related to the LTC condition is independent from the equivalence ratio variation though the second peak of HRR or high temperature heat release is increased through equivalence ratio increment.
3. CH₂O formation is independent from initial equivalence ratio while OH radical formation is fully related to equivalence ratio.
4. Increasing intake temperature does not lead to the higher cylinder pressure and temperature, necessarily. The reason is due to the higher ignition delay and higher premixed combustion for the lower intake temperature.
5. The compromise between mixture formation and intake temperature parameter determines the magnitude of the peak of HRR, cylinder pressure and temperature.
6. In the RCCI combustion, the intake temperature should be in a medium range in order to not increasing NOx and Soot simultaneously.
7. From TDC up to 370 CAD, high temperature condition causes the occurrence of the backward reaction: CH₄+O = CH₃+OH in which the formation of CH₄ is occurred instead of its consumption.
8. For the net production of Soot in the EVO, the role of equivalence ratio is more dominant comparing to the role of intake temperature.
**Nomenclature**
- $A_0$ Fluid flow constant
- $D$ Diffusion coefficient ($m^2/s$)
- $E$ Dissipation rate of turbulence ($J/kg.s$)
- $I$ Specific internal energy ($J/kg$)
- $J$ Heat flux ($W/m^2$)
- $M$ Number of reactions in chemical kinetics mechanism/molecular weight ($gr/mol$)
- $P$ Pressure ($Pa$)
- $R$ Gas constant ($J/mol.K$)
- $W$ Molecular weight ($kg/kmol$)
- $t$ Time ($s$)
- $u$ Velocity vector ($m/s$)
- $m$ Number of species in chemical kinetics mechanism
- $Q^c$ Source term due to chemistry ($W/m3$)
- $Q^s$ Source term owing to spray ($W/m^3$)
- $\delta_{ml}$ Dirac delta function
- $\Delta h_f^*$ Heat of formation of species m at absolute zero ($kJ/kmol$)
- $\sigma$ surface tension ($N/m$)
- $\lambda$ Thermal conductivity ($W/m.K$)
- $\rho$ Density ($kg/m^3$)
- $\eta$ Viscosity ($Pa.s$)
- $\dot{\rho}_m^*$ Density change rate due to chemistry ($kg/m^3.s$)
- $\dot{\rho}^s$ Density change rate owing to Spray ($kg/m^3.s$)
- $\dot{\omega}_m$ Molar production rate ($kmol/m^3.s$)
- ATDC After Top Dead Center
- ASOI After Start of Injection
- BTDC Before Top Dead Center
- CAD Crank Angle Degree
- CFD Computational Fluid Dynamics
- CI Compression Ignition
- CO Carbon Monoxide
- DI Direct Injection
- EOI End of Injection
- EGR Exhaust Gas Recirculation
- EVO Exhaust Valve open
- HCCI Homogeneous Charge Compression Ignition
- HRR Heat Release Rate ($J/deg$)
- HTHR High Temperature Heat Release
- IMEP Indicated Mean Effective Pressure ($Pa$)
- IVC Inlet Valve Closure
- LHV heating value ($MJ/kg$)
- LTC Low Temperature Combustion
- LTHR Low Temperature Heat Release
- MD methyl decanoate
- MD9D methyl-9-decanoate
- NOx Nitrogen Oxides
- NTC Negative Temperature Coefficient
- PCCI Premixed Charge Compression Ignition
- PM Particulate Matter
- SMD Sauter Mean Diameter ($m$)
- SOI Start of Injection
- THC Total (unburned) Hydrocarbon
- c Critical
- r Reduced
- vpr Vapor
**References**
- Ahmed DS, El-Hiti G, Yousif E, Ali A, Hameed A (2018) Design and synthesis of porous polymeric materials and their applications in gas capture and storage: a review. Journal of Polymer Research 25: 75.
- Cao L, Bhave A, Su H, Mosbach S, Kraft M, et al. (2009) Influence of injection timing and piston bowl geometry on PCCI combustion and emissions. SAE Int J Engines 2(1): 1019-1033.
3. Imtenan S, Varman M, Masjuki HH, Kalam MA, Sajjad
H, et al. (2014) Impact of low temperature combustion attaining strategies on diesel engine emissions for diesel and biodiesels. Energy Conversion and Management 80: 329-356.
4. Cha J, Kwon S, Park S (2011) An experimental and modeling study of the combustion and emission characteristics for gasoline–diesel dual-fuel engines. Proc Inst Mech Eng D J Automob Eng 225(6): 801- 812.
5. Inagaki K, Fuyuto T, Nishikawa K, Nakakita K, Sakata I
(2006) Dual-fuel PCI combustion controlled by in- cylinder stratification of ignitability. SAE Technical Paper.
6. Handford DI, Checkel MD (2009) Extending the load range of a natural gas HCCI engine using direct injected pilot charge and external EGR. SAE International.
7. Li Y, Jia M, Liu Y, Xie M (2013) Numerical study on the combustion and emission characteristics of a methanol/diesel reactivity controlled compression ignition (RCCI) engine. Applied Energy 106: 184-197.
8. Li Y, Jia M, Chang Y, Liu Y, Xie M, et al. (2014)
Parametric study and optimization of a RCCI (reactivity controlled compression ignition) engine fueled with methanol and diesel. Energy 65: 319-332.
9. Jia Z, Denbratt I (2015) Experimental Investigation of Natural Gas-Diesel Dual-Fuel RCCI in a Heavy-Duty Engine. SAE, Paper.
10. Kakaee AH, Rahnama P, Paykani A (2015) Influence of fuel composition on combustion and emissions characteristics of natural gas/diesel RCCI engine.
Journal of Natural Gas Science and Engineering 25: 58-65.
11. Wang Y, Yao M, Li T, Zhang W, Zheng Z (2016) A
parametric study for enabling reactivity controlled compression ignition (RCCI) operation in diesel engines at various engine loads. Applied Energy 175: 389-402.
12. Wang H, Zhao X, Tong L, Yao M (2018) The effects of DI fuel properties on the combustion and emissions characteristics of RCCI combustion. Fuel 227: 457- 468.
13. Maghbouli A, Saray Khoshbakhti R, Shafee S, Ghafouri
J (2013) Numerical study of combustion and emission characteristics of dual-fuel engines using 3D-CFD models coupled with chemical kinetics. Fuel 106: 98- 105.
14. Patel A, Kong SC, Reitz RD (2004) Development and validation of a reduced reaction mechanism for HCCI engine simulations_._ SAE paper.
15. Liu AB, Reitz RD (1993) Modeling the effects of drop drag and breakup on fuel sprays. SAE, Paper 930072.
16. Dukowicz JK (1979) Quasi-steady droplet change in the presence of convection. Los Alamos Scientific Laboratory, LA7997-MS.
17. Naber JD, Reitz RD (1988) Modeling engine spray/wall impingement. SAE Paper 880107.
18. Hiroyasu H, Nishida K (1989) Simplified three- dimensional modeling of mixture formation and combustion in a DI diesel engine. SAE, Paper 890269.
19. Zehni A, Khoshbakhti SR (2018) Comparison of late PCCI combustion, performance and emissions of diesel engine for B20 and B100 fuels by KIVA- CHEMKIN coupling. Renewable Energy 122: 118-130.
References
-
Ahmed DS, El-Hiti G, Yousif E, Ali A, Hameed A (2018) Design and synthesis of porous polymeric materials and their applications in gas capture and storage: a review. Journal of Polymer Research 25: 75.
-
Cao L, Bhave A, Su H, Mosbach S, Kraft M, et al. (2009) Influence of injection timing and piston bowl geometry on PCCI combustion and emissions. SAE Int J Engines 2(1): 1019-1033.
-
Imtenan S, Varman M, Masjuki HH, Kalam MA, Sajjad H, et al. (2014) Impact of low temperature combustion attaining strategies on diesel engine emissions for diesel and biodiesels. Energy Conversion and Management 80: 329-356.
-
Cha J, Kwon S, Park S (2011) An experimental and modeling study of the combustion and emission characteristics for gasoline–diesel dual-fuel engines. Proc Inst Mech Eng D J Automob Eng 225(6): 801- 812.
-
Inagaki K, Fuyuto T, Nishikawa K, Nakakita K, Sakata I (2006) Dual-fuel PCI combustion controlled by in- cylinder stratification of ignitability. SAE Technical Paper.
-
Handford DI, Checkel MD (2009) Extending the load range of a natural gas HCCI engine using direct injected pilot charge and external EGR. SAE International.
-
Li Y, Jia M, Liu Y, Xie M (2013) Numerical study on the combustion and emission characteristics of a methanol/diesel reactivity controlled compression ignition (RCCI) engine. Applied Energy 106: 184-197.
-
Li Y, Jia M, Chang Y, Liu Y, Xie M, et al. (2014) Parametric study and optimization of a RCCI (reactivity controlled compression ignition) engine fueled with methanol and diesel. Energy 65: 319-332.
-
Jia Z, Denbratt I (2015) Experimental Investigation of Natural Gas-Diesel Dual-Fuel RCCI in a Heavy-Duty Engine. SAE, Paper.
-
Kakaee AH, Rahnama P, Paykani A (2015) Influence of fuel composition on combustion and emissions characteristics of natural gas/diesel RCCI engine. Journal of Natural Gas Science and Engineering 25: 58-65.
-
Wang Y, Yao M, Li T, Zhang W, Zheng Z (2016) A parametric study for enabling reactivity controlled compression ignition (RCCI) operation in diesel engines at various engine loads. Applied Energy 175: 389-402.
-
Wang H, Zhao X, Tong L, Yao M (2018) The effects of DI fuel properties on the combustion and emissions characteristics of RCCI combustion. Fuel 227: 457- 468.
-
Maghbouli A, Saray Khoshbakhti R, Shafee S, Ghafouri J (2013) Numerical study of combustion and emission characteristics of dual-fuel engines using 3D-CFD models coupled with chemical kinetics. Fuel 106: 98- 105.
-
Patel A, Kong SC, Reitz RD (2004) Development and validation of a reduced reaction mechanism for HCCI engine simulations_._ SAE paper.
-
Liu AB, Reitz RD (1993) Modeling the effects of drop drag and breakup on fuel sprays. SAE, Paper 930072.
-
Dukowicz JK (1979) Quasi-steady droplet change in the presence of convection. Los Alamos Scientific Laboratory, LA7997-MS.
-
Naber JD, Reitz RD (1988) Modeling engine spray/wall impingement. SAE Paper 880107.
-
Hiroyasu H, Nishida K (1989) Simplified three- dimensional modeling of mixture formation and combustion in a DI diesel engine. SAE, Paper 890269.
-
Zehni A, Khoshbakhti SR (2018) Comparison of late PCCI combustion, performance and emissions of diesel engine for B20 and B100 fuels by KIVA- CHEMKIN coupling. Renewable Energy 122: 118-130.
- Nigeria’s Vulnerability in the Face of Global Energy Policy
- A Simulation Study of Investigation of Optimum Oil Production Performance by Applying Various Gas Injection Methods in Oil Reservoir
- Characterization of Permo-Triassic Reservoirs through Thermal Maturity Assessment of Westphalian Source Rocks in the Cheshire Basin
- Influence of Microwax on the Rheological and Thermal Behaviour of a Wax Crude Oil
- Real-Time Monitoring and Performance Optimization of Steam Injection in Heavy Oil Reservoirs Using Fiber Optic Sensing and Integrated Predictive Simulation Models
- Rapid On-Site Determination of the Total Petroleum Hydrocarbon Content of Soils by Handheld Fourier Transform Near-Infrared Spectroscopy: Development of a Global, Site- and Scanner- Independent Calibration Model