CFD Simulation of Catalytic Cracking of n-Heptane in a Fixed Bed Reactor
This work aims to three-dimension computational fluid dynamics (CFD) simulation of n-heptane catalytic cracking in fixed bed reactor (L=0.80 m) and to promote the cracking model of n-heptane using CFD. The catalyst granules were located in middle section of the reactor. The reaction scheme of n-heptane catalytic cracking was involved one primary reaction and 24 secondary reactions. Catalytic cracking process with a model of 25 molecular reactions was simulated by Fluent 6.0 software. The ratio of tube-to-particle diameter was considered N=2. The contours of coke deposition rate, vorticity, velocity and coke precursors and their relations along the reactor were predicted and discussed.
Introduction
In recent years, there has been considerable interest in optimizing global efficiency in production processes and minimizing waste generation due to the general trend of market globalization, environmental actions, higher client expectations, and increased profit revenue for manufacturing companies. The traditional approach of taking a product from the laboratory to a pilot plant and then to production scale is no longer attractive due to the high costs involved. Product and process development is carried out almost simultaneously, and fast analysis and prototype design capability are required to meet expectations. Computational fluid dynamics (CFD) is one of the critical “enabling technologies” for achieving this. It allows process engineers to predict, manipulate, and design the desired fluid dynamics in process equipment. In the modeling and design of fixed bed equipment, CFD can be used to simulate single phase and multiphase flow through porous media and to perform detailed modeling of a packed bed, and it is used to design equipment with single-phase flow through porous media [1, 2, 3]. In all cases, the results depend on an appropriate geometrical model, mesh definition, and the selection of a turbulence model (when considered necessary). There have been few CFD studies in fixed beds due to complex factors such as geometry definition and heat and mass transfer modeling, in addition to limitations in computational power. The first CFD approaches included 2D studies that resolved flow patterns and heat transfer around proposed ideal geometries. Although this study was developed for an ideal case, it has been the basis for the development of many other studies, contributing to improved theoretical predictions for the behavior of catalytic reactors. In this case, a periodic and repetitive structure within the packing is identified and subsequently used to define the computational domain limits. This geometrical strategy has been used for flow and heat transfer modeling in catalytic reactor for cracking process [4, 5, 6]. In this work, CFD was used to simulate the process of n-heptane cracking in the three-dimensional (3D). This study has been limited to regular packing schemes (N=2). The aims of this work are to evaluate the performance of CFD and promoting catalytic cracking of n-heptane modeling which developed before by Kunzro and Pant [7]. Furthermore, other objectives are to evaluate the coke deposition and coke precursor profiles along the reactor and relations between coke deposition and fluid parameters.
Coke Formation Modeling and CFD Simulation
Coke formation is a problem during catalytic cracking processes, which cause to deactivate the catalyst [8]. Geometrical modeling is one of the most critical stages in CFD simulation; correct definition of the geometry provides a more realistic scenario for the simulation, and the technique used for constructing the geometry will ensure the feasibility of generating a mesh good enough to capture all of the phenomena involved in the problem. The first step was to select a proper arrangement for the fixed bed. In a bed with a mixture of particle sizes if average particle size is used in the calculations, heat and mass dispersion follow the predictions for a bed of mono sized particles. Therefore, a homogeneous sphere stack was selected for catalyst granules in this study. In this case, all of the granules assumed to be spherical, in N=2. This arrangement is shown in Figure 1 [3, 9]. Reactor diameter was 0.02 m, the diameter of granules, 0.0048 mm and the reactor length was 0.80 m. These dimensions were applied in design of reactor.
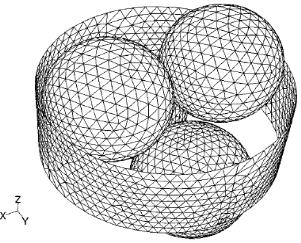
The length of catalysts in the middle of the reactor was 0.20 m. The design of catalysts and reactor geometries was carried out in gambit software. Mesh design is the most important section in simulation. Mesh density and the size of mesh are two important points that will effect on simulated data. Theoretically, the mesh should be able to appropriately define the boundary layer around the geometry present in the model for the laminar solution. The boundary conditions for the model equations are as follows: (i) constant temperature and velocity of the fluid at the inlet, (ii) constant temperature at the wall, (iii) constant pressure at the fluid outlet, and (iv) non slip conditions at the wall and particle surfaces. In mesh design, mesh was generated after designing geometrical model. First mesh was generated on the surface of granules and reactor wall. The last part was interpolation of surface mesh and making a good 3D mesh. In this simulation tetragonal and hexagonal hybrid mesh was used, which mesh dimensions was 1 mm.
Navier-Stokes equations and energy balance were solved with kinetic equations of n-heptane cracking [10]. The equations were solved using commercially available finite volume code software Fluent 6.0. The fluid was assumed to be incompressible, Newtonian, and in a laminar flow regime (Re~480). n-heptane was chosen as the simulation fluid, for which the constants were available in the software database. The incompressible ideal gas law (for density), SIMPLE (for viscosity) and the first order upwind (for energy and momentum) were applied to simulate of this process. Due to the 3D geometrical model and intricated equations segregated method with implicit formulation was used. In order to model the experimental product yields, the large numbers of free radical reactions were approximated by a molecular model, consisting of a first-order primary reaction and 24 secondary reactions. The primary step represents the combined effect of the initiation, propagation, and termination reactions at low conversions, whereas the additional reactions at higher conversions are accounted for by the secondary reactions.
The model developed earlier for non-catalytic pyrolysis of n-heptane was modified by Pant and Kunzru [7]. A similar molecular model has also been successfully used to correlate the product yields during the pyrolysis of naphtha by Kumar and Kunzru [11]. The development of the model was based on the experimental observation that the variation of product selectivity’s with conversion was not affected by the catalyst. Thus, for catalytic pyrolysis only the rate constant and the activation energy of the first-order primary step were changed, whereas the kinetic constants of the secondary reactions were the same as that used for modeling the thermal pyrolysis data. In the catalytic pyrolysis model, the coke deposition and gasification reactions have not been accounted for. The final set of reactions, together with the preexponential factors and activation energy for each reaction, is shown in Table 1.
| Reactions | PreExp factor | Ea (kJ.mol-1) | ||
|---|---|---|---|---|
| Primary reaction | ||||
| 1 | n-heptane→ 0.43H +0.42CH +1.22C H +0.1C H +0.31C H +0.005C 2 4 2 4 2 6 3 6 H +0.21C H +0.37C 3 8 4 8 4 | 1.7²×103 | 103.8 | |
| Secondary reactions | ||||
| 2 | C H ↔ C H +H 2 6 2 4 2 | 4.65×10¹³ | 273 | |
| 3 | C H ↔ C H + CH 3 6 2 2 4 | 7.28×10¹² | 273.5 | |
| 4 | C H +C H → C H 2 2 2 4 4 6 | 1.03×10⁹ | 172.7 | |
| 5 | 2 C H → C H +CH 2 6 3 8 4 | 3.75×10¹² | 273.1 | |
| 6 | C H + C H → C H +CH 2 4 2 6 3 6 4 | 7.08×10¹⁰ | 253 | |
| 7 | C H ↔ C H + H 3 8 3 6 2 | 5.89×10¹⁰ | 214.7 | |
| 8 | C H → C H +CH 3 8 2 4 4 | 4.69×10¹⁰ | 211.8 | |
| 9 | C H + C H → C H + C H 3 8 2 4 2 6 3 6 | 2.54×10¹⁰ | 247.2 | |
| 10 | 2C H → 3C H 3 6 2 4 | 7.38×10¹² | 268.6 | |
| 11 | 2 C H → 0.3C H + 0.14C + +3CH 3 6 n 2n-6 4 4 | 2.5×10¹¹ | 228.1 | |
| 12 | C H +C H → C H 3 6 2 6 4 8 | 1×10¹¹ | 251.2 | |
| 13 | n-C H → C H + CH 4 10 3 6 4 | 7×10¹² | 249.7 | |
| 14 | n-C H → 2 C H +2 C H 4 10 2 4 2 6 | 7×10¹⁴ | 295.9 | |
| 15 | n-C H → C H + C H 4 10 2 4 2 6 | 4.1×10¹² | 256.6 | |
| 16 | n-C H → C H +H 4 10 4 8 2 | 1.64×10¹² | 261 | |
| 17 | C H → 0.41C H +0.19C + 4 8 n 2n-6 4 | 2.08×10¹¹ | 212.2 | |
| 18 | C H ↔ C H +H 4 8 4 6 2 | 1×10¹⁰ | 209.3 | |
| 19 | C H + C H → B+2H 4 6 2 4 2 | 8.38×10⁶ | 144.7 | |
| 20 | C H + C H →T+2H 4 6 3 6 2 | 9.74×10⁵ | 149.2 | |
| 21 | C H + C H → EB+2H 4 6 4 8 2 | 6.4×10¹¹ | 242.4 | |
| 22 | 2 C H → ST+2H 4 6 2 | 1.5×10⁶ | 124.3 | |
| 23 | C + → 1.16(C H + C H ) 4 2 4 3 6 | 9.1×10¹² | 226 | |
| 24 | C + →1.16(CH + C H ) 4 4 4 6 | 2.35×10¹² | 230.2 | |
| 25 | C + → 1.16(CH + C H ) 4 4 4 6 | 4×10¹¹ | 230.2 |
Table 1: Primary reaction and secondary reactions.
In this Table, CnH2n-6 denotes the aromatics and the average molecular weight of this fraction was taken to be 90, whereas the average molecular weight of the C4 + fraction was assumed to be 80. In the thermal zones, the rate constant for the primary reaction was calculated using published kinetics, whereas, for the secondary reactions, the constants given in Table 1 were utilized. In the catalytic zone, the non- catalyzed primary reaction was accounted for in the void space between the catalyst particles and in the pore space within the catalyst, whereas the catalyzed primary reaction proceeded on the catalyst surface. It was assumed that, in the catalytic zone, the secondary reactions only took place in the gas phase between the particles and in the pore space. The reactions, taken place in the pore spaces were ignored.
The primary goal parallel processing is to reduce calculation turn around times by using multiple processors (CPUs). In this simulation each processor has its own (private) memory associated with it. The processors communicate with each other through a socket communicator, or MPI. Message-passing software is loaded on every computer in the cluster and a Windows process is started. Through the interface, computers coordinate their tasks, such as sending and receiving arrays, synchronizing, and performing global operations (such as summations over all cells), by sending and receiving messages to and from one another.
Correction of the First Reaction Coefficients
Kunzru investigated his model (reaction 1) for cracking of n-heptane in one-dimensional PFR reactor. The differences between this work and kunzru model were 3D geometry of reactor, catalyst granules, effects on the fluid regime and Navier-stokes equation which cause the simulation was more real. So the molecular model needs to modify. Modification of molecular model was done using try and error method and modified model was developed. In this study, a 25 molecular model was investigated in 3D reactor using CFD
and the model was developed and corrected for 3D geometry (reaction 2). This equation indicates the correction of first reaction coefficients. Equation (1) is first reaction of kunzru n-heptane 0.43H 0.42CH 1.22C H 0.1C H 0.31C H 0.005C H 0.21C H 0.37C 2 4 2 4 2 6 3 6 3 8 4 8 4 + → + + + + + + + (1) n-heptane 0.2H 0.22CH 1.35C H 0.02C H 0.008C H 0.001C H 0.35C H 0.41C 2 4 2 4 2 6 3 6 3 8 4 8 4 + → + + + + + + + (2)
Model of Coke Formation
The coke deposition process in n-heptane pyrolysis can be divided into two stages the initial coke deposition stage and the steady-state coke deposition stage. In the initial stage, the coking rate is increased, but as reaction proceeds, the coke depositor surface is gradually covered and passivated with the deposited coke. At this point, the coking rate gradually decreases and finally tends to a steady-state value; this coking rate is called the steady state coking rate. The initial coke deposition stage is a surface reaction controlled process. In the meantime, as the residence time is increased, the conversion increases while the mass-transfer coefficient decreases; therefore, the steady-state coke deposition stage is also a surface reaction controlled process. Due to these uncertainties, only simplified models were postulated. In various models, the coke deposition reactions are always expressed as an overall reaction during which coke is formed through one step, which can be shown as follows:
coke precursors coke → (3) The rate of the above equation is n * * c ) (C k r = Where k* is the Preexponetial factor and is equals to k*=A*exp (-E*/RT).C* is also equals to C*=F*P/FRT, with substituting of equations of K* and C* we equation (3) rewritten as follows:
* . *(C*) *exp E F P n r k A c RT FRT − = = (4) Based on the above-mentioned in catalytic cracking coke precursors produce coke and coke precursors made by olefins. Regarding to Kunzru model, CnH2n-6 are the most important coke precursors. The coking model is:
coke → H C 6 - 2n n (5)
where in kunzru model Ea and pre exponential values of this reaction are 106.8 kJ.mol-1 and 2.07×10¹⁸ respectively.
Results and Discussion
Validating Model in 3D Geometry with CFD
In order to validating, the experimental data and CFD
model and the Equation (2) is the first reaction of modified model.
simulation results are compared in Figures 2-4. It should be noted that the length of reactor was considered at z-direction. The reactor length was divided to 14 sections. Mass flow rate of species at each section was predicted by CFD. The conversion of n-heptane and yield of the products are calculated in each section, which are present in Table 2. It is seen that the conversion of n-heptane increases along the reactor and at the end of reactor its conversion becomes 86.94 %.
| Surface | C H 7 16 | C H 2 4 | C H 4 8 | C4+ | C H 4 6 | CH 4 |
|---|---|---|---|---|---|---|
| z-1 | 13.77 | 5.09 | 1.53 | 3.52 | 0.12 | 1.38 |
| z-2 | 26.17 | 10.93 | 2.8 | 5.48 | 0.43 | 2.75 |
| z-3 | 35.81 | 16.17 | 3.69 | 6.28 | 0.77 | 3.96 |
| z-4 | 44.35 | 20.85 | 4.35 | 6.47 | 1.11 | 4.98 |
| z-5 | 51.79 | 25.01 | 4.79 | 6.33 | 1.43 | 5.92 |
| z-6 | 58.67 | 28.09 | 5.04 | 5.97 | 1.68 | 6.36 |
| z-7 | 63.08 | 31.4 | 5.31 | 5.7 | 1.94 | 7.43 |
| z-8 | 67.76 | 34.15 | 5.45 | 5.31 | 2.16 | 8.12 |
| z-9 | 71.62 | 36.63 | 5.5 | 4.87 | 2.35 | 8.7 |
| z-10 | 75.2 | 38.56 | 5.48 | 4.4 | 2.52 | 9.28 |
| z-11 | 78.42 | 41.32 | 5.48 | 3.96 | 2.71 | 10.02 |
| z-12 | 81.65 | 42.97 | 5.31 | 3.47 | 2.83 | 10.6 |
Table 2: Conversion yield of species along reactor.
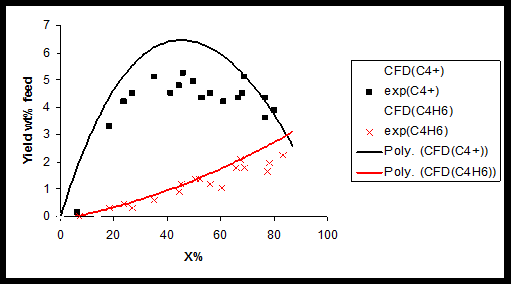
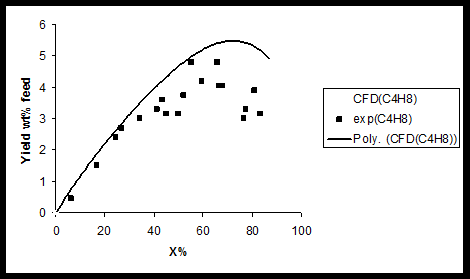
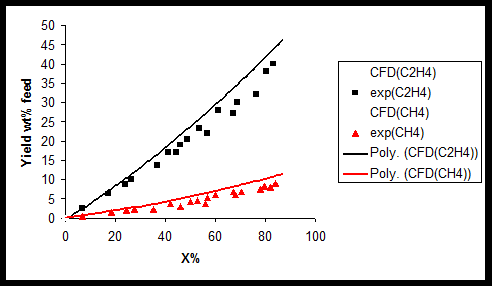
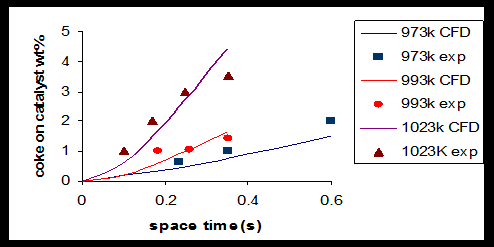
In addition results of product species conversions obtained by experimental and CFD simulation are compared for 1-butene (Figure 2) ethylene, methane (Figure 3) 1, 3-butadiene, and C4 + (Figure 4) at T=1023 K. As can be seen in these figures there is a good agreement between CFD results and experimental data. In the case of C4 + and 1-butane diagram there is a maximum point in the curve due to secondary reactions. During primary reaction, C4 + and 1-butane are produces and reach to a maximum yield and then due to secondary reactions, they are converted to coke precursors, coke and other olefins. Amount of coke, deposited on catalyst, calculated at different temperatures (973,993 and 1023K) using CFD, are present in Table 3.
In order to evaluate the performance of CFD simulation in cracking process, the Kunzru experiments were simulated [11], and then simulation results and experimental data were compared. The result of this study is shown in Figure 5. It is clear that there is a good agreement between these results. These studies indicate the high ability of CFD in simulation of chemical process.
| Temperature (K) | Residence time (s) | Coke/catalyst ratio ( Wt%) | Coke deposition Rate (Kg.m-2.s-1) |
|---|---|---|---|
| 0.1 | 0.36 | 1.61×10⁻⁷ | |
| 773 | 0.2 | 0.76 | 3.32×10⁻⁷ |
| 0.3 | 1.51 | 6.6×10⁻⁷ | |
| 973 | 0.1 | 0.48 | 1.61×10⁻⁷ |
| 0.2 | 1.38 | 3.32×10⁻⁷ | |
| 0.3 | 2.96 | 6.6×10⁻⁷ | |
| 1023 | 0.1 | 0.616 | 2.68 ×10⁻⁷ |
| 0.2 | 1.96 | 8.67×10⁻⁷ | |
| 0.3 | 4.43 | 1.98×10⁻⁷ |
Table 3: Weight percentage of coke on catalyst at various temperatures.
Fluid Analysis
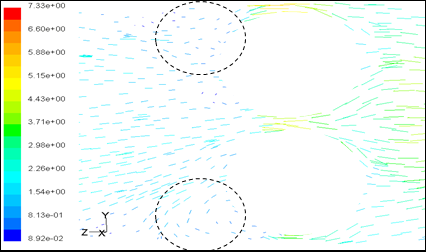
In order to more study, and obtaining the more view of the fluid flow and production contours, CFD was used. The velocity vectors shown in Figure 6, corresponds to a bed section passing through the particle of catalyst in the y-z plane. This section clearly shows the circulatory flow typical near particle-particle contact points, the strong radially directed flow components immediately before and immediately following a particle, and regions of reverse flow and near-stagnant flow next to the walls. Thus, in some parts of the bed, flow is rapidly bypassing the packing in the wall regions, whereas in other parts downstream of wall- particle contact points, the flow is slow, and even backflow takes place. Accelerated flow can be seen in the narrow interstices between particles. The region of near-stagnant flow corresponds to the contact point of two of the particles that have been removed for more clarity.
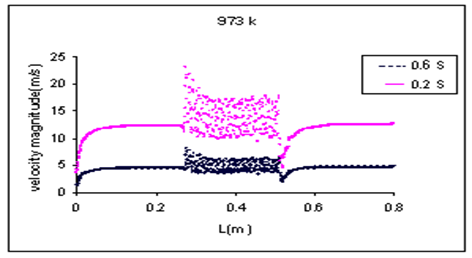
Velocity magnitude of fluid along the reactor is shown in Figure 7. As can be seen in this figure distribution of velocity magnitude in the catalyst bed is more than the other places due to stagnation points, radial velocities and vorticity in the catalyst bed, which cause high-pressure drop and more residence time of fluid in the reactor.
These fluid parameters will influence on heat transfer and chemical reactions. Comparing the velocity magnitude in two space-time (0.6 and 0.2s) indicate that the velocity magnitude increases with increase of residence time.
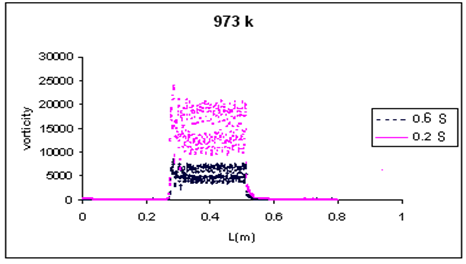
In addition, using CFD, we studied the effect of vorticity on coke deposition in the reactor. The vorticity along the reactor is shown in Figure 8. As can be seen in this figure in high vorticity places coke deposition is more because of the relatively high residence time in these places. When the flow is passing through catalyst granules, stagnation points and vorticties can be seen in catalyst bed. There is a minus gradient of pressure in these points and it causes the more pressure drop in the catalyst bed.
In these points the velocity vectors are zero and residence time in these points are more than other points, which indicates that coke is more than the other points. Figures 7 and 8 show velocity and vorticity in low residence time is more than high residence time and it had some effect in coke deposition contours which will discuss later.
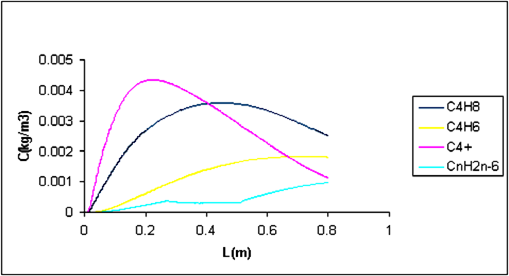
Coke Precursor’s Profile
Furthermore, profiles of coke precursors along the reactor were predicted by CFD. Coke precursor’s profiles at two different resident times are shown in Figure 9. C4H8, C4H6 and C4 + are main products that produce CnH2n-6 as a lump of coke precursors in secondary reactions. At space time of 1.93s, the concentration profiles of species show a maximum for C4H8, C4H6 and C4 + species due to secondary reactions. CnH2n-6 concentration profile was increased in the reactor but in catalyst zone, increasing of CnH2n-6 concentration profile has low slope because the coke formation occurs on the catalyst bed.
At the third part of the reactor, the CnH2n-6 is produced with high slope, because coke formation from CnH2n-6 only takes place from thermal reactions.
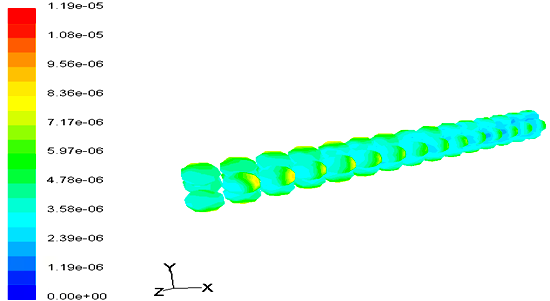
Coke Formation Contours
Coke deposition rate contours on catalyst surface in different residence times are shown in Figures 10 & 11.
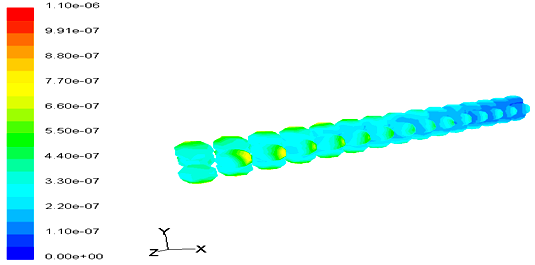
These figures also indicate that the coke deposition rate in catalyst bed in low residence times is more monotonically. This occurs due to the vorticity and stagnant points are effective parameters in coke deposition profiles. In low residence time the vorticity and stagnant point more than the low residence time and this make more time to form coke at the first stages of catalyst bed and finally cause coke formation contours become less monotonically in low residence time.
Conclusions
Catalytic cracking of n-heptane was simulated in a fixed bed reactor using CFD and molecular model was presented in 3D reactor. n-heptane Catalytic cracking modeling was promoted using CFD which had been developed before and the molecular model was modified to more real geometry of reactor. CFD made it possible to predict of coke deposition rate in fixed bed reactor. Stagnation points and vorticity are two important factors on coke deposition. Coke precursor’s profiles were investigated in the reactor, which there is a maximum point in the profiles due to secondary reactions. It is concluded that CFD is a suitable tool for study of chemical reactions and fluid regime. CFD gives more information about fluid dynamics of chemical process. The simulation gives an insight about fluid dynamics at the reactor and helps us in the design of the reactor for a defined process.
Nomenclature
| CFD | Computational Fluid Dynamics |
|---|---|
| N | ratio of reactor diameter to catalyst diameter |
| T | Temperature |
References
-
Ranade J, Joshi JB (2003) Computational Fluid Dynamics for Designing Process Equipment: Expectations, Current Status, and Path Forward. Ind Eng Chem Res 42(6): 1115-1128.
-
Yin FH, Sun CG, Afacan A, Nandakumar K, Chuang KT (2000) CFD Modeling of Mass-Transfer Processes in Randomly Packed Distillation Columns. Ind Eng Chem Res 39(5): 1369-1380.
-
Dixon AG, Nijemeisland (2001) CFD as a Design Tool for Fixed-Bed Reactors. Ind Eng Chem Res 40(23): 5246- 5254.
-
Logtenberg SA, Dixon AG (1998) Computational fluid dynamics studies of fixed bed heat transfer1. Chem Eng & Process 37(1): 7-21.
-
Nijemeisland M, Dixon AG, Stitt EH (2004) Catalyst design by CFD for heat transfer and reaction in steam reforming. Chem Eng Sci 59(22-23): 5185-5191.
-
Nijemeisland M, Dixon AG (2001) Comparison of CFD simulations to experiment for convective heat transfer in a gas–solid fixed bed. Chem Eng J 82(1-3): 231-246.
-
Pant KK, Kunzru D (1997) Catalytic Pyrolysis of n-Heptane: Kinetics and Modeling. Ind Eng Chem Res 36(6): 2059-2065.
-
Towfighi J, Sadrameli M, Niaei (2002) A Coke formation mechanisms and coke inhibiting methods in pyrolysis furnaces. Journal of Chemical Engineering of Japan 35(10): 923-937.
-
Salari D, Niaei A, Chitsaz Yazdi P, Derakhshani M, Nabavi SR (2007) CFD Flow and Heat Transfer Simulation for Empty and Packed Fixed Bed Reactor in Catalytic Cracking of Naphtha. Int J Chem Mol Eng 1(5): 44-47.
-
Niaei A, Salari D, Hosseini SA, Nabavi SR, Jodaei A (2008) CFD Simulation of Catalytic Oxidation of Ethyl acetate over Cr-HZSM-5 catalyst. Int J Chem React Eng 6(1): A104.
-
Kumar P, Kunzru D (1985) Modeling of Naphtha Pyrolysis. Ind Eng Chem Process Des Dev 24(3): 774-782.
- Nigeria’s Vulnerability in the Face of Global Energy Policy
- A Simulation Study of Investigation of Optimum Oil Production Performance by Applying Various Gas Injection Methods in Oil Reservoir
- Characterization of Permo-Triassic Reservoirs through Thermal Maturity Assessment of Westphalian Source Rocks in the Cheshire Basin
- Influence of Microwax on the Rheological and Thermal Behaviour of a Wax Crude Oil
- Real-Time Monitoring and Performance Optimization of Steam Injection in Heavy Oil Reservoirs Using Fiber Optic Sensing and Integrated Predictive Simulation Models
- Rapid On-Site Determination of the Total Petroleum Hydrocarbon Content of Soils by Handheld Fourier Transform Near-Infrared Spectroscopy: Development of a Global, Site- and Scanner- Independent Calibration Model