Identification of the Remediation of Contaminated Soil with Oil through the Flotation with Surfactant by Molecular Fluorescence Related to the Analysis of Multivariate Data
The countless cases of environmental contamination by oil activities have grown significantly over time. This implies the need to develop new techniques for recovery of the affected areas. The flotation technique has been highlighted for this purpose and associated with other techniques, either chemical, physical or biological, improves their efficiency, and consequently, the recovery of location will be effective. This work aims to evaluate the remediation of two horizons of Typic Quartzipisamment originating in Recôncavo, which were contaminated artificially with oil and recovered using flotation technique, and from the Fluorescence Induced LED (FIL), associated with Analysis Components (PCA). In the emission spectra showing a reduction of contaminants that fluoresce (flourescent intensity) of the horizon A and C contaminated for the remedied, length of 480 nm, the decrease in fluorescence intensity from 1600 to approximately 800 u. Through the association between the analytical technique used and the multivariate analysis was possible to distinguish the horizons contaminated with oil from the remediated horizons with the prepared solution.
Introduction
The soil is particularly important, since it works as a complex reactor able to perform filtering functions, decomposition, neutralization, inactivation, storage, and others. Thus, acting as a protective barrier to other more sensitive ways such as hydrological and biological. A soil can be degraded for various reasons (chemical, physical and biological). In this context, the planning to recovery it is fundamental and recognize its physicochemical characteristics, particularly in potentially contaminated sites or even on sites contaminated artificially.
A contaminated soil is defined like one in which the concentration of the substances are higher than the concentration allowed and that implies in risk to the ecosystem and / or health of humans, animals that live on the place [1]. Therefore, the soil needs to be according to the norm of CONAMA n° 420 of December 28, 2009.
The physicochemical characterization of oil (real-time) is an important challenge to the petrochemical industries and environmental agencies are currently confronting. The oil classification is done by conventional analysis, distillation TBP (True Boiling Point), which provides chemical information relevant for the adjustment of critical parameters during the process in the refinery [2]. The disadvantage of TBP distillation is the analysis time, the involvement of high- cost and skilled workers.
For the oil industry, the relation between signal (spectrum) and physical parameters, such as API density or chemical composition, can be the beginning of a correlation model that saves time and money in the refining process. With this model can predict the physical or chemical properties that characterizes the oil and refine the distillation column operating parameters [3]. This characterization will provide the source oil in which caused the environmental pollution in case of accidents and can contribute to better implementation of the recovery method of the area by known parameters which characterize the contaminant.
On the other hand, environmental protection agencies are constantly working in conjunction with the government for the development of techniques for detecting oil spills [4], identification, oil concentration and its derivatives in water or soil [5, 6] in order to work together for the improvement and conservation of the environment in general.
The surfactants constitute a class of important chemicals which are widely used in many industrial sectors, and they still highlighted by the use in the removal of oily contaminants [7]. However, environmental concerns about the use of environmentally friendly standards is increasing, therefore, it is important to search for surfactants of natural origin, which are called biosurfactants [8].
In a water based solution, the surfactants tend to disperse in the interfaces between the different degrees of polarity oil / water and water / oil [9]. The bio-surfactants decrease the surface tension and increase the ability of emulsification / demulsification [10] and due to its high degree of degradability and low toxicity are considered sustainable [11]. Its use in the remediation is fundamental to assist in the removal of the most quantity of oil presents in the affected area. In contrast, there is remediation through flotation technique, sometimes associated with the use of bacteria and other like a simple separation technique [12].
In parallel to the development of bioremediation using microorganisms, the process of separation by flotation is being proposed and used as a clean and efficient technique for the removal of oils and greases, requiring only the use of biosurfactant, glycerin, saline water with water production to emulsion formation, promoting oil / soil. The biosurfactant assists in oil removal, leaving the pollution-free soil [13].
The recovery of contaminated soils with organic contaminants has been a big challenge because they are complex substances and present affinity for various contaminant compounds, being essential to the application of methods and efficient processes for removing them, however, some remediation techniques are not enough to completely remove the compounds or reduce their concentration in order to satisfy the values determined and permitted by law. So, the need for improvement of existing techniques has increased in recent years [14].
The remediation can occur in two ways treating ex situ, which is to excavate the contaminated soil or pump groundwater and get it to treatment in batch reactors (slurry phase) or solid phase (landfarming, biopilhas and composting). This method provides a shorter time for remediation, and is more certainty about the uniformity of treatment [15].
Since the in situ treatment consists to stimulate the activity of microorganisms by adding nutrients (nitrogen and phosphorus), adjustment of temperature and / or introduction of oxygen, which can be done by tube or sprinkler or wells injection, by venting (bioventing) and also underwater sprinkling (air sparging). This method requires a longer period of time and does not guarantee a uniformity of treatment due to the variability and characteristics of the soils, reducing the effectiveness of the process [16]. For purposes of determining how much the efficient remediation of the contaminated local was, we used the analytical technique of Fluorescence Induced LED (FIL).
Fluorescence spectroscopy has been used in the oil industry for analysis and classification of different samples. The literature offers a number of comments that describe the advantages and disadvantages inherent in the technique [17, 18]. The typical fluorescence parameters such as intensity, emission wavelength, induction time have been related to the physical characteristics of oil, such as chemical composition, density and viscosity. Fluorescence spectra work as fingerprints of organic compounds with aromatic rings in its chemical composition, facilitating their identification when on site affected by contamination by oil spill [19].
Multivariate data analysis, PCA (Principal Component Analysis) associated with geochemical analyzes have been used to identify the efficiency of the applied remediation methods. The PCA consists of making mathematical treatments in unit or spectraormapsor pictures data, aiming at an exploratory and classification of data analysis as well as planning and optimization of an experiment. Spectroscopy Fourier transform in the middle and near infrared associated with PCA has been used to identify adulteration in diesel oil [20].
To develop this work, it was used Fluorescence Induced by LED (FIL) in combination with PCA to discriminate samples of horizons between A and C soil under study artificially contaminated with oil, samples of the same remedied horizons by flotation technique ex situ, using surfactant solution prepared with plant extract (biosurfactant), glycerin (surfactant), brine and water production. This statistical analysis, PCA, works with the number of variables reduced to a few dimensions, allowing the detection of the major similar patterns and the correlation between the variables in the experiment, making possible the separation of the samples.
Materials and Methods
Description of the Collected Soil Area
The soil that will be used in the experiments was collected near the island of Itaparica, Bahia, the ReconcavoBahiano region (Figure 1), in order to delimit the study area. The coordinates of the collection local are: 8562860 mS / 521932 mE, an increase of 46 m and an average annual temperature of 25 ° C [21].
Near the collection area there are not human activities on site as contamination by oil and/or its derivatives. Because it is a soil that has characteristics similar to other type of soil susceptible to contamination [22].
![Figure 1: Location of collection area [12].](/fulltextimages/5362/fig_1.png)
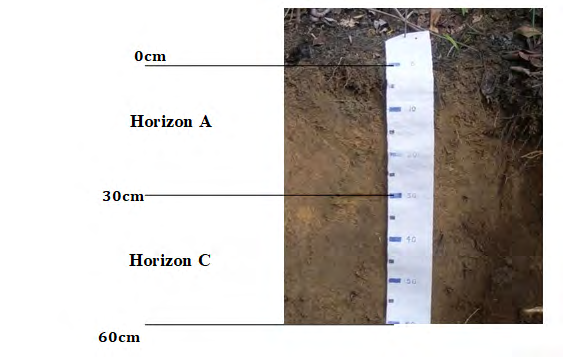
For the characterization of the soil studied was collected horizon (HA) and the horizon C (HC), Figure 2. Each horizon was collected through a manual tract and stored in a cardboard box lined with aluminum foil, with the objective of avoid any interference in its composition. Samples were sent to the Kinetics Laboratory of Molecular Dynamics, located at the Chemistry Institute of UFBA, to be characterized.
Experimental Procedure of Analysis
The soil was contaminated with oil and then will underwent preliminary physical-chemical analysis (reference ground) for future comparison soil after remediation with the solution prepared from the plant extract (biosurfactant) plant belonging to Araceae family and addition of glycerin, brine and production of water, which was added to the contaminated soil, then subjected to electrical mechanical stirring for 15 minutes at 40°C, which function is to accelerate the reaction. Then, it is possible to observe phase separation of soil, water and petroleum. The process of decontamination was performed in triplicate, to the horizons A and C. Contaminated soil samples were collected and after remediation were undertaken Fluorescence Induced Fluorescence LED analysis, in order to verify and identify the spectra obtained by intensity each fluorescence spectrum of the possible compounds soil (contaminated) before treatment (remedied) and after. After treatment, the samples were left to stand for 24h, then was filtered to remove the supernatant liquid phase, which consists of the oil and the solution. The treated soil was dried in an oven at 60 ° C for 20 minutes three times in a cycle between 1 hour intervals. Then, preparation of samples for fluorescence analysis was begun.
Extraction and Concentration of Samples
Initially, it was done the collect of the plant in accordance with the methodology indicated by the Herbarium, located at the Institute of Biology of the UFBA, in which the plant was brought to the laboratory for pre-treatment that eliminates interferents (insects, leaves and twigs, etc.), then the leaves were removed and ground in a blender, Mondial mark with addition of 1 L of distilled water in which the plant extract was made of the plant. It was stored in amber glass and after it has been put to rest for 24 hours.
To extract and concentrate the substances / compounds present in the soil, it was made the weighing about 2 grams from each sample and added 20 mL of hexane organic solvent, in an ultrasound bath made by Quimis, model USC 2800A, 40kHz frequency, for 30 min cycles [23]. The extracts were concentrated in equipment route evaporator, requiring dilution of samples of contaminated soil, due to the high concentration of extract.
Fluorescence Induced by Led (FIL)
To perform the test, the equipment was set up with centered band of excitation in the region of 468nm and emission range 300 to 1000 nm, and with an induction time of 100ms. The samples were placed in a quartz cuvette (1 cm) for analyses in the equipment Q798FIL and for nearby sample the same was acclimated to the next higher concentration sample with the previous sample and Quimis® software. The spectra obtained are easily reproduced in Origin Pro.8® software.
Results and Discussion
The determination of the organic material followed adapted tests of the author Davies [24], the calcination method, which consists in weighing 4 g of soil samples and bring the flask temperature to 500 ° C for 5h. Table 1 shows the content of organic matter present in each horizon.
| Soil | Content the MO (%) |
|---|---|
| Horizon A | 5,25 |
| Horizon C | 4 |
Table 1: MO content for HA and HC [12].
Figure 3 shows the remediation of contaminated horizons in percentage of oil in the samples. Correlating the mass of contaminated soil with the mass of the remediated soil is possible to identify that the percentage oil significantly decreased after remediation with the prepared solution (formulation: plant extract (biosurfactant), glycerin (surfactant), brine and water production). It is observed that at the remedied horizon C (HC) presents a percentage of dopant lower than the horizon (HA), that can is associated with the amount of organic matter (OM) present in HC (Table 1).
![Figure 3: Percentage of oil for each soil horizon [12].](/fulltextimages/5362/fig_3.png)
To perform the statistical treatment of the data obtained in the molecular fluorescence analysis (FIL) initially using the Origin Pro.8® software, we calculated the average of the readings of the samples in triplicate, for more precision in the results, then exported to MatlabR2009b the software to generate the PCA.
Figure 4 shows molecular fluorescence emission spectra of soil samples contaminated soil and ground remedied with excitation through LEDs with centered band at 468 nm. It is noted that in Figure 4A the wave spectrum greater is the soil from horizon A in the study, whose change can be connected with the amount of organic material in this horizon when compared to the horizon C.
The fluorescence spectra of contaminated horizons A and C (HA and HC) show variation in the HA band that can be also associated with the amount of organic material, Figure 4B. With contaminated HA and HC spectra and remedied (Figure 4C and D), you can view the reduction of the contaminant by decreasing the spectra corresponding to the emission band when compared to the bands of contaminated horizons. Thus, it can be concluded that the efficiency of the method applied to remedy the affected area was effective and proven by Fluorescence Induced LED analysis.
![Figure 4: Emission wave length depending on the intensity of soil samples in natural, contaminated soil and remedied soil [12].](/fulltextimages/5362/fig_4.png)
For the preparation of those samples which had their spectra initially treated and arranged in a cube with the same dimensions: 7 x 2047 samples wavelengths 1 x emission wavelength excitation centered at 468 nm. The cube was transformed by unfold command MATLAB R2009b® these data were reorganized into a general matrix with the same dimensions: 7 x 2047 general matrix measuring 19 × 27,408. This matrix was processed by the mean-centering method and then subjected to multivariate analysis PCA with MATLAB R2009b®.
The PCA presented the data according to their similar characteristics and properties, forming groups of samples.
With three principal components (PC) explained 99.93% of the variance of the data being 71.97% for PC1, PC2, and 16.36% to 5.20% for PC3. With PC1 versus PC2 it was possible to separate the samples according to their chemical composition into three distinct regions shown in Figure 5 (ground in natural contaminated soil and remedied soil).
It is noted that the samples of horizons A and C contaminated and remedied were arranged on the right side in different quadrants 2 and 4 respectively, while the Horizons A and C in nature are disposed on the left side between the quadrants 1 and 3 (Figure 5).
![Figure 5: PC1 vs. PC2 of soil samples, contaminated soil and remedied plotted from data obtained on the LED Fluorimeter [12].](/fulltextimages/5362/fig_5.png)
Conclusion
From the studies in articles and academic papers related to the topic discussed, it is possible to see that the development of techniques for recovering contaminated area for industrial, petroleum and its products is growing due to the numerous cases of accidents and the dependence of these activities and products. The decontamination of soil using a solution prepared with biosurfactant formulation, glycerin, saline, water and produced water with flotation technique was identified by molecular fluorescence technique by means of fluorescence, it was confirmed from spectra and PCA that the remediation performed reached your goal, besides being a simple analysis, low cost.
Although the presentation of sample fluorescence spectra can be observed which results in the increase of the spectrum occurs in the horizon contamination with oil phase and a decrease when the remediation phase to the spectra obtained. According to multivariate data analysis was the grouping of the samples according to their chemical composition and similar characteristics, proving the application of flotation with the use of surfactants associated with multivariate data analysis It is possible to see how efficient the remediation the contaminated soil was.
References
-
Ramos EF (2013) Contaminação por diesel em argissolo vermelho-amarelo. Universidade Federal do Rio Grande do Sul, Porto Alegre, Brazil.
-
López-Gejo J, Pantoja PA, Sotello FF (2008) Electronic and vibrational spectroscopy for remote and online analisys and classification of crude petroleum. In: Montclaire KL (Ed.), Petroleum Science Research Progess. Nova Science Publisher, pp: 187-232.
-
Pantoja PA (2010) Caracterização do petróleo por técnicas espectroscópicas e sua utilização na avaliação e desenvolvimento de métodos de inferência em processo de refino. Universidade de São Paulo–USP, São Paulo, Brazil.
-
Fingas MF, Brown CE (1997) Review of oil spill remote sensing. Spill Sci & Technol Bull 4(4): 199-208.
-
Asher SA (1984) Ultravioleta resonance spectrmetry for detection and speciation of trace polycyclic aromatic hidrocarbons. Anal Chem 56(4): 720-724.
-
Lieberman SH, Inman SM, Theriault GA (1991) Laser- Induced fluorescence over optical fibers for real-time in situ measurement of petroleum hydrocarbons in seawater. OCEANS 91 Proceedings, USA, pp: 509-514.
-
Santos DKF, Rufino RD, Santos VA, Salgueiro AA, Sarubbo LA (2013) Syntesis and evalution of biosurfactant produced by Candida lipolytica using animal fat and corn steep liquor. J of Petrol Scien and Eng 105: 43-50.
-
Rufino RD, Luna JM, Campos-Takaki GM, Sarubbo LA (2014) Characterization and properties of the biosurfactant produced by Candida lipolytica UCP 0988. Eletro J of Biotechnol 17: 34-38.
-
Nitschke M, Pastore GM (2002) Biossurfactantes: propriedades e aplicações. Quím Nova 25: 772-776.
-
Luna JM, Rufino RD, Sarubbo LA, Campos-Takaki GM (2013) Characterization, surfasse properties and biological activity of a biosurfactant produced from industrial waste by Candida sphaerica UCP0995 for application in the petroleum industry. Collo And Surf B Biointerfaces 102: 202-209.
-
Rocha E Silva NMP, Rufino RD, Luna JM, Santos VA, Sarubbo LA (2014) Screening of pseudômonas species for biosurfactant production using low-cost substrates. Biocatal and Agricul Biotechnol 3(2): 132-139.
-
Agrawal A, Liu Y (2015) Remediation technologies for oil-contaminated sediments. Marine Pollution Bulletin 101(2): 483-490.
-
Mulligan CN, Yong RN, Gibbs BF (2001) Surfactant- enhanced remediation of contaminated soil: a review. Engineering Geology 60(1-4): 371-380.
-
Marques EJN (2012) Remediação de solo contaminado com Hidrocarbonetos derivados de combustíveis utilizando lavagem oxidativa. UNICAMP, São Paulo, Brazil pp: 173.
-
Nash J, Traver RP, Downey DC (1986) Surfactant- Enhanced in situ Soils Washing. Usep/Hwerl, Woodbridge ave, Edison NJ, Brazil, pp: 57.
-
Silva DN (2008) Remediação de solos impactados com poluentes orgânicos usando os reagentes de fenton. 124f. Tese (Doutorado em Engenharia Química), Escola Politécnica da Universidade de São Paulo, São Paulo, Brazil.
-
Ryder AG (2005) Analysis of crude petroleum oils using fluorescence spectrometry. Rev Fluoresc pp: 169-198.
-
Ellingsen L, Fery-Forgues S (1988) Application de la spectroscopie de fluorescence à l’étude du pétrole: le défi de la complexité. Rev Inst Fr Pét 53(2): 201-216.
-
Literathy P, Quinn M (2006) Monitoring of Petroleum- Related Environmental Contamination Using Fluorescence Fingerprinting. Water Practice & Technology 1(2): 1-9.
-
Meira M, Quintella CM, Ferrer TM, Silva HRG, Kamei AG, et al. (2011) Identificação de Adulteração de Biocombustível por Adição de Óleo Residual ao Diesel por Espectrofluorimetria Total 3D e Análise das Componentes Principais. Quím Nova 34(4).
-
Hatje V, Andrade JB (2009) Baía de Todos os Santos: aspectos oceanográficos. Edufba, Brazil, pp: 306.
-
Tormena CA, Barbosa MC, Costa ACS, Gonçalvez CA (2002) Densidade, porosidade e resistência à penetração em Latossolo cultivado sob diferentes sistemas. Scientia Agricola 59(4): 795-801.
-
Borges, Santana SM (2009) Advanced oil recovery (EOR) using crude glycerin (GB) co-product of biodiesel production. Universidade Federal da Bahia. Salvador, Brazil.
-
Davies BE (1974) Loss-on-ignition as estimation of soil organic matter. Soil Sci Soc Am J 38: 150-151.
- Nigeria’s Vulnerability in the Face of Global Energy Policy
- A Simulation Study of Investigation of Optimum Oil Production Performance by Applying Various Gas Injection Methods in Oil Reservoir
- Characterization of Permo-Triassic Reservoirs through Thermal Maturity Assessment of Westphalian Source Rocks in the Cheshire Basin
- Influence of Microwax on the Rheological and Thermal Behaviour of a Wax Crude Oil
- Real-Time Monitoring and Performance Optimization of Steam Injection in Heavy Oil Reservoirs Using Fiber Optic Sensing and Integrated Predictive Simulation Models
- Rapid On-Site Determination of the Total Petroleum Hydrocarbon Content of Soils by Handheld Fourier Transform Near-Infrared Spectroscopy: Development of a Global, Site- and Scanner- Independent Calibration Model