An Improved Modeling of Solid Propellant Fracturing to Produce Long Fractures in Wellbore Formations
Simultaneous ignition of an entire exposed surface required for accurate modeling of solid propellant fracturing process is difficult to achieve because wellbore fluids decrease flame spread rate and negatively impact burn propagation, and can extinguish portions of the burning propellant grain thereby resulting in slower pressure loading rates and insufficient energy for producing long fractures. A proposed system is that in which the propellant is protected from wellbore fluids by housing it in a vessel with a means for creating openings to allow combustion gases produced to flow into the wellbore. On this basis, a model was developed using mass and energy conservation laws, and applying a concept of choked flow in the openings to relate conditions in the wellbore to the vessel. The results of the peak pressure and pressure rise time obtained from the model for multiple-fracture regime agree well with the reported experimental results and thus establishing the validity of the model in predicting the wellbore pressure during solid propellant fracturing system. A star-shape burning surface is proposed for the propellant and calculations carried out proves it to be more effective as it provides more energy for producing long fractures essential for more flow of oil and gas from the reservoir into the wellbore than a conventional circular surface of the same burning area. The exterior angle of star-shape burning surface was found to be a function of the number of vertices of the star and it determines the progressive burning nature of the propellant.
Introduction
The increasingly high demand of oil and natural gas coupled with the decline in the availability of conventional resources (oil and natural gas) paved a way for research on how these resources can be obtained unconventionally. Then came, the idea of stimulating the low-permeability rocks through fracturing to create path for the oil and gas to flow into the wellbore. Solid propellant fracturing or high energy gas fracturing (HEGF) is a technology of stimulating wells by producing multiple fractures in the formation around the wellbore. The fractures are generated by high energy gas produced from burning a solid propellant. The high-pressure gas is also responsible for fracture extension by penetrating into the fractures created. Though HEGF is capable of creating multiple fractures, the short fracture length associated with this fracturing method is a major concern as long fractures are desirable because they can connect deeply into the formation for more exploitation of oil and gas. Besides the fracture creation, sufficient energy is also needed for the gas to penetrate deeply into the created fractures to produce long fractures.
The first scale experiments were carried out at the Nevada Test Site (NTS) in 1970 to compare the three basic ways of loading the wellbore with the propellant fracturing capable of producing multiple fractures. Sandia Laboratories performed series of field tests at the NTS to obtain more information about high energy gas fracturing technique. The summary of results for all the series of experiments performed at the NTS are: high energy gas fracturing produces multiple fractures, the propellant must have a right burn rate to produce the radial multiple fractures, and for the fractures to extend as much as possible, sufficient energy must be available for gas penetration effect or fracture pressurization that follows after the fracture initiation. These results opened a way for research on solid propellant fracturing system that will not only produce fractures but also generate sufficient energy to effectively pressurize the fractures for production of long fractures. Kutter HK [1] attempted to clarify the respective roles of stress wave and gas pressure in the fragmentation of an underground blast by studying the fracture process in the zone immediately around the borehole. Nilson RH [2] presented a computational model to predict the propagation of gas-driven fractures emanating from a pressurized borehole was presented. Research aimed at extending multiple fracturing technology, understanding the mechanism and application of the HEGF have been carried out [3, 4].
The experimental study on the high energy gas fracturing technique for geothermal well stimulation showed that multiples fractures could be created to link a water-filled borehole with other fractures [5]. The importance of stress waves on the initiation and propagation of radial fractures during the dynamic fracture process has been highlighted [6, 7, 8]. A numerical algorithm was proposed [9] to quantitatively simulate propagation of fractures around a pressurized borehole. Malhorta [10] performed an experimental study on the understanding of the pattern of fracture creation by some propellants.
Accurate modeling of propellant fracturing process requires a simultaneous burning of the entire exposed surface of the propellant and the availability of the exposed burning surface area calculation at each time as the burning progresses. This simultaneous ignition of exposed surface is actually difficult to achieve because of, principally, wellbore fluids (i.e., water, salts, acids, hydrocarbons, or other fluids) effects that may be encountered. This paper presents an improved modelling of high energy gas fracturing which addresses the wellbore fluids effects and thus aids in providing sufficient energy needed for fracture pressurization. The model presented has a new contribution in which the gas pressure in the borehole is calculated as a function of pressure condition of gas from burning propellant in the vessel. Thus, the difficulty in obtaining the true effective free volume of the borehole [11, 12] is avoided. Comparative analysis between star burning surface and circular burning surface for the propellant is presented. The burning surface nature of star propellant has a tendency of providing additional energy which contributes to fracture pressurization to obtain long fractures.
Model Formulation
Modeling Wellbore Pressure
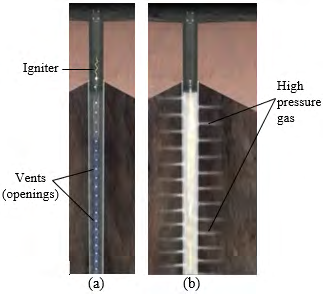
Figure 1(a) depicts a design system for solid propellant fracturing. The solid propellant is housed in a vessel to protect it from wellbore fluids. There are vents or openings on the wall of the vessel to allow high energy gases produced by the propellant to flow from the vessel into the wellbore as shown in Figure 1(b). The gas generated from the burning propellant is of high pressure and pressurizes the wellbore to create fracture on the formation around the wellbore. The gases also penetrate into the created fractures and if with sufficient energy they can cause long extension of the fracture into the formation before they are being absorbed into the formation.
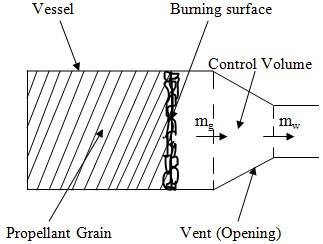
The wellbore pressure is modeled by considering a sectional part of the vessel with one opening on it as shown in Figure 2. All the vents on the vessel are identical and it is assumed that the gases coming out from each of the vents are of the same amount and same pressure. Thus, the pressure of gas from an opening is the average pressure of all the gases, from all the vents, released into the wellbore. Figure 2 shows the sectional part with the gas generated from the burning propellant flowing into a control volume system and then exits into the wellbore through the opening. Mass balance is taken around the control volume in which the rate of accumulation of mass in the control volume is equal to the mass rate of gas entering the control volume minus the mass rate of gas leaving the control volume.
The mass balance equation is given by:
$$ \frac {d m}{d t} = m _ {g} - m _ {w} (1) $$
The term on the left-hand side of Equation (1) describes the mass rate of accumulation of gas in the control volume. The first term mg and the last term mw on the right-hand side of Equation (1) are the mass rate of gas entering and the mass rate of gas leaving the control volume respectively. Assuming an ideal gas, the mass of gas accumulated in the control volume can be expressed as:
$$ m = \frac {P _ {v} V}{R T} (2) $$
where Pv is the pressure of gas in the control volume; R
is the gas constant; V and T are the volume of gas and the
temperature of gas in the control volume respectively. The
mass rate of solid propellant that is burning is the same as
the mass rate of gas propellant generated which is the mass
rate of gas entering the control volume. Thus, the mass rate
of gas entering the control volume can be expressed in terms
of solid propellant properties and it is given by:
$$ m _ {g} = \rho_ {p} s _ {b} r \tag {3} $$
where ρp, Sb, and r are the density, the burning surface area, and the burn rate of solid propellant respectively. The mass rate of gas leaving the control volume is determined from:
m v A w w w o ρ = (4)
where ρw is the density of gas leaving the control volume; v_w is the velocity of gas leaving the control volume; _Ao is the area of the opening for the gas leaving the control volume. The velocity v_w and the density ρ_w of the gas leaving the control volume cannot be easily determined. Moreover, the parameter of the gas which is of utmost interest is pressure. Thus, Equation (4) can be expressed in terms of pressure as:
$$ m _ {w} = P _ {v} A _ {O} K \tag {5} $$
where Pv is the pressure of gas in the control volume which is also referred to as the pressure of gas in the vessel. The details of the derivation of Equation (5) from Equation (4) are given in Appendix A. Substituting Equation. (2), (3), and (5) in Equation (1) gives:
$$ \frac {d \left(\frac {P _ {v} V}{R T}\right)}{d t} = \rho_ {p} s _ {b} r - P _ {v} A _ {o} K $$ (6) Unlike the pressure and the volume of the gas in the control volume which are changing with time, the temperature T and gas constant R are constants and upon carrying out the product rule on the derivative, Equation (6) becomes:
$$ \frac {1}{R T} \left(V \frac {d P _ {v}}{d t} + P _ {v} \frac {d V}{d t}\right) = \rho_ {p} s _ {b} r - P _ {v} A _ {o} K $$ (7) Expanding the left-hand side of Equation (7) gives:
$$ \frac {V}{R T} \frac {d P _ {v}}{d t} + \frac {P _ {v}}{R T} \frac {d V}{d t} = \rho_ {p} s _ {b} r - P _ {v} A _ {0} K \tag {8} $$ The second term of the left-hand side of Equation (8) consists of a derivative which is the volumetric rate of gas in the control volume and the coefficient of the derivative is an equivalent expression for the density of gas ρv in the control volume. With the volumetric rate of gas in the control volume expressed as the product of burning surface area Sb and the burn rate r of the solid propellant, Equation (8) becomes:
$$ \frac {V}{R T} \frac {d P _ {v}}{d t} + \rho_ {v} s _ {b} r = \rho_ {p} s _ {b} r - P _ {v} A _ {o} K \tag {9} $$ The second term of the left-hand side of Equation (9) is transferred to the right-hand side and upon factorizing, it gives:
$$ \frac {V}{R T} \frac {d P _ {v}}{d t} = \left(\rho_ {p} - \rho_ {v}\right) s _ {b} r - P _ {v} A _ {o} K \tag {10} $$ The density of a solid is generally much greater than the density of a gas. Hence, ρp - ρv ~ ρp. Also, at steady condition, the pressure derivative of the term on the left-hand side of Equation (10) becomes zero. Thus, Equation (10) results in:
$$ P _ {v} A _ {o} K = \rho_ {p} s _ {b} r \tag {11} $$
The burn rate r of solid propellant is expressed as:
$$ r = a P _ {v} ^ {n} \tag {12} $$
Substituting Equation (12) into Equation (11) and making the pressure Pv the subject of formula, Equation (11) gives:
( ) 1 1 n as p b Pv KAo
ρ − $$ = \left(\frac {a s _ {b} \rho_ {p}}{K A _ {o}}\right) ^ {1 /} $$
(13) where Pv is the pressure of gas in the vessel. The pressure Pw of gas in the wellbore is related to the pressure Pv of gas in the vessel (details of the relationship expressed by Equation (14) are given in Appendix A) as follows:
( )1 2 γ γ $$ = \left(\frac {2}{\gamma + 1}\right) ^ {\gamma / (\gamma - 1)} $$
Pw Pv (14)
1 γ Therefore, the pressure of gas in the wellbore is determined from:
( ) ( ) 1 1 1 2
n as p b Pw KAo
$$ , = \left(\frac {a s _ {b} \rho_ {p}}{K A _ {o}}\right) ^ {1 / (1 - n)} \left(\frac {2}{\gamma + 1}\right) ^ {\gamma / (\gamma - 1} $$ γ γ ρ (15)
1 γ where Pw is the pressure of gas in the wellbore; Sb is the burning surface area of the solid propellant; a and n are burn rate constants; γ is the specific heat ratio of gas; ρp is the density of solid propellant; Ao is the area of opening, and K (its derivation is presented in Appendix A) is defined by the expression:
( ) ( ) 1 2 1 2
γ γ γ $$ : = \left(\sqrt {\frac {\gamma}{R T _ {v}}}\right) \left(\frac {2}{\gamma + 1}\right) ^ {(\gamma + 1) / \left[ 2 (\gamma - 1) \right]} $$ (16)
1 K RTv γ
Time Web Burnt Model
A characteristic of burning propellants is that it proceeds by layers with the burning front always normal to the surface. The propellants decrease in size by burning but tend to maintain the geometrical shape of the initial burning surface as the burning progresses. The amount of propellant which can be burnt at a time is known as web. A web is bound by two successive burning surfaces. Figure 3 shows the cross-section of a web with the successive burning surfaces indicated by blue and red colors respectively. The pressure and hence the burn rate at each burning surface of the web can be determined from Equation (13) and Equation (12) respectively. From the burn rates of the two surfaces of a web, the average burn rate of a web can be determined from:
$$ \bar {r} = \left(a P _ {i} ^ {n} + a P _ {i + 1} ^ {n}\right) / 2 $$
(17) where Pi and Pi+1 are the pressures at the two successive burning surfaces of web respectively. Thus, the time tΔ for a web to burn can be obtained from dividing the web thickness (Δ) by the average burn rate:
$$ = \frac {\Delta}{r} = \frac {\Delta}{\left[ \left(a P _ {i} ^ {n} + a P _ {i + 1} ^ {n}\right) / 2 \right]} $$ ( ) 1 2 n n i i t r aP aP ∆ (18) + Substituting for Pi and Pi+1 in Equation (18) then becomes:
| 1 (1−n) S ρ n | (1−n) S ρ n | (1−n) |
|---|
(19) o o where Sbi and Sbi+1 are the two successive burning surface areas of web respectively. The process is repeated for subsequent webs and thus, both pressure in the vessel and time can be determined for each web until the whole propellant burns. The pressure in the wellbore is related to the pressure in the vessel using Equation (15). Thus, the generation of pressure- time profile is possible with pressure from Equation (15) and time as described by Equation (19).

Model for Star Burning Surface Area
The burning surface area of a solid propellant is obtained as the product of the perimeter of the cross-section of the burning surface and the length of the propellant. For a propellant whose burning surface has a shape of star, the perimeter of the cross-section of the star burning surface is 2NS. Thus, first burning surface area is given by:
$$S_{bi} = 2NSL \quad (20)$$
where $N$ is the number of vertices of the star; $S$ is the length of equal sides of the star; and $L$ is the length of the propellant. For pressure prediction, the burning surface area for each successive web to be burnt must be determined. To obtain a successive burning surface area, its star length must be determined and hence the burning surface area can be calculated in the same way as first burning surface area given by Equation (20). However, as shown in Figure 3, an important point that needs to be highlighted is that the vertices of the star tend to become an arc instead of a point for successive burning surfaces as the burning progresses. This makes the length of each side of the star for the successive burning surfaces not to be entirely a straight line but a straight line and an arc as shown in Figure 4. Thus, the length of a side of the successive burning surface is the sum of the lengths of straight line and the arc. Figure 4 shows the schematic diagram for the calculation of the length of a side of the star for a successive burning surface. As shown in Figure 4, the length $|BC|$ of the first burning surface becomes $|PR|$ of the successive burning surface.
$$|PR| = \text{length of arc PQ} + |QR| \quad (21)$$
The steps involved in determining $|PR|$ are as follows:
- Symmetrical lines $|PO|$ and $|XO|$ are drawn to bisect the angles and respectively and meet at center 0.
- The angle $\alpha$ is obtained from dividing $360^\circ$ ($2\pi$ rad) by the number of sides of the star. The number of sides is 2N (two multiplied by the number of vertices).
$$\alpha = \frac{360^\circ}{2N} = \frac{2\pi}{2N} = \frac{\pi}{N} \quad (22)$$
• $\beta$ is obtained by subtracting angle from $180^\circ$ ($\pi$ rad).
$$\beta = \pi - \frac{\theta}{2} \quad (23)$$
• $\alpha, \beta, \phi$ are angles of triangle BCO. Hence, $\phi$ is obtained by subtracting the sum of angles $\alpha$ and $\beta$ from $180^\circ$.
$$\theta = \pi - (\alpha + \beta) = \frac{\theta}{2} - \frac{\pi}{N} \quad (24)$$
• The burn rate is normal to the surface. Thus, angle $= 90^\circ$. The angles $\phi$, and $\omega$ (angle facing the arc PQ) are on a straight line $|PO|$. Hence, $\omega$ is obtained by subtracting the sum of angles $\phi$ and from $180^\circ$.
$$\omega = \frac{\pi}{2} + \frac{\pi}{N} - \frac{\theta}{2} \quad (25)$$
• The arc PQ is then obtained by multiplying the angle $\omega$ by the radius PB (which is the web thickness).
$$|arc PQ| = \Delta \omega = \Delta \left( \frac{\pi}{2} + \frac{\pi}{N} - \frac{\theta}{2} \right) \quad (26)$$
• The length $|QR|$ is obtained by subtracting the length $|CM|$ from the length $|BC|$.
$$|QR| = |BC| - |CM| \quad (27)$$
where $|BC|$ is the length of a side of the star of the first burning surface ($|BC| = S$). $|CM|$ is obtained from solving the right-angled triangle CMR.
$$|CM| = \frac{\Delta}{\tan \left( \frac{\theta}{2} \right)} \quad (28)$$
Substituting for $|BC|$ and $|CM|$ in Equation (27), the length $|QR|$ is thus given by:
$$|QR| = S - \left[ \frac{\Delta}{\tan \left( \frac{\theta}{2} \right)} \right] \quad (29)$$
• Having obtained $|arc PQ|$ and $|QR|$, the length $|PR|$ of each side of successive burning surface is determined from:
$$|PR| = |PQ| + |QR| = \left[ \Delta \left( \frac{\pi}{2} + \frac{\pi}{N} - \frac{\theta}{2} \right) \right] + \left[ S - \Delta \cot \left( \frac{\theta}{2} \right) \right] \quad (30)$$
Therefore, the area of any burning surface $S_{bi}$ of the star propellant from the first burning surface to the last successive burning surface is given by:
$$S_{bi} = 2N |PR| L = 2NL \left\{ \left[ \Delta \left( \frac{\pi}{2} + \frac{\pi}{N} - \frac{\theta}{2} \right) \right] + \left[ S - \Delta \cot \left( \frac{\theta}{2} \right) \right] \right\} \quad (31)$$
where $N$ is the number of vertices of the star; $L$ is the length of the solid propellant; $\Delta$ is the web thickness; $\theta$ is the exterior angle of the star in radians; and $S$ is the length of side of star of the first burning surface. For the first burning surface $i = 1$, the web thickness $\Delta$ is zero and Equation (31) reduces to Equation (20) which is the first burning surface area.
Analysis based on Star Burning Surface Propellant
Comparative Analysis Between Circular and Star Propellant
This section presents the analysis, interpretation, and discussions of the proposition of a star burning surface over a circular burning surface for a solid propellant design for fracturing system.
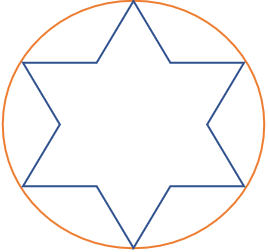
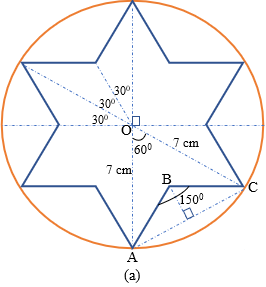
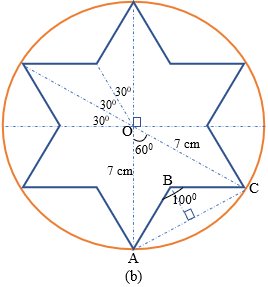
Increase in exposed burning surface area: Figure 5 shows the cross-section of the circular burning surface of a solid propellant and the cross-section of an equivalent star burning surface that could be formed within the circular burning surface. It was observed that with the side of the star having a particular length, the star burning surface can have a higher burning surface area than the circular burning surface. This is found to be dependent on the exterior angle of the star. To illustrate this, two exterior angles 1500 and 1000 were used to obtain the length of side of the star as shown in Figure 6(a) and Figure 6(b) respectively. The angle, at center O, facing each side of the star is obtained from dividing 3600 by the number of sides of the star. For the 1500-exterior angle, the length of side of the star of 6 vertices is calculated by solving the isosceles triangles AOC and ABC in Figure 6(a). First, the base |AC| (which is also the base of isosceles triangle ABC) is found by solving the triangle AOC. Then, with the values of the base |AC| and the vertex angle of the isosceles triangle ABC now known, the side |AB| or |CB| which is the length of side of the star can be determined. The length of side of the star was calculated to be 3.62 cm. Hence, the perimeter of the star shape is 43.44 cm. This value is less than the perimeter of the circular burning surface, of radius 7 cm, which is 44 cm.
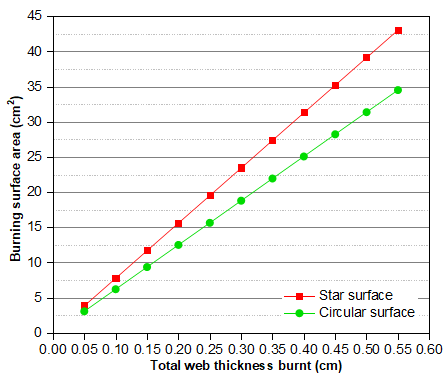
However, when the process is repeated for the 1000-exterior angle, the length of side of the star is 4.57 cm and the perimeter of the star shape is 54.84 cm. This value is greater than the perimeter of the circular burning surface and as a result, it gives a higher burning surface area. Table 1 shows the comparison between the burning surface areas of circular propellant and star propellant (with 6 vertices). These results are obtained for a solid propellant of grain length 10 cm, grain diameter 1.1 cm, web thickness 0.05 cm, and perforation diameter 0.1 cm. As shown in Table 1 and graphically in Figure 7, from the first burning surface area i = 1 to the last burning surface area i = 11, the star propellant has a higher burning surface area than the circular propellant in each stage of web burning. A higher burning surface area means a higher pressure of gas will be generated from the burning propellant. This will leave the gas with more energy for fracture penetration to produce long fractures after the creation of the fractures.
| i | Web Thickness Burnt (cm) | Total Web Thickness Burnt (cm) | Burning Surface Areas (cm2) | |
|---|---|---|---|---|
| Circular Propellant | Star Propellant | |||
| 1 | 0.05 | 0.05 | 3.14 | 3.92 |
| 2 | 0.05 | 0.1 | 6.29 | 7.83 |
| 3 | 0.05 | 0.15 | 9.43 | 11.75 |
| 4 | 0.05 | 0.2 | 12.57 | 15.66 |
| 5 | 0.05 | 0.25 | 15.71 | 19.58 |
| 6 | 0.05 | 0.3 | 18.86 | 23.5 |
| 7 | 0.05 | 0.35 | 22 | 27.41 |
| 8 | 0.05 | 0.4 | 25.14 | 31.33 |
| 9 | 0.05 | 0.45 | 28.29 | 35.25 |
| 10 | 0.05 | 0.5 | 31.43 | 39.16 |
| 11 | 0.05 | 0.55 | 34.57 | 43.08 |
Table 2: Comparison between circular and star burning surface area.
Enhancement of long fractures through left-overs: A solid propellant designed to burn progressively does so in a regular fashion referred to as web burning. Unlike a circular propellant, a star propellant produces left-over propellant after the web burning period. The left-over continues to burn but not in accordance to the pattern of the star-shape. The ability of star propellant to give left-over burning provides energy which complements the energy of the gas from web burning. In other words, it prevents a significant drop in pressure of gas available for fracture extension. In the case of circular propellant that has only web burning, the pressure drops when web burning has finished and the gas begins to lose energy available for fracture extension.
Threshold for Progressive Burning Nature of Star Solid Propellant
A solid propellant can be made to burn regressively, neutrally, or progressively. Regressive burning in which the pressure of gas is at its least value when the whole amount of propellant burns out or neutral burning in which the pressure of gas is the same till the whole propellant burns out could leave the gas with insufficient energy to penetrate deeply into the created fractures and thereby producing short fractures. However, for progressive burning, the pressure of gas is at its peak when the whole propellant burns out. Hence, the gas is at its maximum energy and, unlike in the case of regressive or neutral burning, the gas has more energy for fracture penetration to produce long fractures.
In subsection 3.1.1, it had been shown that the exterior angle of the star is important for a star propellant to have a higher burning surface area. Also, it was found that for a star propellant to give progressive burning, the value of the exterior angle of the star burning surface is a determiner. The propellant must be designed such that the exterior angle of the star is equal to or above a particular value referred to as threshold exterior angle in this paper. An exterior angle less than the threshold value will not give progressive burning. Analysis results also show that the threshold value is different for stars of different number of vertices. Using a propellant grain length of 12 cm, grain thickness 0.5 cm, web thickness 0.05 cm, and a star burning surface of side 0.05 cm, Table 2 shows the results in obtaining the threshold exterior angle for the star with number of vertices N = 4, 5, 6, 7, and 8 with the threshold angles, to the nearest whole number, observed to be 57, 63, 68, 72, and 750 respectively. This means that in the design of a star propellant of 4, 5, 6, 7, or 8 vertices, the exterior angle of the star must be greater than or equal to 57, 63, 68, 72, or 750 respectively in order to give a progressive burning.
For clarity purpose, Table 3 shows the results for a star with 6 vertices. The threshold exterior angle is 680. When the exterior angle is less than 680, the value of the second burning surface area corresponding to i = 2 is lower than the first burning surface area i = 1 and it keeps decreasing as the propellant burning progresses. But with the exterior angle greater than or equal to the threshold value 680, there is an increase in value of burning surface area indicating a progressive burning.
| i | Burning surface areas (cm2) | ||||||||||||||
|---|---|---|---|---|---|---|---|---|---|---|---|---|---|---|---|
| N = 4 | N = 5 | N = 6 | N = 7 | N = 8 | |||||||||||
| θ = 560 | θ = 570 | θ = 580 | θ = 620 | θ = 630 | θ = 640 | θ = 660 | θ = 680 | θ = 690 | θ = 710 | θ = 720 | θ = 730 | θ = 740 | θ = 750 | θ = 760 | |
| 1 | 4.8 | 4.8 | 4.8 | 6 | 6 | 6 | 7.2 | 7.2 | 7.2 | 8.4 | 8.4 | 8.4 | 9.6 | 9.6 | 9.6 |
| 2 | 4.74 | 4.89 | 5.03 | 5.97 | 6.11 | 6.25 | 7.06 | 7.34 | 7.48 | 8.4 | 8.54 | 8.67 | 9.52 | 9.67 | 9.81 |
| 3 | 4.69 | 4.98 | 5.26 | 5.94 | 6.23 | 6.5 | 6.91 | 7.49 | 7.76 | 8.39 | 8.67 | 8.94 | 9.45 | 9.74 | 10.01 |
| 4 | 4.63 | 5.07 | 5.49 | 5.92 | 6.34 | 6.75 | 6.77 | 7.63 | 8.03 | 8.38 | 8.81 | 9.22 | 9.37 | 9.8 | 10.22 |
| 5 | 4.58 | 5.16 | 5.71 | 5.89 | 6.46 | 7 | 6.62 | 7.77 | 8.31 | 8.38 | 8.94 | 9.49 | 9.29 | 9.87 | 10.43 |
| 6 | 4.52 | 5.25 | 5.94 | 5.86 | 6.57 | 7.25 | 6.48 | 7.91 | 8.59 | 8.37 | 9.08 | 9.76 | 9.21 | 9.94 | 10.64 |
| 7 | 4.47 | 5.34 | 6.17 | 5.83 | 6.68 | 7.5 | 6.33 | 8.06 | 8.87 | 8.37 | 9.22 | 10.03 | 9.14 | 10 | 10.84 |
| 8 | 4.41 | 5.43 | 6.4 | 5.8 | 6.8 | 7.75 | 6.19 | 8.2 | 9.15 | 8.36 | 9.35 | 10.31 | 9.06 | 10.07 | 11.05 |
| 9 | 4.36 | 5.52 | 6.63 | 5.77 | 6.91 | 8 | 6.05 | 8.34 | 9.42 | 8.36 | 9.49 | 10.58 | 8.98 | 10.14 | 11.26 |
| 10 | 4.3 | 5.61 | 6.86 | 5.75 | 7.02 | 8.25 | 5.9 | 8.48 | 9.7 | 8.35 | 9.62 | 10.85 | 8.9 | 10.21 | 11.46 |
Table 3: Determination of threshold exterior angle for star propellant of different vertices.
| i | Web | Total Web Thickness Burnt (Cm) | Burning Surface Areas (Cm2) | ||
|---|---|---|---|---|---|
| Thickness Burnt (cm) | θ = 660 | θ = 680 | θ = 690 | ||
| 1 | 0.05 | 0.05 | 7.2 | 7.2 | 7.2 |
| 2 | 0.05 | 0.1 | 7.06 | 7.34 | 7.48 |
| 3 | 0.05 | 0.15 | 6.91 | 7.49 | 7.76 |
| 4 | 0.05 | 0.2 | 6.77 | 7.63 | 8.03 |
| 5 | 0.05 | 0.25 | 6.62 | 7.77 | 8.31 |
| 6 | 0.05 | 0.3 | 6.48 | 7.91 | 8.59 |
| 7 | 0.05 | 0.35 | 6.33 | 8.06 | 8.87 |
| 8 | 0.05 | 0.4 | 6.19 | 8.2 | 9.15 |
| 9 | 0.05 | 0.45 | 6.05 | 8.34 | 9.42 |
| 10 | 0.05 | 0.5 | 5.9 | 8.48 | 9.7 |
Table 4: Result of threshold exterior angle for star with 6 vertices.
Model validity
Model verification
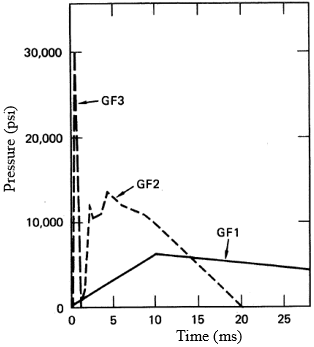
Table 4 provides the values of propellant parameters used in the pressure model and time web burnt model given by Equation (15) and Equation (19) respectively. Vent area of the vessel employed is 2.4 cm2. With a propellant grain thickness of 0.02 m and a web thickness of 0.0005 m, there are 40 steps of the web burning process. Each step corresponds to each exposed burning surface area from the first burning surface area of the first web to the last burning surface area. Because of the 40-step loop involved, a Matlab script was written to carry out the computations in solving the models. As described in subsection 2.2, both pressure and time can be determined for each web burnt (each step of the web burning process) until the whole propellant burns and the generation of pressure-time profile is obtained. The results of the models, that is, the peak pressure and the pressure risetime using the propellant characteristics given in Table 4 are compared with the peak pressure and pressure risetime obtained from the experimental results of Sandia Laboratory [5] when the same propellant characteristics was used. Sandia Laboratories performed three field tests at the Nevada Test Site using these three propellants. The three tests using the gas frac technique were labeled GF1 (a “slow” burning propellant), GF2 (“intermediate”) and GF3 (“fast”). Figures 8 & 9 shows the results for the tests. GF3 has the highest peak pressure but least pressure risetime. GF1 has the highest risetime but least peak pressure while GF2 is in between of the two. As shown in Figure 9, it is only GF2 with a pressure risetime of within 1- to 3-ms produces multiple fractures. Pressure risetime is an important parameter on which the fracture patterns depend. Experimentally, the multiple-fracture regime [3] can be correlated in terms of pressure risetime (tm) by:
8 2 m R R $$ \frac {\pi D}{2 C _ {R}} \leq t _ {m} \leq \frac {8 \pi D}{C _ {R}} \tag {32} $$ where CR is the Raleigh surface wave speed and D is the borehole diameter. For the 4-in borehole and CR of 1050 m/s in ash fall tuff formation rock in the experiments, the pressure rise time range is: 0.15 ms ≤ tm ≤ 2.4 ms. As shown in Figure 11, the results of peak pressure and pressure risetime obtained using the model presented in this paper agree well with the experimental results and thus establishing the validity of the model in predicting the wellbore pressure during solid propellant fracturing system.
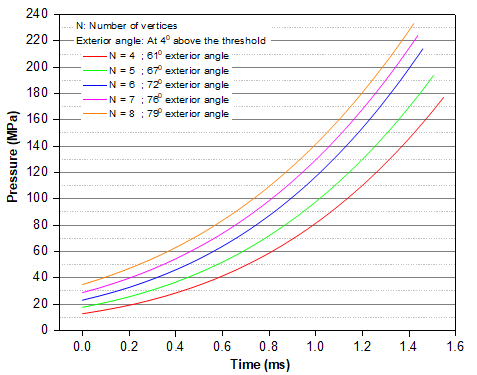
threshold exterior angles. It was observed that with the increase in the number of vertices of the star propellant, the peak pressure increases while the pressure risetime decreases. For the same set of vertices, pressure-time curves are obtained at 40 above the threshold exterior angles, the results are shown in Figure 11. The peak pressures for 4, 5, 6, 7, and 8 vertices are 177-, 193-, 214-, 224-, and 233-MPa respectively. Thus, depending on the fracturing pressure of the formation, a choice could be made regarding the number of vertices to be used. Moreover, each of the curves progresses well from the initial pressure and maintains a close range of pressure risetime. Hence, the exterior angle of the star propellant should be designed to be above its threshold angle.
| Value | |
|---|---|
| Grain length (m) | 0.12 |
| Grain diameter (m) | 0.041 |
| Perforation diameter (m) | 0.001 |
| Web thickness (m) | 0.0005 |
| Length of each side of the star (m) | 0.0005 |
| Density (kg/m3) | 1800 |
| Isochoric flame temperature (K) | 3000 |
| Burn rate constant, a (kg/m3) | 0.0287 |
| Burn rate constant, n | 0.312 |
| Propellant gas constant | 189 |
| Specific heat ratio | 1.289 |
Table 5: Characteristics of Solid Propellant.
N: Number of vertices TEA: threshold exterior angle
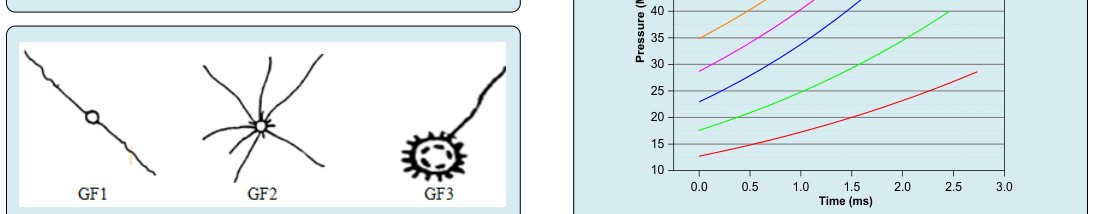
Figure 10 shows the pressure-time curves for a star propellant of 4, 5, 6, 7, and 8 vertices at their respective Figure 10: Pressure-time profile with different vertices at respective threshold exterior angle.
Influence of Various Exterior Angles and Opening Areas on Pressure-Time Profile
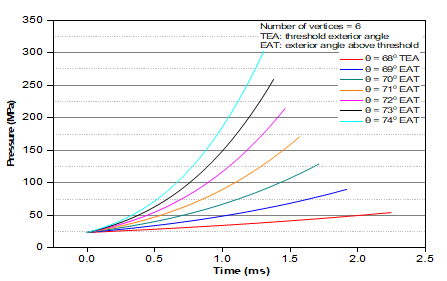
Effect of exterior angles: The effect of exterior angles above the threshold angle has been investigated on the peak pressure and pressure risetime for a specific number of vertices. A star propellant of 6 vertices was used with exterior angles: 69, 70, 71, 72, 73, and 740 which are all above its threshold exterior angle of 680. As shown in Figure 12, an increase from 1 to 40 (that is, exterior angles of 69, 70, 71, and 720) above the threshold angle give a pressure of 89-, 128-, 170-, and 214-MPa respectively.
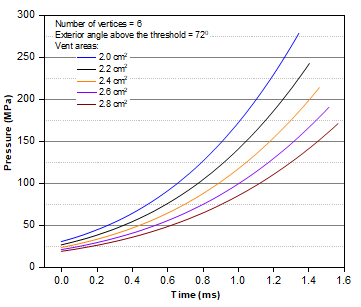
This is in a good range of fracturing pressures of Ash fall tuff and Devonian shale formations used in Sandia laboratories experiments. For a 50 or more above the threshold angle, the peak pressure is higher than the fracturing pressure range and it is disastrous to the formations. Hence, while it is necessary that the exterior angle of the star propellant should be above the threshold angle, the exterior angle should be at most 40 above the threshold angle. This is consistent with the results shown in Figure 11 for different vertices of exterior angles at 40 above their respective threshold angles. Effect of vent area: The effect of vent (openings) area was investigated on the pressure peak and pressure risetime for a star propellant of 6 vertices. With all other parameters unchanged, the vessel vent area has a significant effect on the peak pressure of gas generated and pressure risetime as shown in Figure 13. An increase in vent area from 2.4- to 2.8-cm2 decreases the peak pressure from 214- to 171-MPa, and increases the pressure risetime from 1.46- to 1.57-ms. On the other hand, a decrease in vent area from 2.4- to 2.0- cm2 increases the peak pressure from 214- to 278-MPa, and decreases the pressure risetime from 1.46- to 1.35-ms. Hence, an accurate vent area of the vessel is important to achieve the desired peak pressure necessary for fracturing formations.
Design of Vessel Vent Area
The model is also valid for designing the vessel vent area for the release of gas from burning propellant into the wellbore. For formations whose fracturing pressures are known, to employ the fracturing system described in section 1, an appropriate vent area for the vessel is important to ensure that the pressure in the vessel does not exceed its burst strength. With the wellbore pressure model (Equation (15)), the area of the vents can be designed with a computer program based on the propellant burn characteristics such that the pressure produced by the gas within the vessel does not exceed the vessel burst strength while a desired fracturing pressure in the wellbore outside the vessel is maintained. Fracturing pressures of some formations were used in the model so as to design the area of vents that would be suitable if the propellant fracturing system were used for fracturing such formations. The fracturing pressure data used was from the experimental results obtained from the tests carried out on some formations [12]. The results of the appropriate vents areas of the vessel for such formations are shown in Table 5.
| Test | Host rock | Peak Pressure (MPa) | Designed Area of Vents (cm2) |
|---|---|---|---|
| Miegs | Devonian shale | 204 | 0.00019 |
| Rowan | Devonian shale | 146 | 0.00024 |
| Proof | Ash fall tuff | 147 | 0.00024 |
Table 6: Designed vessel vent area for formations.
Conclusion
In this paper, an improved modeling of solid propellant fracturing system to produce long fractures in wellbore formations is presented. A design system is proposed in which the propellant is housed in a vessel for protection from wellbore fluids with openings or vents on the vessel to allow high energy gases produced to flow into the wellbore and subsequently into the fractured formation surrounding the wellbore. On this basis, a model was developed for the fracturing process using laws of conservation of mass and energy, and applying a concept of choked flow in the vents to relate the conditions in the wellbore (outside the vessel) to the conditions in the vessel. As sufficient energy is required for fracture pressurization so as to produce long fractures after fracture creation, a burning surface of a star-shape was considered for the propellant and the calculations carried out show that it gives a higher burning surface area than the conventional circular burning surface area.
In the light of the observations made from this study, the following conclusions can be drawn:
- The model in this paper has a new contribution in which the gas pressure in the wellbore is calculated as a function of pressure condition of gas from burning propellant in a vessel. Thus, the difficulty in obtaining the true effective free volume of the wellbore when using equation of state is avoided.
- The peak pressure and pressure risetime for multiple fractures predicted by the model in this paper agree well with those obtained from the experiments.
- A star propellant, at some specific exterior angles of the star-shape, gives a higher burning surface area than a circular propellant. Hence, a star propellant gives a higher pressure and proves to be more effective as it provides more energy for fracture pressurization to produce long fractures than a circular propellant.
- For a star propellant to give progressive burning, the value of the exterior angle of the star burning surface is a determiner. The propellant must be designed such that the exterior angle of the star is equal to or above the threshold exterior angle. Also, the threshold exterior angle was found to be a function of the number of vertices of the star. The threshold exterior angles 57, 63, 68, 72, and 750 below which the star propellant will not give progressive burning are for 4, 5, 6, 7, and 8 vertices respectively.
Acknowledgements
The authors gratefully acknowledge the financial support of the National Natural Science Foundation of China (NNSFC: No. 51434009 and No. 51774301). The authors also wish to express their appreciation to China National Offshore Oil Corporation (CNOOC) for their assistance and resources that helped in the actualization of this research work.
References
-
Kutter HK, Fairhurst C (1971) On the fracture process in blasting. Int J Rock Mech Min Sci 8(3): 181-188.
-
Nilson RH, Proffer WJ, Duff RE (1985) Modelling of gas-driven fractures induced by propellant combustion within a borehole. Int J Rock Mech Min Sci 22(1): 3-19.
-
Cuderman JF, Chu TY, Jung J, Jacobson RD (1986) High energy gas fracture experiments in liquid-filled boreholes potential geothermal application. Sandia National Laboratories SAND85-2809, Albuquerque, New Mexico, USA.
-
Yang W, Zhou C, Qin F, Li D (1992) High-energy gas fracturing technology: research and application. European Petroleum Conference, SPE-24990-MS. France.
-
Chu TY, Jacobson RD, Warpinski W (1987) Geothermal well stimulated using high energy gas fracturing. Proceedings of the Twelfth Workshop on Geothermal Reservoir Engineering, Stanford University, Stanford, California.
-
Donze FV, Bouchez J, Magnier SA (1997) Modelling fractures in rock blasting. Int J Rock Mech Min Sci 34(8): 1153-1163.
-
Cho SH, Nakamura Y, Kaneko K (2004) Dynamic fracture process analysis of rock subjected to stress wave and gas pressurization. Int J Rock Mech Min Sci 41(1): 433-440.
-
Zhu Z, Mohanty B, Xie H (2006) Numerical investigation of blasting-induced crack initiation and propagation in rocks. Int J Rock Mech Min Sci 44(3): 412-424.
-
Goodarzi M, Mohammadi S, Jafari A (2015) Numerical analysis of rock fracturing by gas pressure using the extended finite element method. Pet Sci 12: 304-315.
-
Malhorta S, Rijken P, Sanchez A (2018) Experimental investigation of propellant fracturing in a large sandstone block, Offshore Technology Conference, OTC-27563-MS.
-
Taylor LM, Swenson DV, Cooper PW (1984) A coupled gas flow solid dynamics model for predicting the formation of fracture patterns in gas well simulation experiments. Sandia National Laboratories Report, SAND84-0016, Albuquerque, California, USA.
-
Tiernan JP, Spear GB, Landis D (2013) Propellant fracturing system for wells. United States Patent, Patent No.: US 8,522,863 B2.
- Nigeria’s Vulnerability in the Face of Global Energy Policy
- A Simulation Study of Investigation of Optimum Oil Production Performance by Applying Various Gas Injection Methods in Oil Reservoir
- Characterization of Permo-Triassic Reservoirs through Thermal Maturity Assessment of Westphalian Source Rocks in the Cheshire Basin
- Influence of Microwax on the Rheological and Thermal Behaviour of a Wax Crude Oil
- Real-Time Monitoring and Performance Optimization of Steam Injection in Heavy Oil Reservoirs Using Fiber Optic Sensing and Integrated Predictive Simulation Models
- Rapid On-Site Determination of the Total Petroleum Hydrocarbon Content of Soils by Handheld Fourier Transform Near-Infrared Spectroscopy: Development of a Global, Site- and Scanner- Independent Calibration Model